
Live, Governed Data in Excel: The Complete Guide (No Exports)
How to bring live, governed data into Excel — as native formulas that refresh on demand, no exports. Methods, governance, per-warehouse setup, and role-by-role use cases.


Excel is where an enormous amount of real work still happens — the models, the reconciliations, the board packs, the ad-hoc pulls someone needs by end of day.
And yet the data that reaches Excel almost always arrives the same way: as a dead export, filtered and re-keyed by hand, stale the moment it lands.
This guide is the map for doing it differently — bringing live, governed data into Excel so the numbers refresh in place, mean the same thing everywhere, and never leave the tool your teams already know. It’s the hub; the linked articles go deep on each piece.
TL;DR
- The problem was never Excel. It’s that data reaches Excel as a manual export — so it’s stale, ungoverned, and rebuilt from scratch every cycle.
- The fix is to bring governed data to Excel, not move people out of it: connect Excel to your warehouse through a governed model, so trusted data lands as native Excel formulas you refresh on demand.
- Four things make that work: datasets from a governed semantic layer, native formulas (not a static report), refresh on demand, and governance that follows the signed-in user.
- It’s genuinely useful across roles — FP&A month-end packs, analyst what-if, RevOps reporting — and across warehouses: Snowflake, Databricks, BigQuery.
- It stays in its lane: ad-hoc analysis and reporting live in Excel; interactive, shared, operational workflows live in Astrato Data Apps.
- Jump-off points to the deep-dives are linked throughout.
Why “getting data into Excel” keeps coming up
Two things are true at once in most data-mature companies. The governed, current version of the business lives in a cloud data warehouse — Snowflake, Databricks, BigQuery — modelled and access-controlled.
And a huge share of the actual analysis still happens in Excel, because Excel gives people flexibility that a dashboard can’t: lay a P&L out exactly how leadership reads it, build a bespoke model, run a quick calculation nobody planned for.
The bridge between those two worlds is usually a person, doing it by hand.
They export a query to CSV, clean it, paste it into a template, reformat it, and rebuild whatever broke. The result is stale before it’s finished, disconnected from the definitions everyone else uses, and impossible to govern once it’s a loose copy on a laptop.
Multiply that across every recurring report and you get the familiar symptoms: “which number is right?”, version chaos, and skilled people spending their days on data logistics.
Searches like “connect Excel to a data warehouse”, “refresh an Excel report from the database”, and “live data in Excel” are all really asking the same thing: how do I stop doing this by hand?
The principle: bring the data to Excel, don’t move people out of it
For a long time the industry’s answer was to pull people out of Excel and into a new tool. It rarely works — finance isn’t leaving the spreadsheet, and no number of dashboards will change that. So the more durable answer is the opposite: leave people in Excel, and bring governed data to them.
That’s what a warehouse-native BI layer makes possible. Instead of Excel talking to the warehouse through a local driver and a raw query, Excel connects to a governed model that runs live on the warehouse.
Trusted, defined data lands in the grid as native Excel formulas you can refresh whenever you need to — no export, no re-keying.
One boundary keeps this honest. Ad-hoc analysis, personal models, forecasts and established reporting packs belong in Excel — that’s what this whole guide is about.
But interactive, shared, operational workflows — collaborative budgeting, approvals, anything where people enter values that get committed and shared back — belong in Astrato Data Apps, a governed workflow surface. Excel is for working on trusted data; Data Apps are for teams acting through it.
Signs your team needs live data in Excel
Manual exports don’t announce that they’ve outgrown their usefulness — they just quietly get more expensive. A few patterns are the tell:
- The same report is rebuilt from a fresh export on a fixed cadence — every week, every month — by someone whose time is worth far more than data entry.
- Two versions of a number circulate, and meetings open by reconciling them instead of acting on them.
- Sensitive data leaves the warehouse in spreadsheets that nobody can govern once they’ve been emailed around.
- A version-control-by-filename system has appeared (Report_v7_FINAL_v2), which is a polite way of admitting there’s no source of truth.
- Analysts spend the first hour of every cycle formatting and re-keying rather than analysing.
If two or more of those sound familiar, the bottleneck isn’t Excel — it’s the manual pipe feeding it. Everything below is about replacing that pipe.
How it works: the four building blocks
Everything in this cluster rests on four ideas. Here’s the overview; each links to where it’s covered in depth.
1. Datasets from a governed semantic layer. Instead of pulling raw tables and columns, you build a dataset — a reusable, named query — from your governed model. You pick defined measures and dimensions (“net revenue”, “active customers”), not raw ledger fields. In practice, that means the person building the report chooses from a curated list — the same measures the BI team publishes — rather than guessing at column names and join logic. That’s what keeps the numbers consistent everywhere.
2. Native Excel formulas, not a static report. What lands in the cell is a real Excel formula, not a screenshot or an embedded picture of your data. So your PivotTables, XLOOKUPs, named ranges, charts and formatting all work on it exactly as they always have. A returned figure isn’t frozen, either — reference it, wrap it in your own calculation, or feed it into a chart, exactly as you would any cell.
3. Refresh on demand. Each dataset has a refresh mode, so you decide how live it is — refresh manually, only when there’s no cached result, or whenever the sheet recalculates. For a shared file, that same setting controls what a recipient sees: the cached numbers without your connection, or a fresh pull with their own access. This is the mechanism that kills the month-end export loop: build once, refresh next cycle.
4. Governance that follows the signed-in user. Every refresh respects the individual’s permissions, and every dataset runs on the same definitions as your dashboards. So a regional controller and a group analyst can open the same file and each see only the entities their role allows — the report enforces access rather than relying on the honour system. Governance reaches the spreadsheet instead of stopping at the warehouse door — the subject of the governed-data-in-Excel deep-dive.
The ways to get warehouse data into Excel today
There are three practical routes, and it’s worth knowing where each fits.
Manual export to CSV. The universal fallback: run a query, export, open in Excel. Fast exactly once, and stale forever after. No refresh, no governance, no lineage.
Power Query and an ODBC connection. Excel’s built-in Get Data can connect to a warehouse through a driver and refresh with a “Refresh All”. It’s a real step up from CSVs, but you’re still pulling raw tables, defining every metric yourself, managing the driver and DSN, and refreshing with no per-user governance. The full walkthrough — including the Snowflake ODBC driver, authentication and its limitations — is in Connect Snowflake to Excel.
A governed BI add-in. The Astrato Excel Add-in brings governed datasets in as native formulas — live, refreshable, and governed by design, with no ODBC driver to maintain. This is the route the rest of the cluster builds on.
The honest summary: the native routes answer “how do I get this data into Excel once?” A governed add-in answers “how does my whole team run on warehouse data from Excel, safely, month after month?”
By use case and role
The value shows up differently depending on who’s holding the spreadsheet.
FP&A and finance. The month-end reporting pack is the classic case: a P&L, a balance sheet and a KPI summary that get rebuilt from a fresh export every close. Build the pack once with governed datasets, and each cycle you change the period and press Refresh — the figures update, the pivots re-point themselves, and the headline numbers tie to the board deck. Deep-dive: Refreshable finance reports in Excel.
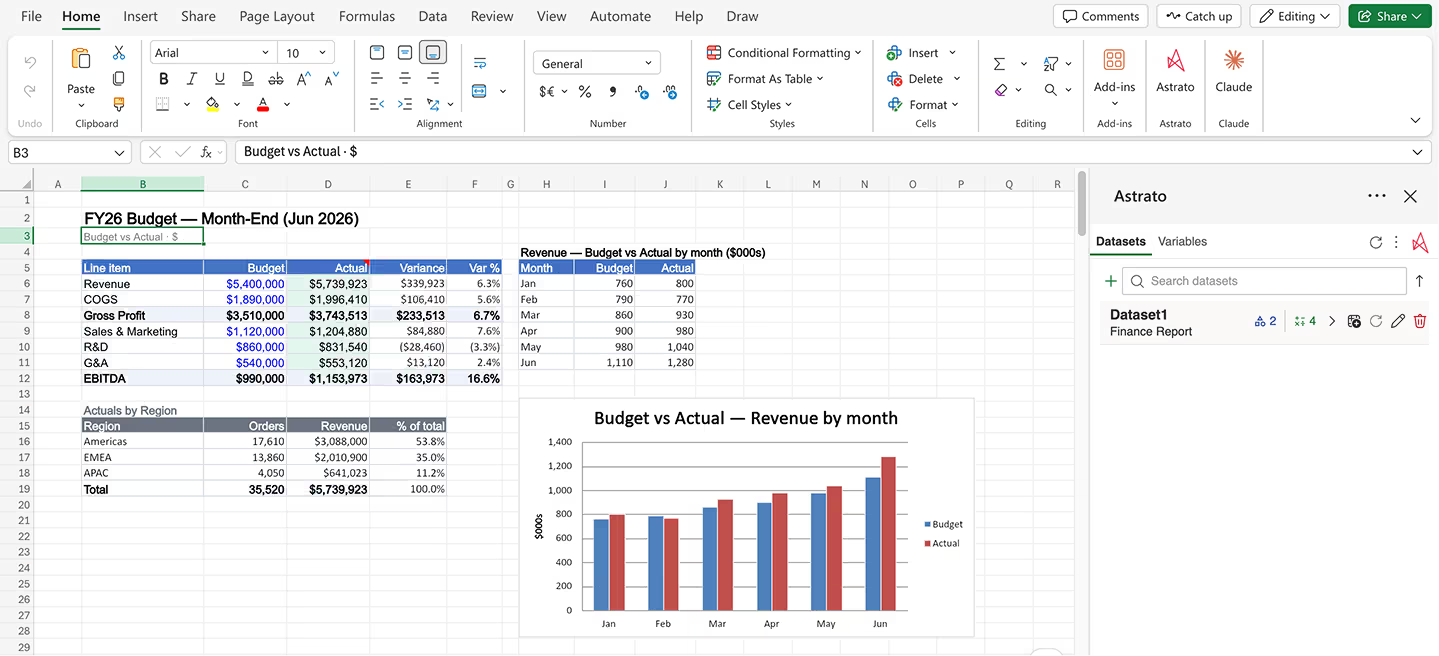
Analysts running scenarios. Any model that asks “what if?” — a price change, a new region, a different growth rate — normally starts with another export. Wire an assumption to a cell instead, and changing it re-queries live data underneath, so the scenario runs against the current source rather than a snapshot. Deep-dive: What-if analysis in Excel on live data.
RevOps and operations. Pipeline reports, territory splits, and recurring operational workbooks tend to be rebuilt weekly from a CRM or warehouse export. As a refreshable dataset, the same workbook stays current with a click, so the ops review runs on this morning’s data, not last Friday’s. Deep-dive: A live pipeline report in Excel.
Data and BI teams. For the team that owns governance, the win is subtraction: one fewer ungoverned copy for every export replaced. Extending row-level security and shared definitions into the spreadsheet means people keep using Excel without spawning shadow copies the data team can’t see or trust. Deep-dive: Governed data in Excel — ending shadow spreadsheets.
By warehouse
Because a warehouse-native layer is agnostic to the platform underneath, the Excel workflow is the same wherever your data lives — only the connection your data team configures once differs.
- Snowflake: Connect Snowflake to Excel
- Databricks: connect Databricks to Excel (coming in this cluster)
- BigQuery: connect BigQuery to Excel (coming in this cluster)
If you run more than one platform, that consistency is its own quiet benefit — one way of working in Excel, whatever the data sits on.
Governance and security, in short
Because this is where a governed approach earns its keep, it’s worth stating plainly what carries through:
- One definition, everywhere. Datasets run on the same semantic layer as your dashboards, so a line item in Excel is identical to the same line on the dashboard. Change a measure once and it updates across every report.
- Access follows the person. Every refresh respects the signed-in user’s permissions — the same row-level rules your warehouse enforces, extended into the report. Two people open the same file and each sees only what they’re allowed to.
- Credentials belong to the user, data belongs to the file. Your connection is never written into the file. Share it and the recipient reads your last refreshed figures with no login and no exposure of your connection — and, because the last refresh is cached, the numbers are there even offline. More on this in Share an Excel file without sharing your credentials.
How it fits your existing data stack
This doesn’t ask you to change your architecture — it sits on top of it. Astrato is warehouse-native, so it runs analytics directly on Snowflake, Databricks or BigQuery without extracting or copying data.
If your team already models in a semantic layer or with tools like dbt, that governed logic is exactly what the datasets in Excel draw on: measures and definitions live once, in the model, and every surface — dashboards, data apps, and now Excel — inherits them.
Row-level security and permissions are inherited from the warehouse, so there’s no second access system to maintain.
And because the connection to your source — whether that’s a cloud warehouse or an ERP like Business Central or Dynamics — is configured once at the platform level, individual analysts never wire up credentials or drivers in Excel.
In short: your governance, your model, and your source of truth stay exactly where they are. Excel simply becomes another governed surface on top of them, alongside the dashboards and apps that already run on the same foundation.
Getting started
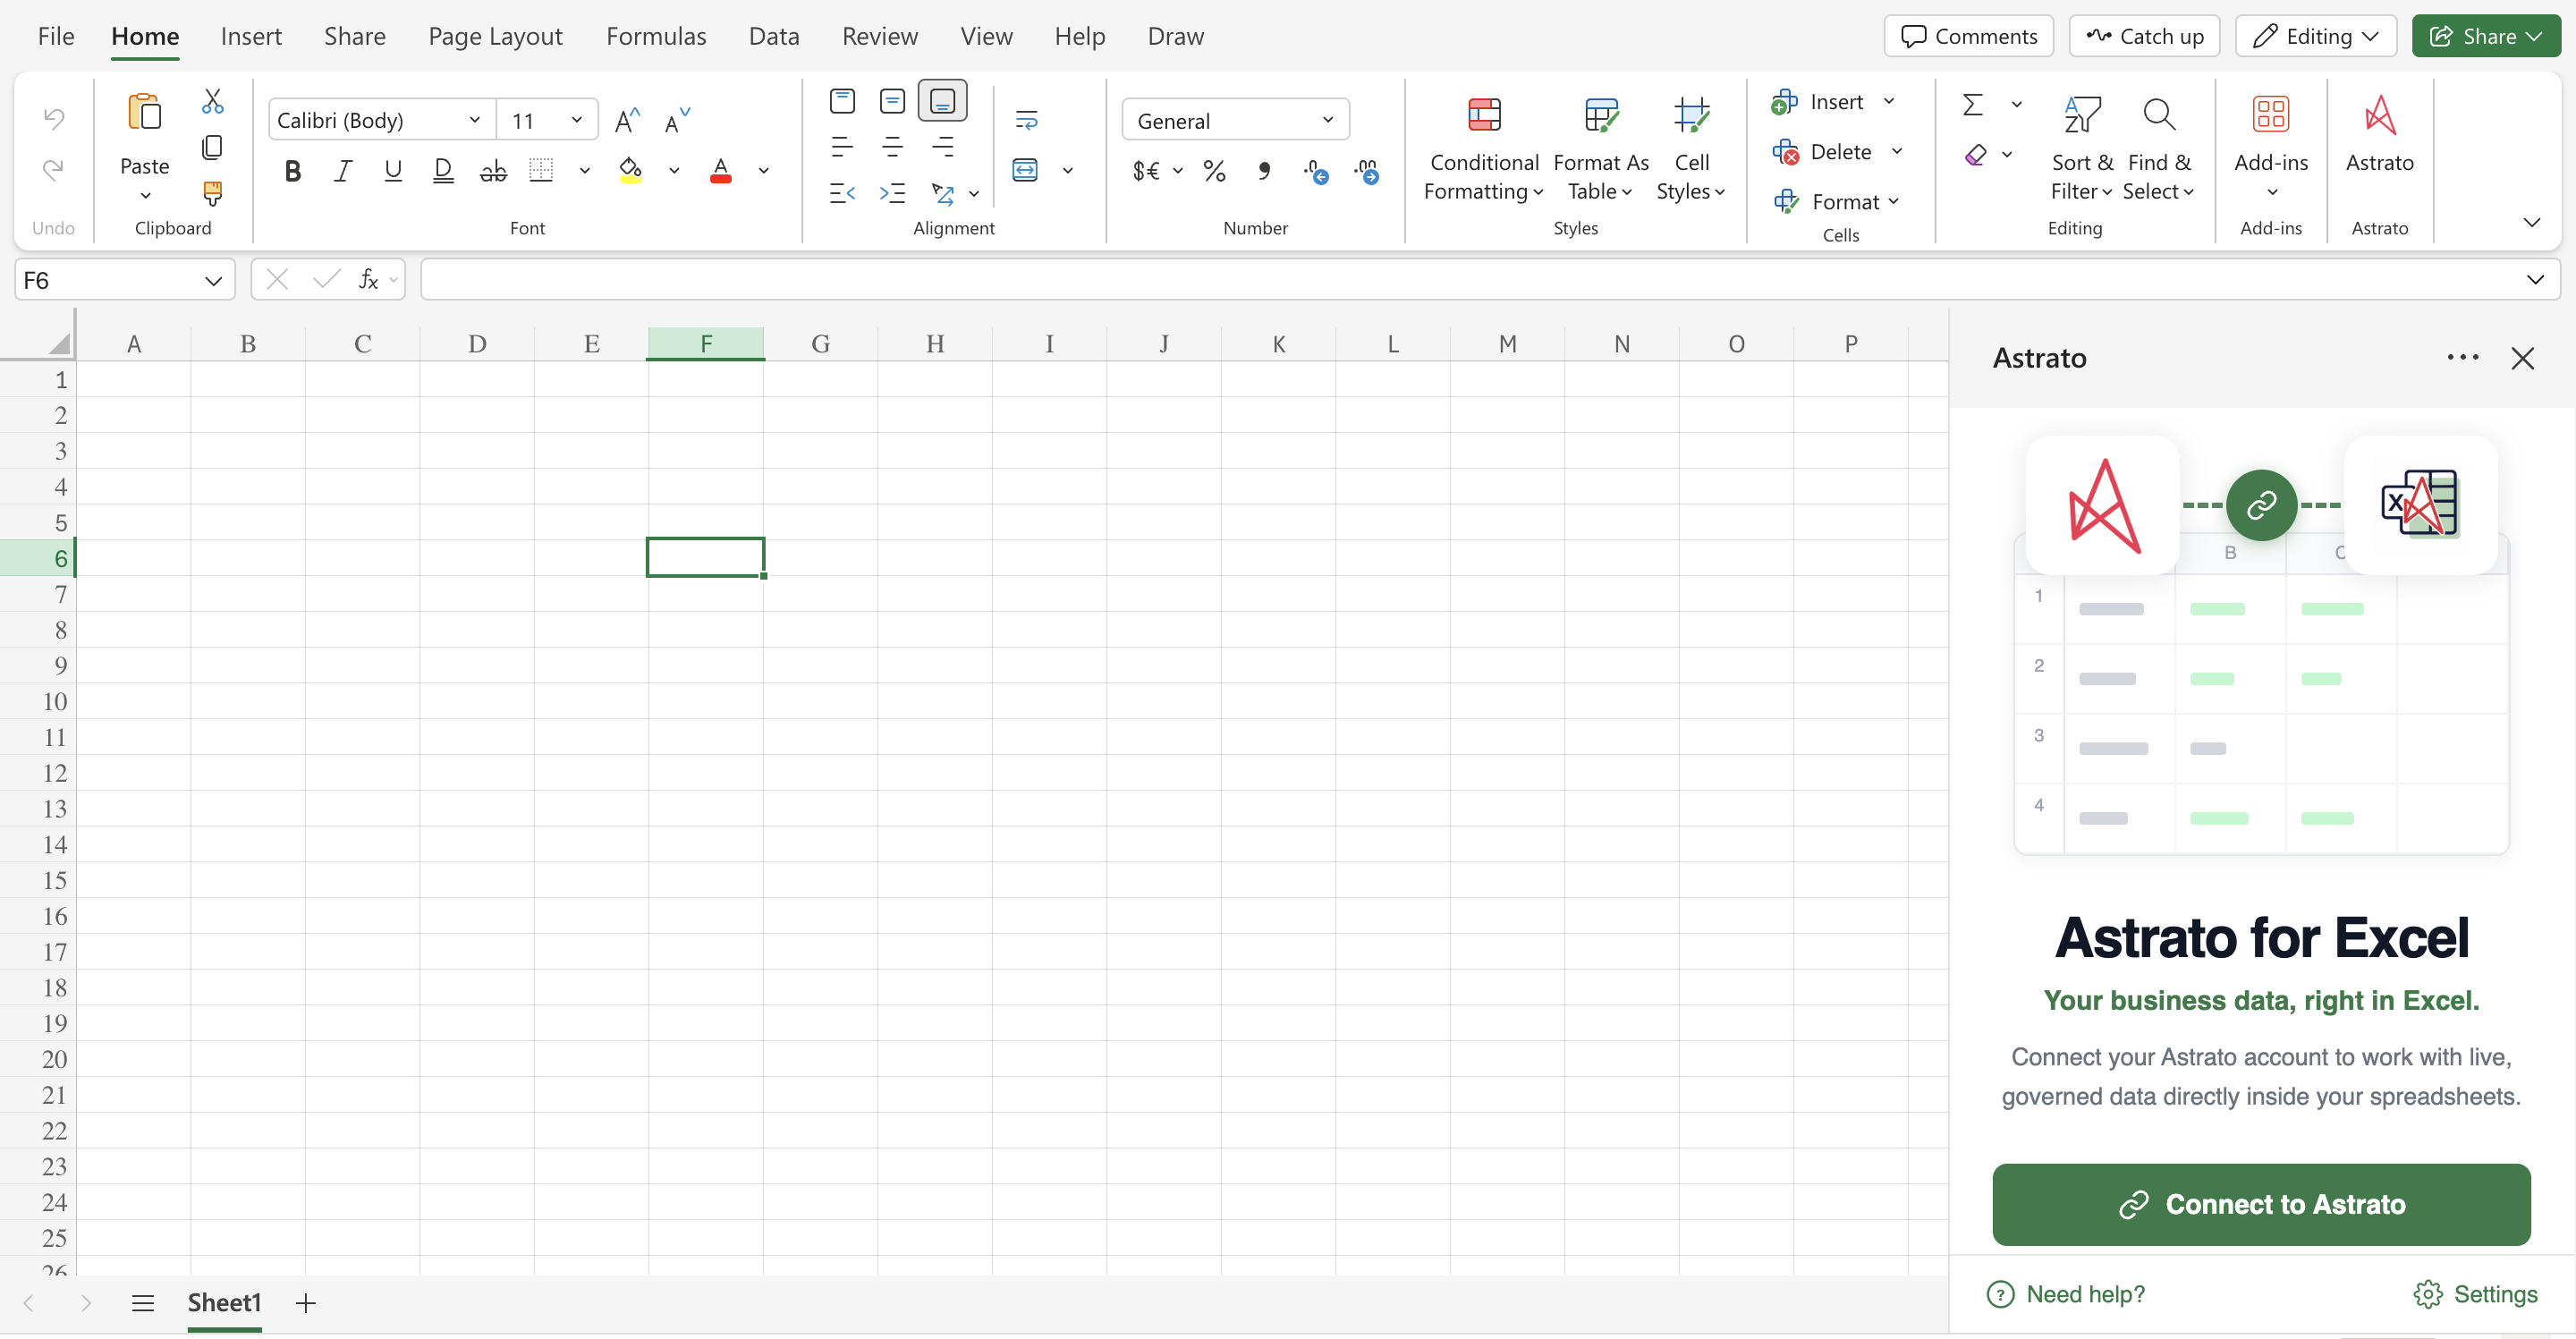
The setup splits cleanly in two. Your data team connects Astrato to your warehouse once, at the platform level, and models the semantic layer. After that, anyone can install the Excel Add-in from Microsoft Marketplace (or have IT deploy it centrally), sign in, build a dataset, and pull it into a cell as a formula. There’s no ODBC driver, no DSN, and no per-analyst configuration.
From there, the pattern is always the same: build the report once, and refresh it whenever the numbers change. See it end to end on the Excel Add-in product page, or read the launch announcement for the why behind it.
Frequently asked questions
What does “live data in Excel” actually mean?
That the numbers in your spreadsheet come from a query you can refresh, not a fixed export. With the Astrato Excel Add-in, data lands as native formulas you refresh on demand — so a refresh pulls current data rather than reopening a stale snapshot.
Do I have to leave Excel or learn a new tool?
No. The whole point is the opposite. Data arrives as ordinary Excel formulas, so your existing pivots, models, formulas and formatting keep working. You remove the manual data step from the tool you already use.
Will the numbers match our dashboards?
Yes. Everything runs on the same governed semantic layer, so a figure in Excel is the same figure on the dashboard by construction — there’s no hand-summed export to drift.
How is this different from Power Query?
Power Query connects Excel to a database and refreshes raw tables. A governed add-in adds the layer above that: defined metrics instead of raw columns, per-user governance instead of shared credentials, and no driver to maintain. Both refresh; only one keeps the numbers governed and consistent.
Which cloud warehouses are supported? S
nowflake, Databricks, BigQuery and other modern platforms, through Astrato. The Excel experience is identical across them.
Can people enter and save values from Excel?
Not from Excel today — the Add-in brings governed data into the report and refreshes it. Entering values that get committed and shared back is a governed workflow, which is what Astrato Data Apps are for. Writeback from Excel is on the way.
Is it secure to share a file with warehouse data in it?
Yes. Your credentials are never written into the file, so sharing a file never shares your connection. Recipients read your last refresh with no login and refresh with their own access if they want live data.
Does this work on Excel for Mac and Excel on the web?
Yes — Excel on Windows, Mac and the web, delivered as a Microsoft 365 Integrated App that IT can deploy centrally. This is one area the native driver route struggles: a local ODBC driver isn’t available to Excel on the web, and the Mac experience differs from Windows. A governed add-in behaves the same everywhere.
Next steps
If your teams live in Excel but your data lives in a warehouse, the shortest path is to try it on a report you already run.
- Explore the Excel Add-in product page.
- Book a walkthrough and we’ll run it on your own data.
Ready to experience next-gen analytics?
See how Astrato runs natively in your warehouse.