
Refreshable Finance Reports in Excel: End the Month-End Export
Build your month-end finance pack once and refresh it in a click. Keep your pivots, formulas and formatting — pull live, governed data into Excel instead of re-exporting every cycle.


Every finance team knows the month-end ritual. Pull the actuals, clean them up, re-key them into the template, reapply the formatting, rebuild the pivots, and reconcile it against last month’s version — then do the whole thing again in thirty days. This guide is about breaking that loop: building a month-end finance pack in Excel once, and refreshing it from the source with a click, instead of re-exporting and rebuilding every cycle.
TL;DR
- The month-end export loop is expensive not because Excel is bad at reporting, but because the data reaches Excel as a dead export — so every cycle means re-exporting, re-keying, reformatting, and rebuilding pivots and formulas from scratch.
- The fix isn’t to leave Excel. It’s to connect the report to live, governed data so the numbers refresh in place and your layout, formulas and formatting stay exactly as you built them.
- Power Query and a database connection get you part of the way — data refreshes on a “Refresh All” — but the business definitions and governance depend on how the source and connection are configured, and the connection is one more piece of reporting infrastructure to maintain.
- The Astrato Excel Add-in pulls governed datasets into the report as native Excel formulas. Build the pack once; next month you hit Refresh and every model, PivotTable and chart updates from the same figures that power your dashboards.
- Your pivots, XLOOKUPs, named ranges, Power Pivot models and conditional formatting all survive the refresh — it’s real Excel, connected to live data.
- Your P&L lines start from the same governed definitions as the board deck — the same semantic layer, not a hand-summed export — so metric-definition drift stops being the reason two reports disagree.
What the month-end export loop actually costs
Open any finance analyst’s calendar and you’ll find the same block reserved at the start of every month. The task looks small — “update the reporting pack” — but the steps behind it are anything but:
- Export the actuals. Run a query in the warehouse or the ERP — Business Central, Dynamics GP, or whatever holds the ledger — and export the result to a CSV or a raw extract.
- Clean and re-key. Filter out what you don’t need, fix the columns, and paste the values into your income statement and balance sheet templates.
- Reformat. Reapply number formats, currency, conditional formatting, and the layout the board expects. Every export lands as raw data with none of your styling.
- Rebuild the pivots and formulas. Point your PivotTables at the new range, refresh your XLOOKUPs and named ranges, and check that nothing broke when the row count changed.
- Reconcile the version. Confirm you’re working from the right file, because “Reporting_Pack_Oct_FINAL_v3” is sitting in three inboxes and two of them have been edited.
None of these steps is hard. Together, done twelve times a year, they add up to days of skilled finance time spent on data logistics instead of analysis — and each hand-off is a place for an error to creep in. Worse, the pack is stale the moment it’s built. The actuals keep moving in the source system; your exported snapshot doesn’t. By the time the pack lands in the board meeting, it’s measured against numbers that were already a few days old when they were pasted in.
The frustrating part is that the spreadsheet was never the problem. Excel is genuinely excellent for financial reporting — the flexibility to lay out a P&L exactly how leadership reads it, the pivots, the formulas, the bespoke outputs each report needs. The problem is everything that happens around the spreadsheet to get data into it.
Why the usual fixes only go halfway
If you’ve searched “how do I stop re-exporting data into my monthly Excel report” or “refresh an Excel report from the database automatically,” you’ve probably run into a few partial answers.
Templates alone don’t refresh. A well-built financial reporting template saves you the layout work, but it doesn’t connect to anything. You’re still pasting fresh values into it every month. It streamlines the formatting, not the data.
Power Query and a data connection help — up to a point. Excel’s Get Data experience can connect to a database or warehouse through ODBC, and once it’s set up you can press Refresh All to pull new data. That’s a real improvement over CSV exports: the data connection is reusable and the refresh is one action. But Power Query solves the recurring connection — not the layer above it. The business definitions aren’t provided by Power Query itself, so every metric — net revenue, gross margin, EBITDA — is however you chose to calculate it in the sheet, and it can drift from how the same metric is defined on the dashboards. Governance depends on how the upstream source and connection are configured, not on the query. And the connection itself becomes another piece of reporting infrastructure someone has to build and maintain for every report.
A raw SQL data source has the same shape. More control, same trade-off: the definitions, the refresh mode and the governance are configured around the connection, not carried by it.
The pattern is clear. Getting connectivity is solved. Getting governed, defined, refreshable numbers into the report — the version that matches the board deck and follows each person’s access — is the part that’s still missing. That’s what a semantic layer adds on top: finance pulls the same governed measures that power the dashboards, instead of recreating them in the workbook.
The shape of a refreshable finance pack
The key to a pack you never rebuild is separating the two things a finance workbook actually does: holding the data and presenting the report. Astrato keeps the source datasets — P&L, balance sheet, KPIs — governed and refreshable; Excel stays responsible for the finance model and presentation built on top. Draw a clean line between the two and the monthly rebuild disappears, because refreshing the data layer never disturbs the reporting layer.
Here’s the outcome that gives you: you build the pack once — the P&L, the balance sheet, the KPI summary, laid out and formatted exactly how leadership reads them — and each month you open last month’s file and press Refresh. Every figure updates from the source. Your pivots re-point themselves. Your charts redraw. Your conditional formatting still works. Nothing is rebuilt, because nothing was torn down.
That only works if the numbers arriving in the sheet are (a) live, so a refresh actually pulls current data, and (b) governed, so they mean the same thing every month and match every other report. That’s what a warehouse-native BI layer adds on top of a plain data connection.
How to build a refreshable finance report with the Astrato Excel Add-in
The Astrato Excel Add-in connects Excel directly to your governed data and brings it into the grid as native Excel formulas and reusable datasets. The build follows the two layers above — get the data layer right first, then put your reporting on top. It assumes your data team has already connected Astrato to your warehouse or ERP once, at the platform level.
1. Connect Excel to Astrato. Add the Add-in from Microsoft Marketplace via the Excel Home ribbon (or have IT deploy it centrally), open the Astrato panel, and sign in. Your connection lives in your Office settings, not in the file.
2. Build the governed finance datasets. In the panel, create a dataset for each part of the pack — a P&L dataset, a balance-sheet dataset, a KPI dataset. You pick dimensions, measures and fields from your governed semantic layer, so you’re choosing defined line items, not raw ledger columns. Measures such as net revenue and gross margin come from the semantic layer — Excel doesn’t redefine them. Add the filters you need: period, entity, cost centre.
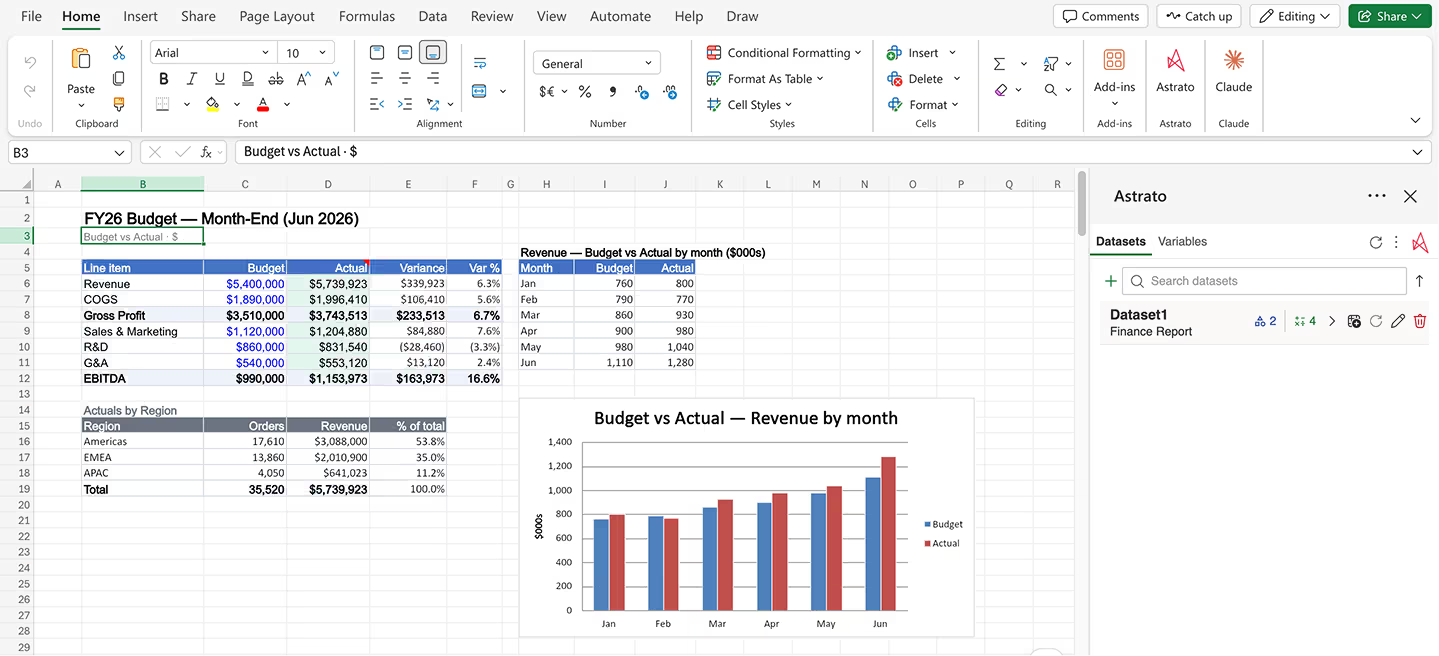
3. Land each dataset on its own data tab. Pull the datasets onto dedicated, hidden data sheets rather than straight into the formatted report — Data_P&L, Data_BalanceSheet, Data_KPIs. Your report tabs (P&L, Balance Sheet, Executive Summary) then reference those sheets. This is the clean line between data and presentation: a refresh lands in one place and never disturbs your layout.
4. Build the finance model on top. On the report tabs, add your PivotTables, Power Pivot models, XLOOKUPs, named ranges, dynamic-array formulas, charts and conditional formatting — all reading from the data sheets. Because the datasets are ordinary Excel formulas underneath, everything in Excel’s toolbox works on them.
5. Make the reporting period dynamic. Don’t hard-code the month. Put the reporting period in a single cell and bind your datasets to it, so one change re-points the whole pack. Set B3 to October 2026; change it to November and every dataset re-queries the new period on the next refresh — no editing filters in ten places.
6. Refresh and review. Open the file and hit Refresh. Each dataset has a refresh mode, so you decide how live it is (more on that below). Every figure, pivot and chart updates from the source. There’s no export, no re-keying, and no rebuild — you change the period and review what moved.
Keep everything you already built
The most common worry about “connecting Excel to live data” is that you’ll have to give up the reporting you’ve spent years perfecting. You don’t. Because the data arrives as native Excel formulas, the rest of Excel behaves exactly as it always has:
- PivotTables and Power Pivot refresh against the updated data in place.
- XLOOKUP, INDEX/MATCH, named ranges and dynamic arrays keep resolving — they’re pointing at real cell values.
- Conditional formatting, custom number formats and your layout persist through a refresh; only the numbers change.
- Charts and graphs redraw from the new figures without being rebuilt.
This is the whole point of doing it in real Excel rather than a lookalike: you’re not learning a new reporting tool, you’re removing the manual data step from the one you already use.
A worked example: the monthly P&L pack
Say your pack has three tabs — P&L, balance sheet, and a one-page KPI summary. It splits into a one-time build and a monthly cycle, and the whole point is how short the second one is.
The first time, you set the pack up: create the P&L, balance-sheet and KPI datasets from the semantic layer; land them on their own data tabs; connect a reporting-period cell; build your existing Excel reporting on top — variance columns with XLOOKUP, the period-over-period PivotTable leadership likes, red/green conditional formatting; and save the workbook.
Every month after, you open last month’s file, change the reporting-period cell from September to October, press Refresh, review the variances and exceptions, and distribute. The P&L repopulates, the variance columns recompute, the pivot updates, the KPI cards flip to October’s numbers, and the conditional formatting re-flags the lines that moved. Notice which steps disappear: no export, no clean-up, no re-keying, no reformatting, no rebuilding pivots, no hunting for the right file version. The value isn’t a vaguely estimated “half a day saved” — it’s that specific steps are simply gone.
Put the refresh timestamp somewhere visible while you’re at it. The Add-in provides ASTRATO.LASTUPDATED(), so the executive summary can carry its own provenance:
Reporting period: October 2026
Data last refreshed: 3 Nov 2026, 08:42
Anyone opening the workbook can tell at a glance how current the figures are, instead of assuming “October Pack” means October data.
How fresh does a finance workbook need to be?
“Live” is easy to oversell. A month-end pack doesn’t need every cell constantly querying the warehouse — it needs the figures to be current when you refresh, and stable afterwards. Each dataset has a refresh mode, so you match freshness to the job:
- Month-end pack — refresh on demand. Finance controls when the snapshot changes. You refresh deliberately at close, and the numbers hold steady while the pack is reviewed and circulated.
- Working analysis — refresh when there’s no cached result. Avoids unnecessary querying while you work, and pulls fresh data when there’s nothing cached to show.
- Interactive model — refresh always. When worksheet inputs are meant to re-query — change an assumption and watch the data move — continuous refresh makes sense.
So “live” doesn’t have to mean “constantly changing.” For a controlled finance pack, knowing exactly when the figures were refreshed — which is what LASTUPDATED() shows — often matters more than refreshing them every second.
Numbers that match the board deck
There’s a governance dividend here that matters as much as the workflow saved. Because every dataset is built on the same semantic layer that powers your Astrato dashboards, the “net revenue” in your Excel P&L is the same net revenue on the executive dashboard — one definition, one number, everywhere. Change how a measure is calculated once, in the model, and it updates across every report that uses it, including the pack.
That removes the oldest source of friction in finance reporting: metric-definition drift — the moment when the dashboard’s “net revenue” and the spreadsheet’s “net revenue” turn out to have been calculated differently, and the meeting becomes a debate about which is right. When both start from the same governed measure, that particular disagreement is off the table. Figures can still differ if they’re filtered differently, refreshed at different times, or Excel adds its own calculations on top — but the definition is no longer the variable.
Access follows the person, too. When a connected user refreshes the workbook, the query runs through their own Astrato access — so a regional controller refreshes the pack according to the entities they’re permitted to see, rather than inheriting someone else’s credentials. Figures already cached in the file are a separate matter — which is exactly what makes sharing safe.
Sharing the pack — without sharing your connection
When the pack is done, you email it like any Excel file. Your credentials are never written into it — only the data. That means two kinds of recipient are handled cleanly:
- An executive or reviewer opens the file and reads the figures from your last refresh straight away — no login, no access request, no exposure of your connection. Because the last refresh is cached in the file, the numbers are there even offline; reading the board pack on a plane works fine.
- A finance colleague who needs fresher figures refreshes with their own Astrato connection, according to their own access — your credentials were never in the file for them to inherit.
In both cases the pack can show when its data was last refreshed via LASTUPDATED(), so no one has to guess. The result is a clean hand-off: the analyst refreshes and the workbook caches the approved figures, an executive consumes them as-is, and another authorised analyst can refresh independently — without ever touching the first analyst’s credentials.
Common mistakes when building refreshable Excel reports
A few things worth getting right:
- Keep metric definitions in the model, not the sheet. The temptation is to sum a column in Excel. Resist it — use the governed measure, so the number stays consistent with the dashboards instead of drifting.
- Don’t rebuild what a refresh can update. If you find yourself re-pointing pivots or reapplying formatting each month, something’s being torn down that shouldn’t be — a refreshable setup leaves all of it in place.
- Don’t mix data and presentation on the same tab. Landing a dataset straight into a formatted report tab is what makes refreshes messy. Keep the data on its own sheet and reference it — your layout stays stable no matter how the row count changes.
The point of the middle row is what this whole guide is about: the Add-in is a workbench for the model you actively maintain — not a distribution engine, and not a replacement for Data Apps. Picking the right one keeps each tool doing the job it’s best at.
Frequently asked questions
How do I stop re-exporting data into my monthly Excel report?
Connect the report to live, governed data instead of pasting exports. With the Astrato Excel Add-in, you build the pack once with datasets that pull from your governed model, then press Refresh each month — no export, no re-keying, no rebuild. Power Query with a database connection is a lighter alternative, but you define the metrics and manage governance yourself.
Can I refresh an Excel report from the database automatically?
Yes. The datasets in the report are refreshable — press Refresh (or set a dataset to refresh whenever the sheet recalculates) and the figures update from the source. It’s the same idea as Power Query’s Refresh All, with governed, model-defined numbers instead of raw tables.
Will my PivotTables, formulas and formatting survive a refresh?
Yes. The data arrives as native Excel formulas, so your PivotTables, Power Pivot models, XLOOKUPs, named ranges, dynamic arrays, charts and conditional formatting all keep working. A refresh changes the numbers, not your report.
Will the numbers match our dashboards and board deck?
They start from the same definition — that’s the main reason to do it this way. Datasets are built on the same semantic layer that powers your dashboards, so a line item in the pack uses the same governed measure as the dashboard rather than a re-implementation that can drift. Figures can still differ if you filter differently or add your own Excel calculations on top — but metric-definition drift, the usual cause of a pack and a dashboard disagreeing, is off the table.
Can I still work offline, and share the pack safely?
Yes. The last refresh is cached in the file, so the numbers are there offline. And your connection and credentials are never written into the file — a reviewer opens it and reads your last refresh with no login, then refreshes with their own access if they want live data.
Can I enter budget or forecast numbers and save them back?
Not from Excel today — the Add-in brings governed data into the report and refreshes it. Entering values that get committed and shared back to the source is what Astrato Data Apps handle, as a governed workflow. Writeback from Excel is coming; for now, the pack is for live, refreshable reporting on your actuals.
Where does the data come from — do I need SQL?
No SQL required in Excel. You pick defined measures and dimensions from the semantic layer in the Add-in panel; the platform handles the connection to your warehouse or ERP. Your data team sets that up once.
Next steps
If your team rebuilds the same month-end pack from a fresh export every cycle, the shortest path is to try it on the pack you already have:
- See how it works on the Excel Add-in product page.
- Read the launch story: Introducing the Astrato Excel Add-in.
- New to Astrato? Book a walkthrough and we’ll rebuild one of your reports as a refreshable pack on your own data.
Ready to experience next-gen analytics?
See how Astrato runs natively in your warehouse.