Nash AI – your team's agentic BI assistant
Most AI in BI hands you a chart and hopes it's right.
Nash AI builds your governed semantic model first, then the dashboards on top, so every number traces back to a definition your team owns. In plain language, on your warehouse data.


Days of BI work, done in minutes
Your best people spend their days modelling, reformatting, and fielding "can you just…" dashboard requests from the business. The ticket queue never ends, and the business keeps waiting.
Nash takes that off them. What used to eat days now takes minutes – and your team gets back to the work only they can do.

Nash AI does the tedious 80% of BI work
Nash can build the semantic layer, lay out dashboards, write measures, make bulk edits, and migrate old BI logic, all in plain language.

AI Grounded in Your Semantic Layer
Build a dashboard from a sentence
Tell Nash what you need – "sales by region, with a trend line and a top-10" – and it builds the whole thing on Astrato's pixel-perfect canvas: KPIs, charts, filters, navigation, all on-brand.
You watch it work, step by step. What you get back is a real, editable dashboard, not a screenshot, so you tweak the last 10% and ship.
Talk to your semantic layer
Ask Nash to describe the semantic model and it hands back the tables, joins, measures – and the gaps – in plain English.
Define a new measure by saying what you mean ("active customers bought in the last 90 days") and it lands as a governed, reusable asset. And when a number looks off, ask how any measure is built – Nash shows you, SQL and all.

Change everything on a sheet at once
"Switch the whole thing to euros", "Swap every pie chart for a bar", "Restyle the whole thing"...
The kind of request that used to mean a lost afternoon, Nash does in one pass – and shows its work. Reformatting, relayouting, retiring a dead metric: described once, applied across the sheet. Nothing goes live until you publish it.
Bring your old BI logic with you
Switching BI platforms usually means rewriting years of logic by hand – the part everyone dreads and nobody budgets enough time for.
Paste in the formula and Nash translates it: Qlik Scripts, Power BI DAX, Tableau, SQL, even Excel. You see the original next to its Astrato version, so you can check it before you trust it. Weeks of migration, done in an afternoon.
Help business users self-serve insights
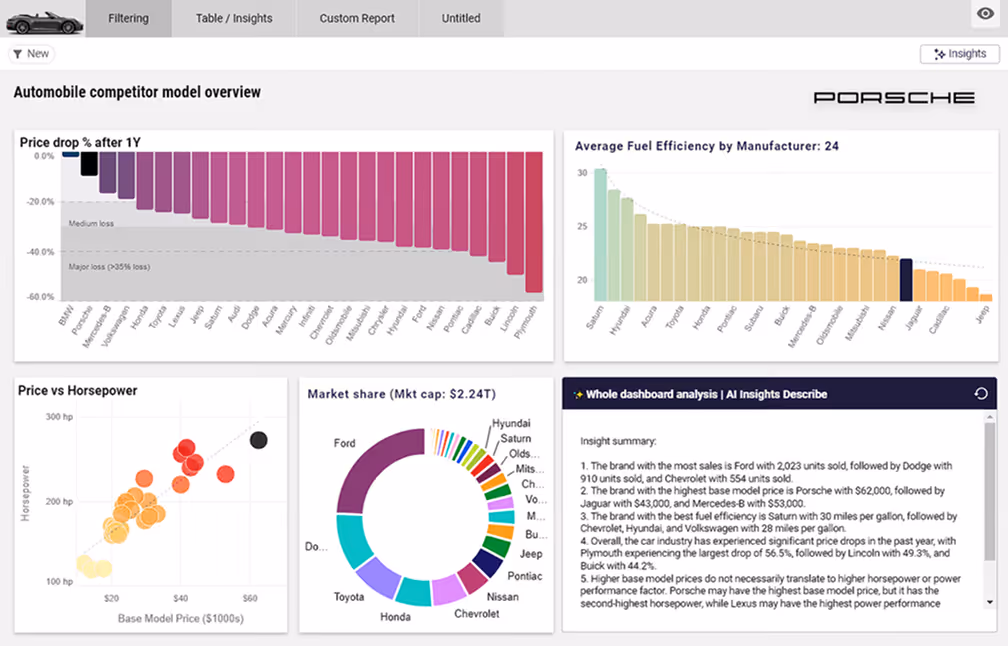
Custom Report is a self-service sandbox where your users explore data on their own – slicing, filtering, and building visualizations from predefined measures and dimensions your team controls. Or they can ask a question in natural language and get a visualization back in seconds. One environment, two ways to explore.
Instant insights on what you're looking at
Not everyone reads a chart the same way, so AI Insights writes the takeaway for them – the trend, the outlier, the driver, in plain English. Change a filter and the summary rewrites itself. Drill into a region and it follows you down. You're always reading what's on screen right now, not what was true the last time someone refreshed the report.
Bring your own LLM
Choose the model that fits your data policy. Astrato supports Snowflake Cortex, OpenAI, Azure OpenAI, Claude by Anthropic, and Google Gemini – or use the default provider included with your Astrato licence.


Your data, your rules
With Snowflake Cortex, queries execute inside your warehouse. Astrato sends the SQL, Cortex processes it, and only the text response comes back. Your data never leaves. With external providers, admins control exactly which AI features are enabled and what data each one can access – feature by feature, toggle by toggle.
Power up your dashboards with trusted AI

Frequently asked questions
If our data model changes, does the AI need to be retrained or reconfigured?
No retraining required. The AI queries your Semantic Layer in real time, so when you add a new metric or rename a dimension, the AI picks up the change immediately. There's no model to retrain, no prompts to rewrite — the semantic layer is the AI's only source of truth.
Is our data sent to OpenAI or a third-party LLM when we use AI features?
No. When you use Snowflake Cortex or your own LLM, queries run inside your secure environment — only the generated text response comes back. Raw data never leaves your warehouse. You can also bring your own LLM provider and API key to keep everything under your control.
Can Astrato connect to the LLM we already use — OpenAI, Gemini, Claude, Cortex?
Yes. Astrato integrates with Snowflake Cortex (which supports Claude, Meta, Mistral, DeepSeek), Google Gemini, OpenAI, and bring-your-own LLMs. You pick the model that fits your governance, cost, and performance needs — we don't lock you into one AI vendor.
How do you stop AI from hallucinating business metrics or making up numbers?
The Semantic Layer does the heavy lifting. Every metric, dimension, and relationship is defined once, so when a user asks “what's our best-performing product?”, the AI queries a governed model instead of guessing. Clear definitions plus warehouse-native execution means answers you can actually trust.
Is AI aware of the filters I've already applied to a dashboard?
Yes. AI Insights are context-aware — they respect the filters, slicers, and selections active on the page. Ask a follow-up question and it picks up where the dashboard left off, instead of starting from scratch.
How is Nash different from other AI in BI?
Most AI in BI works at the surface – it reads your dashboards or raw tables and guesses what your metrics mean. Nash works one layer down: it builds and runs on your governed semantic model, so every answer traces back to a definition your team owns, not one the AI invented.
That's the difference between a chart that looks right and a number you can defend.