Your business doesn't operate in database categories
Raw database categories don't always match how your business operates. Learn how Astrato Grouped Dimensions make reporting categories reusable.

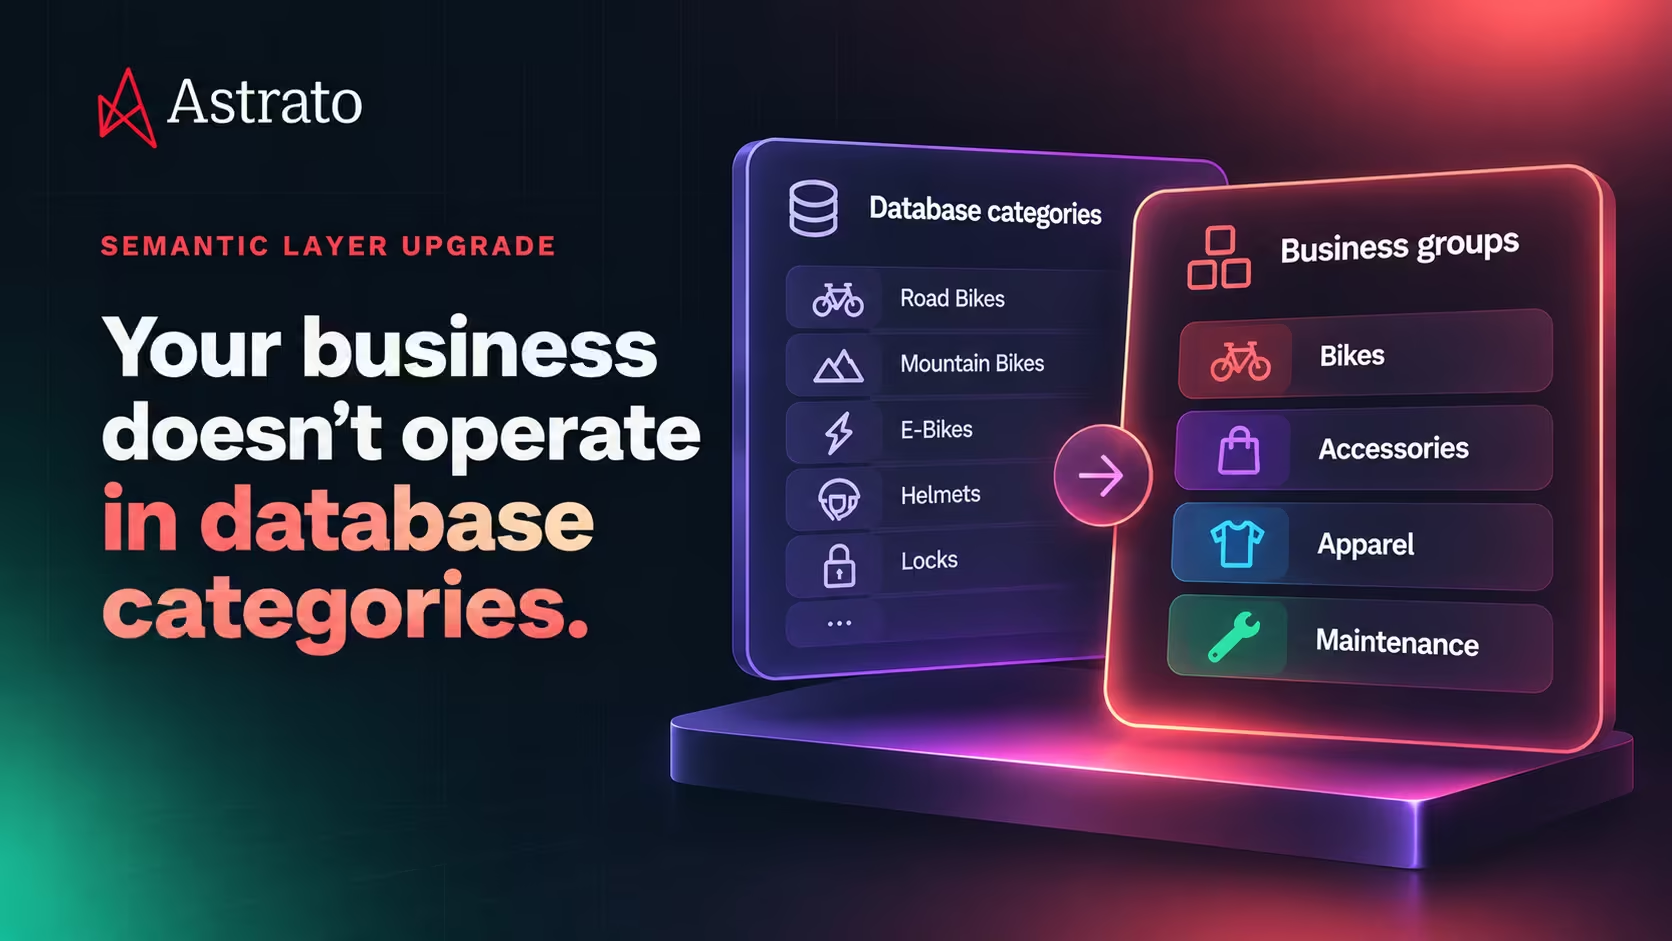
Your business doesn't operate in database categories
Your data warehouse knows exactly which products you've sold.
Road Bikes. Mountain Bikes. E-Bikes. Helmets. Lights. Locks. Cycling Jerseys. Repair Kits.
But your leadership team doesn't necessarily manage the business through those individual categories.
It wants to know how Bikes are performing. Whether Accessories are growing. Which product groups deliver the strongest margins. And whether Maintenance products deserve more investment.
Those questions require a different view of the same data.
The warehouse stores detailed product categories because they're useful for transactions, inventory management and operational reporting. The business needs broader groups because that's how it evaluates performance and makes decisions.
The problem begins when every analyst has to recreate the connection between the two.
One analyst groups categories in SQL. Another builds a calculated field in a dashboard. A third maintains a spreadsheet mapping.
All three are trying to represent the same business structure.
But when those mappings differ, so do the results.
Your data can be accurate while your reports disagree about how the business is organized.
That's why category definitions deserve a place in the semantic layer.
Your warehouse knows your products. Does it know how you manage them?
Consider a bicycle retailer with a growing product portfolio.
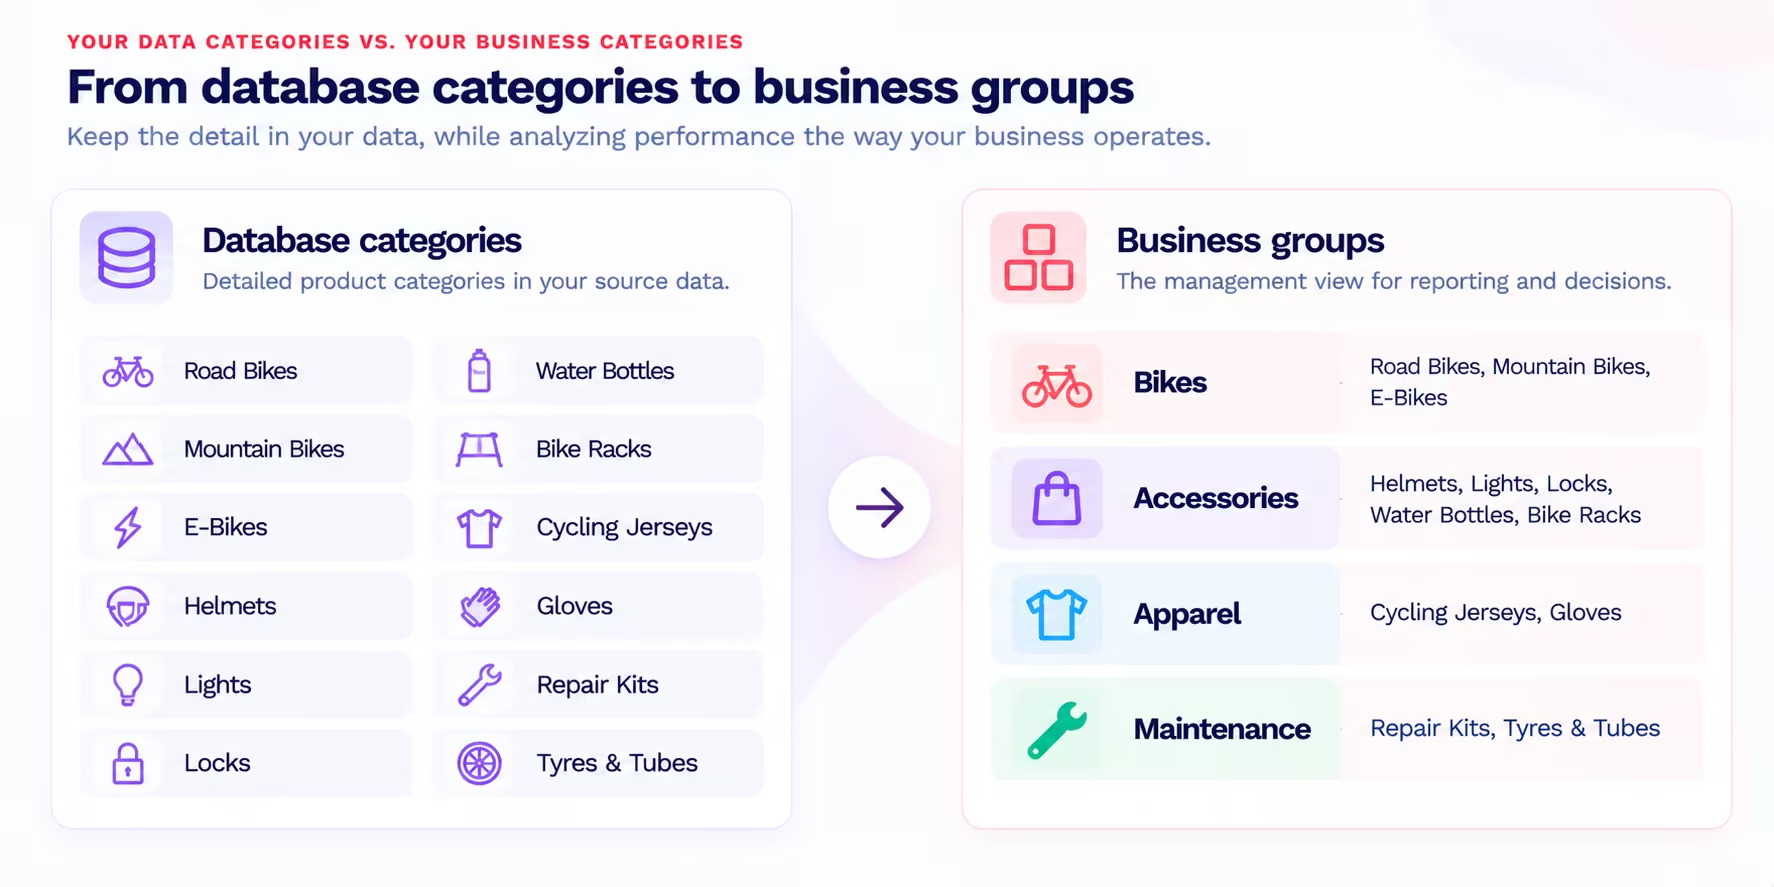
Its source systems contain twelve product categories:
- Road Bikes, Mountain Bikes and E-Bikes
- Helmets, Lights, Locks, Water Bottles and Bike Racks
- Cycling Jerseys and Gloves
- Repair Kits and Tyres & Tubes
These categories are useful. They preserve the detail needed to manage products and understand sales.
But the commercial leadership team reviews performance through four groups:
The grouping reflects how the retailer manages its portfolio.
Bikes represent the core product business. Accessories cover complementary purchases. Apparel has its own commercial performance. Maintenance products support ongoing ownership.
Leadership wants to compare revenue, margins and growth across these four groups.
That sounds straightforward until someone has to build the report.
The warehouse may contain the individual product categories, but not the management groups. So the analyst needs to translate one structure into the other.
And if that translation exists only inside the report, the next analyst may have to build it again.
Why raw dimensions don't always reflect business reality
A dimension describes an attribute of the data.
Product category, customer region, sales channel and business unit are common examples.
But the values stored in those dimensions don't always match the categories used in business reporting.
This isn't necessarily a data quality problem.
Source systems are designed around operational requirements. Management reporting follows a different set of priorities.
Product categories
An e-commerce system may distinguish Road Bikes from Mountain Bikes because the categories matter for product discovery, inventory and merchandising.
A commercial director may want to examine both under a single Bikes group.
Geographic regions
A warehouse may store individual countries.
The business might manage those countries through reporting territories such as Northern Europe, Southern Europe or North America.
Those territories may not correspond exactly to standard geographic classifications.
Customer classifications
A CRM may contain detailed industry codes or customer types.
Sales leadership might organize accounts into broader commercial segments that better reflect its go-to-market structure.
In each case, the source data provides the underlying detail.
The business adds another layer of meaning.
The challenge is making that meaning consistent and reusable.
The hidden cost of rebuilding category mappings
Suppose the bicycle retailer has three reports.
The finance team tracks gross margin by product group.
The sales team monitors revenue by product group.
The commercial director reviews year-over-year growth by product group.
Each report uses the same four group names.
But the mappings were built independently.
Finance includes Bike Racks in Accessories.
Sales places Bike Racks under Bikes.
The commercial director's report doesn't include Bike Racks because the category was introduced after the original mapping was created.
Now imagine leadership reviewing the results.
Revenue for Bikes doesn't reconcile across reports. Accessories appear more profitable in one dashboard than another. The year-over-year comparison may exclude sales that appear elsewhere.
The first assumption might be that something is wrong with the underlying data.
But the source transactions could be perfectly accurate.
The discrepancy comes from the definitions applied during analysis.
And because those definitions are embedded in separate reports, resolving the problem means investigating each implementation.
The business doesn't have three different product portfolios. It has three different interpretations of the same portfolio.
This is where duplicated analytical logic becomes a maintenance problem.
Every time the business introduces a category, changes its reporting structure or reclassifies a product, the mappings may need to be updated in several places.
The more reports depend on independently maintained definitions, the harder it becomes to keep them aligned.
Grouped Dimensions: Turn raw values into reusable business categories
Astrato's upgraded semantic layer introduces Grouped Dimensions, allowing teams to define reusable rules that organize underlying data values into business-relevant categories.
Instead of recreating the same category mapping inside individual reports, the grouping can be retained as a semantic definition.
For our retailer, that means defining the four management groups and the source categories that belong to each.
The result is a business-oriented dimension that can be used in supported analyses.
Analysts can examine revenue, margins or other measures through those groups without independently rebuilding the mapping every time.
The source data remains detailed.
Road Bikes and Mountain Bikes still exist as individual categories in the underlying data.
But the grouped dimension provides another way to analyze that information.
This distinction matters.
Grouped Dimensions don't require the business to replace its source categories with broader labels. They add reusable business context on top of the existing values.
The warehouse can continue supporting operational detail while the semantic layer reflects how the organization wants to analyze performance.
What makes the grouping reusable?
The value isn't simply displaying several categories under one heading.
Most analytics tools provide ways to group values within an individual report.
The difference is where the grouping logic lives.
If the rules exist only in a chart or calculated field, they're tied to that implementation.
If the rules are retained as a reusable semantic definition, supported analyses can build on the same grouping.
That gives the business a more consistent starting point for reporting.
It also makes the grouping easier to inspect and maintain as requirements evolve.
A practical example: Four product groups, three business questions
Let's see what this means for a commercial performance review.
The bicycle retailer wants to evaluate the first six months of the year.
Its leadership team asks three questions:
- Which product groups generate the most revenue?
- Which groups deliver the strongest gross margins?
- Which groups are growing or declining compared with last year?
All three questions use the same four product groups.
But each examines a different measure.
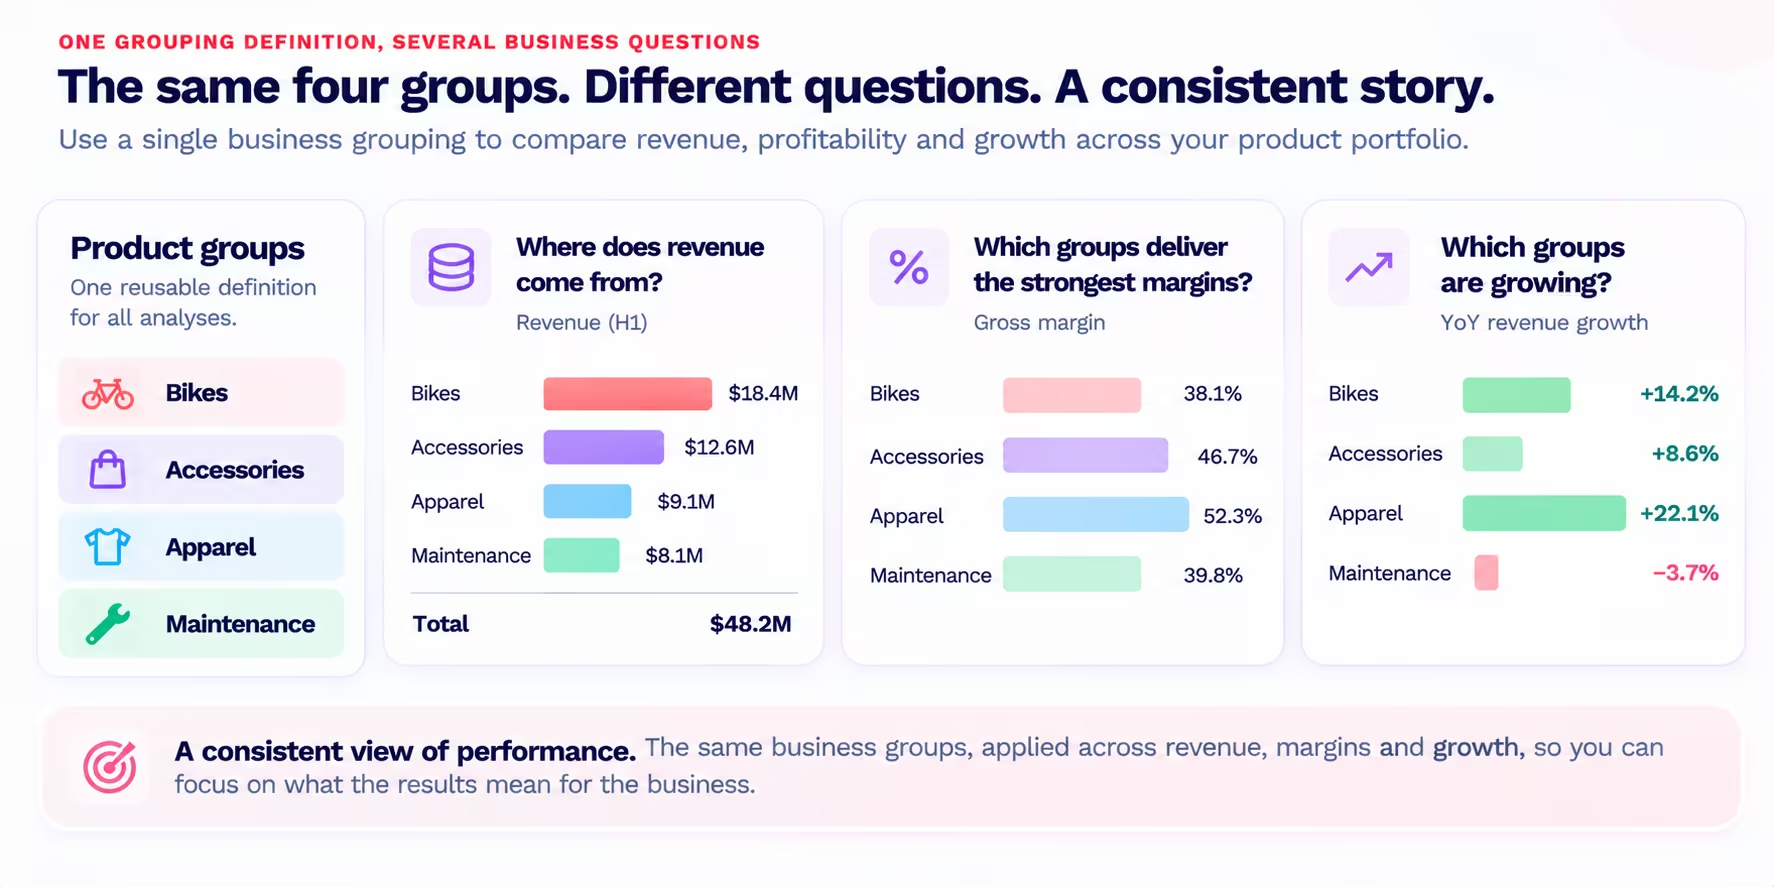
Question 1: Where does revenue come from?
Using illustrative data, the retailer reports:
Bikes generate the largest share of revenue.
Accessories contribute a substantial amount, while Apparel and Maintenance make up the remainder.
That gives leadership a useful view of the revenue mix.
But revenue alone doesn't establish which groups are most profitable.
Question 2: Which groups deliver the strongest margins?
The team examines gross margin using the same grouping definition.
Now the story changes.
Bikes remain the largest revenue contributor, but Apparel has the highest gross margin percentage.
Accessories also deliver a higher margin percentage than Bikes.
That may prompt leadership to investigate the relationship between product mix, sales volume and profitability.
Crucially, the groups haven't changed between the revenue and margin analyses.
The team can focus on interpreting the differences rather than checking whether each report uses a different category mapping.
Question 3: Which groups are growing?
Next, the team examines year-over-year revenue growth.
Product groupYoY revenue growthBikes+14.2%Accessories+8.6%Apparel+22.1%Maintenance−3.7%
Apparel shows the strongest growth rate.
Maintenance is declining.
Those findings may deserve further investigation.
Is Apparel benefiting from a successful product launch? Is Maintenance facing weaker demand, availability problems or a change in customer purchasing behavior?
The grouped dimension doesn't answer those questions by itself.
It gives the business a consistent way to organize the results and identify where to investigate.
Why the shared grouping matters
Notice what remains constant across all three analyses.
The measures change.
The business questions change.
But the definition of Bikes, Accessories, Apparel and Maintenance remains the same.
That allows leadership to compare different aspects of performance using a common understanding of the product portfolio.
The alternative is to trust that every report author has independently implemented the same rules.
A reusable grouping definition makes that assumption less necessary.
What happens when the business changes its categories?
Business categories aren't permanent.
The retailer may introduce a new product line, expand into electric scooters or reorganize its commercial reporting.
A category previously included under Accessories might become part of a new business group.
Or leadership may decide to separate E-Bikes from other Bikes because the category has become strategically important.
These changes create a maintenance challenge.
If grouping rules are scattered across SQL queries, dashboards and spreadsheets, updating the reporting structure requires finding and changing each implementation.
With Grouped Dimensions, the business can maintain the grouping rules as reusable semantic definitions.
That provides a more manageable place to review changes and update the analytical logic.
However, updating a grouping definition is still a business decision.
Changing which categories belong to a group can affect reported performance and historical comparisons.
For example, moving E-Bikes into a separate group changes the composition of Bikes.
A revenue comparison before and after that change may require additional context to remain meaningful.
Reusable definitions make the logic easier to manage. They don't eliminate the need to review the implications of changing it.
The objective is consistency and maintainability, not automatic agreement about every business classification.
How Grouped Dimensions work with other semantic-layer capabilities
Grouped Dimensions address one part of a broader analytical problem.
A business question rarely involves only a measure.
It may also require a specific population, a time comparison and a business-oriented breakdown.
Consider this question:
How is year-over-year revenue changing among customers who bought Bikes but never Accessories, across our product groups?
Answering it involves several analytical decisions.
Set Filters help define the qualifying customer population: customers who purchased Bikes but never Accessories, according to the chosen purchase-history scope.
Time Intelligence provides supported time-based measures and dimensions for comparing performance across reporting periods.
Grouped Dimensions provide the business-defined product categories used to organize the results.
Business Questions retain the supported analytical configuration so the analysis can be revisited.
Each capability serves a different purpose.
Together, they allow more of the logic behind recurring analysis to be retained as reusable definitions.
That is the larger significance of Astrato's semantic layer upgrade.
The semantic layer isn't limited to describing individual measures and dimensions.
It can also retain more of the analytical choices businesses repeatedly make when working with their data.
From consistent categories to business decisions
A commercial director doesn't ask for revenue by product group because they need another chart.
They want to understand where the business is growing, which parts of the portfolio are profitable and where management attention is needed.
A grouped dimension helps translate detailed operational data into categories that support those decisions.
It doesn't replace the underlying detail.
And it doesn't automatically determine what action the business should take.
It provides consistent business context for the analysis.
That becomes increasingly important as organizations expand the ways people interact with data.
An analyst may build a report manually. A business user may explore performance through an AI assistant. A team may revisit a saved Business Question.
In each case, business-defined categories can help ensure that the analysis reflects the organization's intended reporting structure, wherever the supported definitions are available.
Looking ahead, Astrato is developing Data Apps that will bring analytical context into richer, decision-oriented workflows.
Data Apps are not part of the current Grouped Dimensions release.
But applications designed around business decisions will need to understand more than raw warehouse values.
They'll need the categories, populations and comparisons through which the organization interprets its data.
Reusable semantic definitions provide a foundation for that direction.
Your data structure shouldn't dictate how you understand your business
Source systems and data warehouses serve an essential purpose.
They preserve the detailed information businesses need to operate.
But the categories used to store data aren't always the categories used to manage performance.
When analysts repeatedly translate source values into business groups, those translations become part of the analytical work.
And when that work is recreated independently, reports can diverge even when the underlying data is accurate.
Astrato Grouped Dimensions help teams retain business-defined grouping rules in the semantic layer, making them available for supported reuse across different analyses.
That allows organizations to examine revenue, margins, growth and other measures through categories that reflect how they actually manage the business.
Your warehouse should preserve the detail. Your semantic layer should help make that detail meaningful to the business.
Explore Astrato's upgraded semantic layer to see how Grouped Dimensions and other reusable analytical definitions support more consistent business analysis.
Ready to experience next-gen analytics?
See how Astrato runs natively in your warehouse.