Why year-over-year reporting is harder than it should be
Year-over-year reporting can produce misleading results when comparison periods differ. Learn how reusable Time Intelligence supports consistent analysis.

Revenue is up 12% year over year.
That's the headline in Monday's finance review.
But before anyone celebrates, the CFO asks a question:
Compared with which period, exactly?
The same six months last year? The previous full calendar year? The current year to date? Or a rolling twelve-month period?
These aren't interchangeable comparisons. They can produce very different results, even when everyone uses the same underlying revenue data.
And yet, in many businesses, the rules behind time-based reporting are still reconstructed across spreadsheets, dashboards and individual analyses.
One analyst writes a year-over-year calculation. Another builds a year-to-date comparison. A third applies a date filter to a revenue chart.
Each report might look reasonable in isolation.
The problems begin when leadership expects those reports to tell a consistent story.
A revenue number is only as useful as the time period it represents and the comparison used to interpret it.
That's why time intelligence deserves more attention than it usually receives.
Same revenue data. Different reporting windows.
Consider two analysts preparing a midyear revenue review.
Both work with the same warehouse data. Both are asked to explain how the business is performing compared with last year.
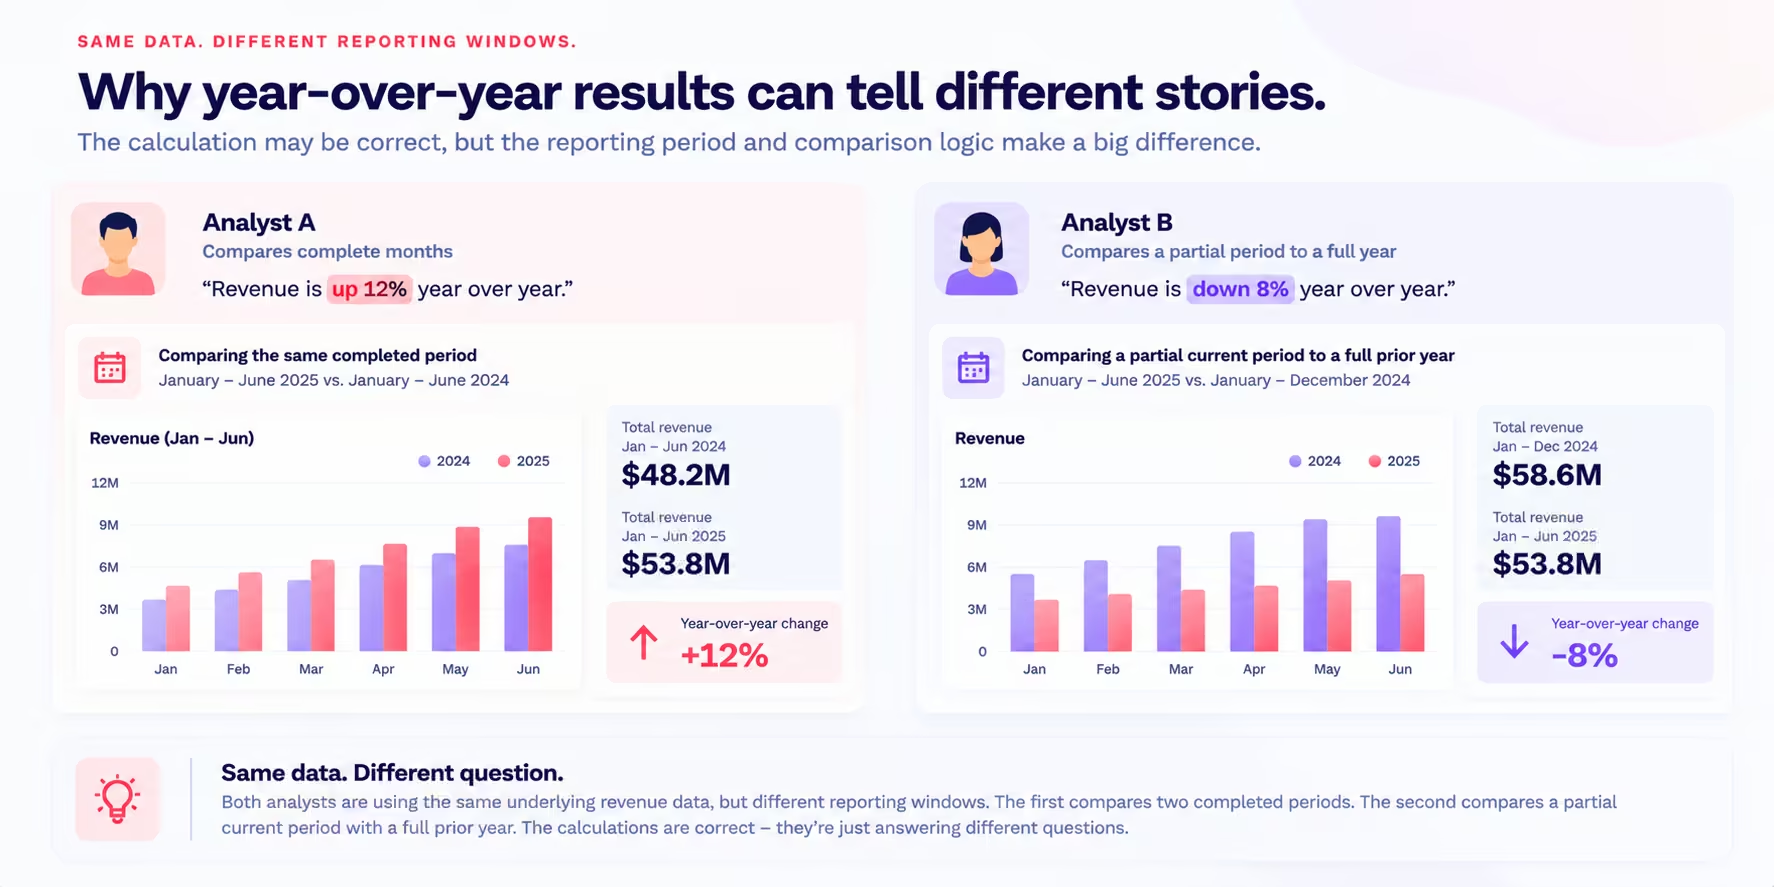
Analyst A compares January through June of the current year with January through June of the previous year.
Analyst B compares January through June of the current year with the entire previous calendar year.
They arrive at different conclusions.
The first comparison measures performance over equivalent six-month periods.
The second compares six months of revenue against twelve months.
The arithmetic in both cases might be correct. But the second calculation doesn't represent a conventional year-over-year comparison.
It answers a different question.
This is an important distinction because reporting problems don't always come from incorrect formulas.
Sometimes the formula calculates exactly what it was told to calculate, but the selected periods don't match the business question.
A simple example
Suppose a company reports the following revenue:
Comparing the first six months of 2026 with the same six months of 2025 gives:
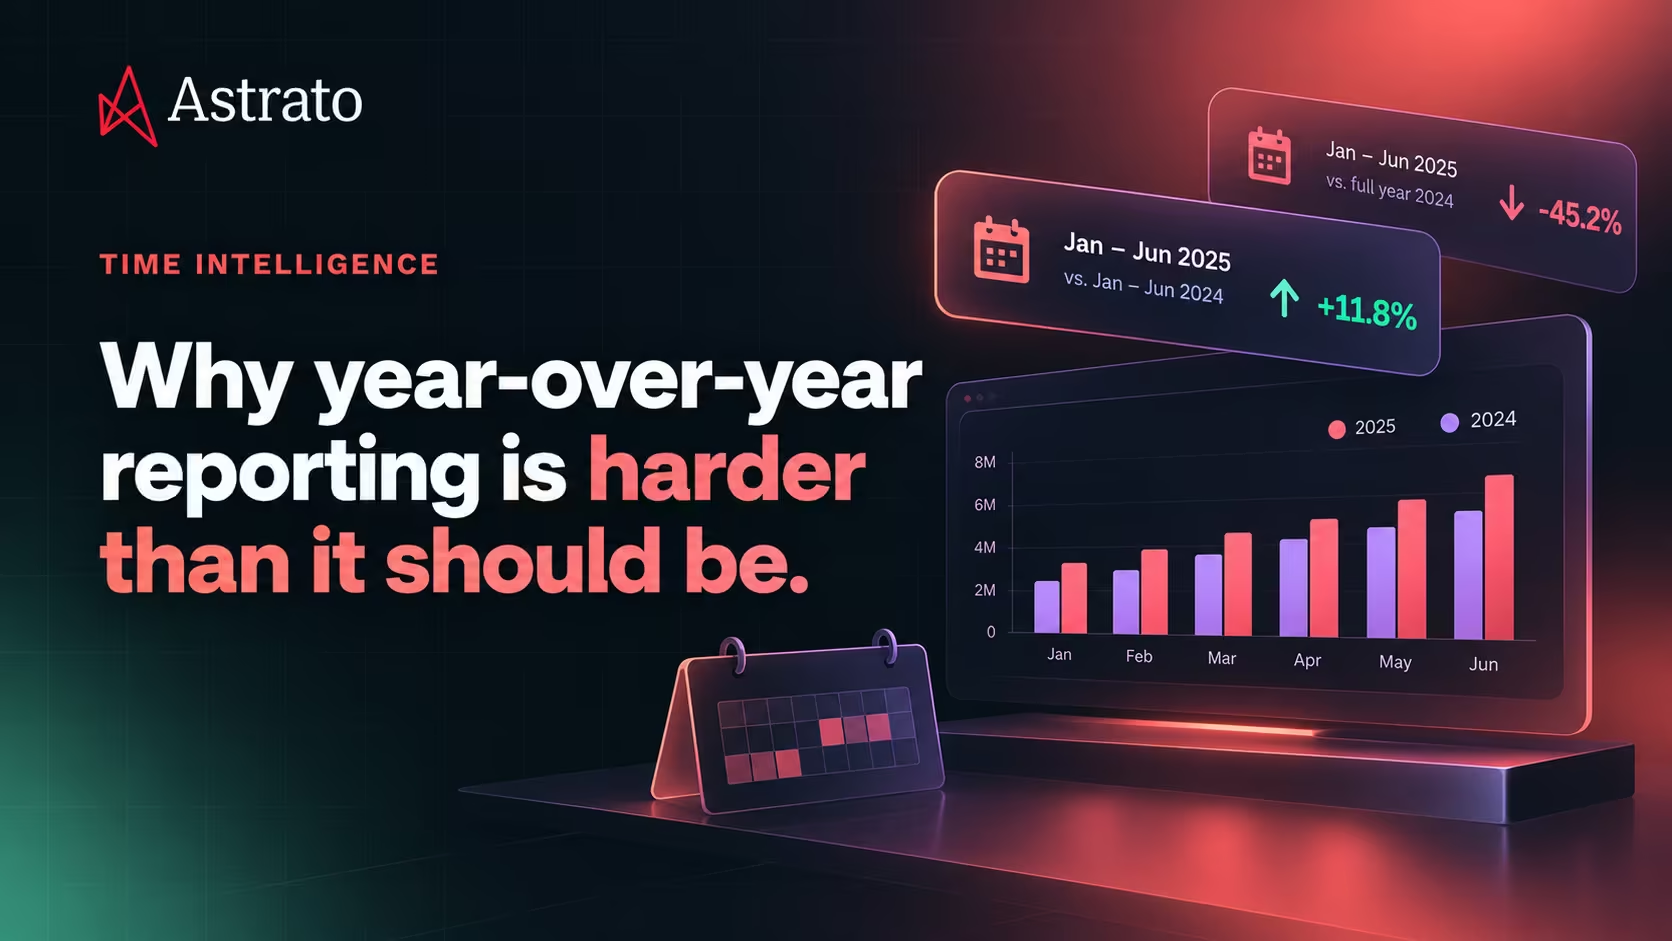
($48.2M − $43.1M) ÷ $43.1M × 100 = 11.8% growth
That's a meaningful year-over-year comparison for the completed six-month period.
But comparing January–June 2026 with the full year of 2025 produces a decline of approximately 45.2%.
That second percentage is mathematically valid as a ratio between the two figures. It is not a like-for-like year-over-year growth rate.
The distinction may seem obvious when the periods are written out.
It becomes much less obvious when a dashboard displays a percentage without clearly showing the comparison logic behind it.
Why time comparisons become complicated
A calendar date looks like a simple attribute.
But business reporting requires decisions about how dates are interpreted, grouped and compared.
Those decisions aren't always obvious from the final chart.
Calendar months versus fiscal periods
Some organizations report according to the calendar year. Others use a fiscal year that begins in a different month.
For a company whose fiscal year starts in April, the first quarter means April through June.
For a calendar-year business, it means January through March.
Both are legitimate reporting structures.
But a report labeled "Q1 revenue" is ambiguous unless the reporting calendar is understood.
Completed periods versus partial periods
Suppose a finance team reviews revenue on October 15.
The current month is only partially complete.
Comparing October 1–15 with the entire previous October can make performance appear weaker simply because the current month hasn't finished.
A like-for-like comparison might instead use October 1–15 in both years, subject to the organization's reporting conventions.
Alternatively, the team may choose to report only completed months.
Neither approach is universally correct. What matters is that the comparison matches the question and is applied consistently.
Year-to-date versus rolling periods
Year-to-date revenue measures performance from the beginning of the reporting year to a selected point.
Rolling twelve-month revenue examines a moving twelve-month window.
Those views serve different purposes.
Year-to-date reporting helps track performance within the current reporting cycle.
Rolling periods can help examine longer-term trends without relying entirely on calendar-year boundaries.
A business may need both, but it shouldn't treat them as equivalent.
Time groupings and comparison logic
Even a straightforward monthly revenue chart involves decisions.
Which date determines the reporting period: order date, invoice date or payment date?
Are transactions grouped by calendar month?
What counts as the previous period?
How is the comparison calculated?
These choices determine the meaning of the result.
The revenue measure is only one part of the analytical definition.
The problem with rebuilding time logic in every report
Now consider a finance team that prepares monthly revenue reviews, quarterly performance reports and annual planning analyses.
The same comparison logic appears repeatedly.
Revenue this month versus the same month last year.
Revenue year to date versus the equivalent period last year.
Monthly revenue trends grouped by reporting period.
If every report implements these calculations independently, the organization has multiple places where the rules can differ.
An analyst may compare the current partial month with a complete prior month.
Another may use a different date field.
A third may define year-to-date using a fiscal calendar while another uses calendar-year boundaries.
The resulting discrepancies aren't necessarily large.
Sometimes they're small enough to go unnoticed until someone compares the reports side by side.
Then the finance team has to investigate which calculation is being used, why the numbers differ and which version should be used in the management review.
This is a familiar analytics problem: the organization may have a shared revenue measure, but not a consistently applied definition of the time comparison.
Sharing the metric doesn't automatically mean sharing the logic used to compare it over time.
And as more people use AI assistants to generate analyses, that distinction becomes even more important.
An AI-generated chart still needs an appropriate reporting period and comparison rule.
Natural-language access makes it easier to request an analysis. It doesn't eliminate the need to define what that analysis means.
Time Intelligence: Make reporting logic reusable
Astrato's upgraded semantic layer introduces additional Time Intelligence measures and dimensions to support reusable reporting windows, time groupings and comparisons.
The idea is to retain supported time-based analytical logic in the semantic layer instead of repeatedly rebuilding it in individual reports.
For example, a finance team may need to compare revenue for a selected reporting period with the equivalent period in the previous year.
That analysis involves more than selecting a revenue measure.
It also requires identifying the relevant reporting window, applying the appropriate comparison and grouping the results at the intended level of detail.
Time Intelligence provides reusable building blocks for supported time-based calculations and dimensions.
This matters because the analytical logic can become part of the shared business context used to construct reports.
Instead of independently defining the same comparison every time, analysts can work with supported time definitions that have already been established.
The goal isn't to eliminate every reporting decision.
Teams still need to choose the right comparison for the business question.
It's to make those choices more explicit and reusable.
Time Intelligence measures and dimensions serve different purposes
A useful distinction is between calculating performance over time and organizing data into time-based groups.
Time Intelligence measures support calculations involving defined reporting windows or comparisons, such as supported year-over-year analysis.
Time Intelligence dimensions support grouping or organizing analysis according to supported time periods.
Together, they help analysts examine performance across time without treating every new chart as an entirely new calculation problem.
The exact windows, groupings and comparison options depend on the capabilities available in the release and the configured semantic model.
A practical example: The monthly finance review
Let's return to our finance team.
Every month, it prepares a management report showing revenue performance.
The report needs to answer three recurring questions:
- How much revenue did we generate during the reporting period?
- How does that compare with the equivalent period last year?
- Which months contributed most to the change?
For an illustrative midyear review, the finance team examines January through June 2026.
The figures are:
The result is straightforward.
Revenue increased by $5.1 million, or approximately 11.8%, compared with the equivalent six-month period in the previous year.
But the percentage is meaningful because the comparison periods are aligned.
Both cover January through June.
Both represent the same number of calendar months.
And both use the same revenue definition.
What happens when the next reporting period arrives?
In July, the finance team may want to extend the review to include another completed month.
The question remains essentially the same: how is revenue performing compared with the equivalent period last year?
The underlying data changes, and the selected reporting window advances.
But the organization shouldn't have to invent a new comparison method every month.
With reusable time definitions, supported reporting logic can be applied again as the analysis moves forward.
That gives finance a more consistent foundation for recurring performance reviews.
From the headline figure to the underlying trend
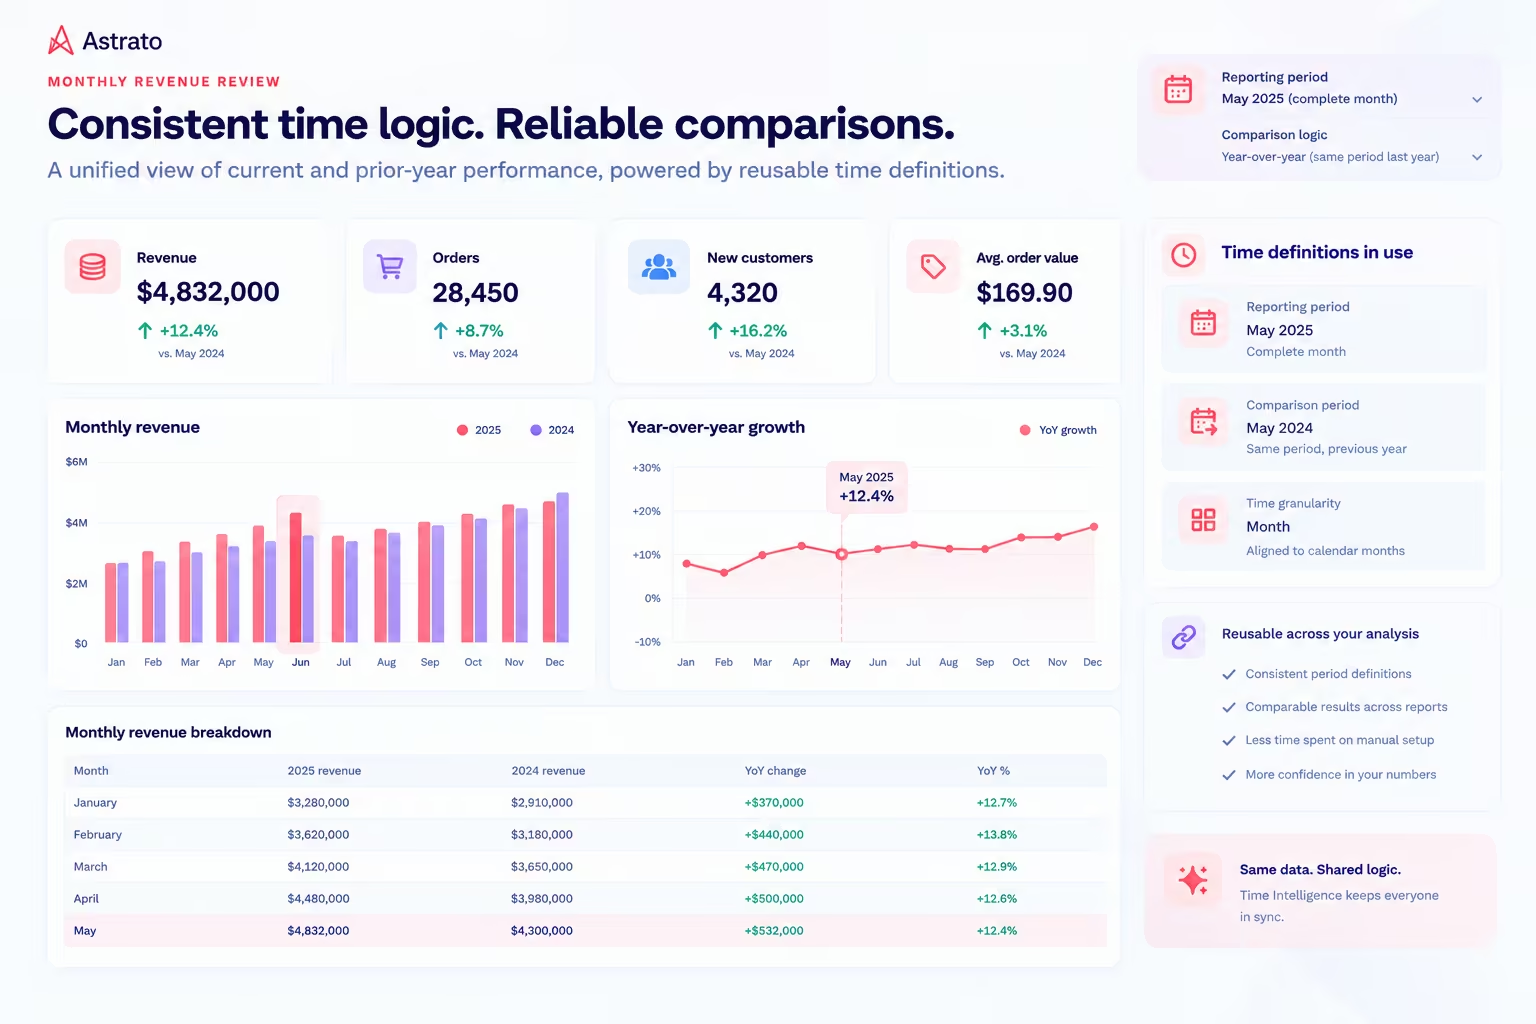
The overall 11.8% increase is a starting point, not the end of the analysis.
The CFO may want to know whether growth was consistent throughout the six months.
Did revenue increase steadily?
Was most of the improvement concentrated in one month?
Did particular markets or product categories contribute disproportionately?
A monthly breakdown helps answer those questions.
But it should use the same reporting conventions as the headline figure.
Otherwise, the team risks explaining one number with a chart based on different time logic.
This is where reusable time groupings and comparisons become valuable.
They help connect the high-level performance figure with the supporting analysis.
One time definition, multiple business questions
Time Intelligence becomes more useful when different teams need to examine performance through related questions.
Consider the following examples.
Finance: How is revenue changing year over year?
Finance needs a consistent comparison between the current reporting period and its prior-year equivalent.
The primary concern is understanding overall financial performance.
RevOps: How has pipeline creation changed over the same periods?
RevOps may want to compare pipeline generated during the current reporting period with the equivalent period last year.
The measure is different from revenue, but the reporting-period logic may be shared.
Sales: Which markets are growing faster than last year?
A sales leader may want to break down year-over-year revenue performance by market.
Again, the business question changes, but the comparison should follow the same defined reporting conventions.
Operations: How is order volume changing month by month?
Operations may focus on monthly order volumes rather than revenue.
Consistent time groupings make it easier to examine trends and relate them to other business measures.
These teams don't necessarily need identical reports.
They need clarity about which time definitions they're using.
A shared semantic layer can help make supported definitions available as reusable analytical building blocks.
That makes it easier to compare related analyses without first reconstructing their time logic.
How Time Intelligence connects to Business Questions
Time Intelligence is one part of a broader shift toward reusable analytical definitions.
In Astrato, Business Questions let teams retain supported analytical configurations, including measures, dimensions, filters and sorting.
Time Intelligence provides supported time-based measures and dimensions that can contribute to those analyses.
For example, a Business Question might ask:
How is revenue changing year over year across our markets?
The analytical definition needs a revenue measure, a market breakdown and an appropriate time comparison.
Instead of treating the time comparison as a one-off calculation, supported Time Intelligence definitions can provide reusable logic for the analysis.
The Business Question can retain the broader analytical configuration.
This is similar to how Set Filters provide reusable definitions of qualifying populations.
Each capability addresses a different analytical decision.
Set Filters help determine which entities qualify.
Time Intelligence helps define how performance is examined over time.
Business Questions help retain the supported analytical setup behind recurring questions.
Together, these capabilities make more of the work behind an analysis reusable.
From monthly reporting to better business decisions
A finance team doesn't compare revenue year over year simply to produce a percentage.
It wants to understand whether performance is improving, where growth is coming from and whether the business needs to respond.
If revenue is rising overall but declining in a particular market, the team may need to investigate further.
If growth is concentrated in a single month, leadership may want to understand whether it reflects a seasonal pattern, a large transaction or a sustained change.
Those decisions depend on having meaningful comparisons.
Reusable time definitions help establish a consistent analytical foundation for the questions that follow.
Looking ahead, Astrato is developing Data Apps to bring analytical context into richer, decision-oriented workflows.
Data Apps are not part of the current Time Intelligence release.
But the connection is important.
Applications built around recurring business decisions need more than isolated metrics. They also need clear definitions of reporting periods, comparisons and the business context behind the numbers.
Reusable Time Intelligence is one of the building blocks for that direction.
Better reporting starts with better-defined comparisons
Year-over-year reporting shouldn't require a debate about what "year over year" means every time a new dashboard appears.
But the challenge isn't solved simply by adding another percentage calculation.
The business needs to understand which periods are being compared, how those periods are defined and whether the same logic is applied across related analyses.
Astrato's upgraded semantic layer helps address that problem with reusable Time Intelligence measures and dimensions.
Combined with Business Questions and other semantic-layer capabilities, they help teams retain more of the analytical logic behind recurring reporting.
The result is a stronger foundation for answering questions that return every month, quarter and year.
Because before the business can decide whether performance is improving, everyone needs to agree on what they're comparing.
Explore Astrato's upgraded semantic layer to see how reusable Time Intelligence and Business Questions support recurring business analysis.
Ready to experience next-gen analytics?
See how Astrato runs natively in your warehouse.