
Live Pipeline & Forecast Reports in Excel for RevOps
Keep your RevOps pipeline and forecast workbook up to date automatically. Bring live, governed CRM and warehouse data into Excel — refreshed, not rebuilt from a weekly export.


Every RevOps team has a workbook — the pipeline, the forecast, attainment by rep, the weekly board number — and every week it gets rebuilt. Export from the CRM, pull a second file for marketing, a third for product usage, stitch them together, reformat, fix the pivots, and send it out before it’s already out of date.
This guide is about ending that ritual: keeping a pipeline and forecast report in Excel up to date automatically, on live, governed data, without exporting and rebuilding it from scratch.
TL;DR
- RevOps lives in spreadsheets for good reason — the flexibility to join sources, shape a bespoke leadership view, and answer a new question fast. That won’t change.
- The problem is the weekly rebuild: recurring operational workbooks go stale between manual exports, and get reassembled from CRM, marketing and product data by hand every cycle.
- The fix is to point the same workbook at live, governed data — with the Astrato Excel Add-in, your revenue data (already consolidated in the warehouse) lands in Excel as native formulas that refresh on demand.
- Metrics like weighted pipeline, attainment and churn are defined once and match the dashboards, so sales, marketing and CS finally align on one number.
- Slice it live: wire a rep, segment or quarter to a cell and it re-queries — no new export.
- Reporting and analysis belong in Excel; changing opportunities or triggering actions belongs in a governed data app.
Why RevOps still runs on spreadsheets
It’s fashionable to say spreadsheets are where RevOps goes wrong. In practice they’re where RevOps gets things done.
A dashboard shows the pipeline; a spreadsheet lets you work it — join CRM opportunities to marketing-sourced leads and product usage, build the weighted-pipeline logic leadership actually asked for, add the commentary column, and shape the exact one-view report that goes to the leadership team every Monday.
That flexibility, across systems and formats, is why the revenue report keeps landing in Excel no matter how many BI tools the company buys.
And RevOps sits at a cross-functional seam — between sales, marketing, customer success and finance — where the question changes constantly and the systems don’t line up neatly.
A spreadsheet is the one place flexible enough to absorb that: join what needs joining, reshape the view for whoever’s asking, and answer a new question before the next meeting. That’s a strength, not a failure of tooling.
So the goal isn’t to move RevOps off spreadsheets. It’s to stop making them rebuild the same one from stale exports every week.
The weekly rebuild, and why it hurts
Here’s the loop most RevOps teams run without thinking about it. Monday morning: export the pipeline from the CRM. Pull a second extract for marketing attribution, maybe a third for product usage or CS health.
Reconcile the columns, stitch them together, reapply the weighted-pipeline formulas, rebuild the pivots and the funnel chart, and format the leadership view.
By the time it’s sent, the CRM has already moved — deals have advanced, new opportunities have landed — so the number in the deck is a snapshot that was stale before the meeting started.
Three things make this expensive:
- It’s manual, and it’s every week. The same skilled reassembly, on a fixed cadence, forever. That’s hours of RevOps time spent on data logistics instead of analysis or enablement.
- The sources sit in silos. CRM, marketing automation, product, finance — each in its own system, joined only in the spreadsheet, from separate exports that were taken at different moments. The stitch is fragile and the definitions drift.
- Everyone brings their own number. Sales quotes one pipeline figure, marketing another, finance a third — because each was exported and calculated slightly differently. Meetings open with reconciliation instead of decisions, and the misalignment is baked into the data.
Signs your RevOps report has outgrown exports
A few patterns say the weekly export has become a liability rather than a routine:
- The same workbook is rebuilt on a fixed cadence — every Monday, every week — from a stack of exports pulled from different systems.
- Sales, marketing and finance quote different pipeline numbers, and alignment meetings open by reconciling them instead of acting.
- The report is stale by the time it’s presented, because the CRM kept moving after the export was taken.
- Metrics like weighted pipeline are recalculated by hand in the sheet, slightly differently each time.
- RevOps spends the first hours of the week on data assembly rather than analysis, enablement, or building the business case for a change.
If those are familiar, the bottleneck isn’t the spreadsheet — it’s the manual export feeding it.
The fix: one governed dataset, refreshed not rebuilt
In a modern revenue stack, the CRM, marketing automation and product data already flow into a cloud data warehouse, joined and modelled. That governed model is the single source of truth the dashboards run on. The missing piece has been getting it into the spreadsheet without an export — and that’s exactly what the Astrato Excel Add-in does.
It brings your governed revenue data into Excel as native formulas and reusable datasets. So the pipeline report you already built points at live, governed data instead of a stack of weekly exports. Four things change:
The workbook refreshes instead of rebuilding. Build the pipeline, forecast and attainment views once, and each week you open the file and press Refresh. Every figure, pivot and funnel chart updates from the warehouse — no export, no stitch, no reassembly.
The sources are already joined. Because the model consolidates CRM, marketing and product upstream, you pull one governed dataset rather than reconciling three exports in the sheet. The silos are resolved before the data reaches Excel.
Metrics are defined once. Weighted pipeline, attainment, churn, sales-cycle length — defined in the model, identical to the dashboard, and the same for everyone who opens the report. There’s no longer a sales number and a marketing number; there’s the number.
You can slice it live. Wire a rep, segment, region or quarter to a worksheet cell, and changing it re-queries the warehouse underneath. “Show me the EMEA enterprise pipeline for Q3” is a cell edit, not a new export.
The RevOps metrics you can define once
Alignment breaks because every operational metric can be computed a dozen slightly different ways — and in a stack of exports, it usually is. Defining them once in the governed model, and pulling them into Excel from there, fixes that at the source. The measures RevOps leans on most:
- Weighted pipeline — pipeline value adjusted by stage probability, calculated one way for everyone.
- Pipeline coverage — pipeline against quota or target, so the coverage ratio is consistent across reps and segments.
- Attainment — bookings or revenue against quota, by rep, team and period.
- Conversion by stage — funnel conversion rates that don’t shift depending on who built the report.
- Sales-cycle length and churn — defined once and tracked the same way every week.
Pull these as governed measures and your report inherits the definitions your dashboards already use. Change how “weighted pipeline” is calculated once, in the model, and every report that uses it — including the spreadsheet — updates with it.
How to build a live RevOps report
The setup is one-time on the data side, then self-serve for the RevOps team:
- Consolidate revenue data in the warehouse. CRM, marketing automation, product usage and finance flow into your cloud warehouse and are modelled — the work your data team likely already does. Astrato connects to that warehouse.
- Build the datasets your report needs. From the Astrato panel, create datasets from governed measures — pipeline by stage, weighted pipeline, attainment by rep, churn — and pull them into the sheet as native tables.
- Wire your filters to cells. Link rep, segment, region and period to worksheet cells so the whole report re-slices from one place.
- Build the leadership view on top. Add the funnel chart, the pivots by segment, the commentary column, the conditional formatting — as normal, because the data underneath is ordinary Excel formulas.
- Refresh each cycle. Open the report, press Refresh, and it re-evaluates against current data. Nothing is rebuilt.
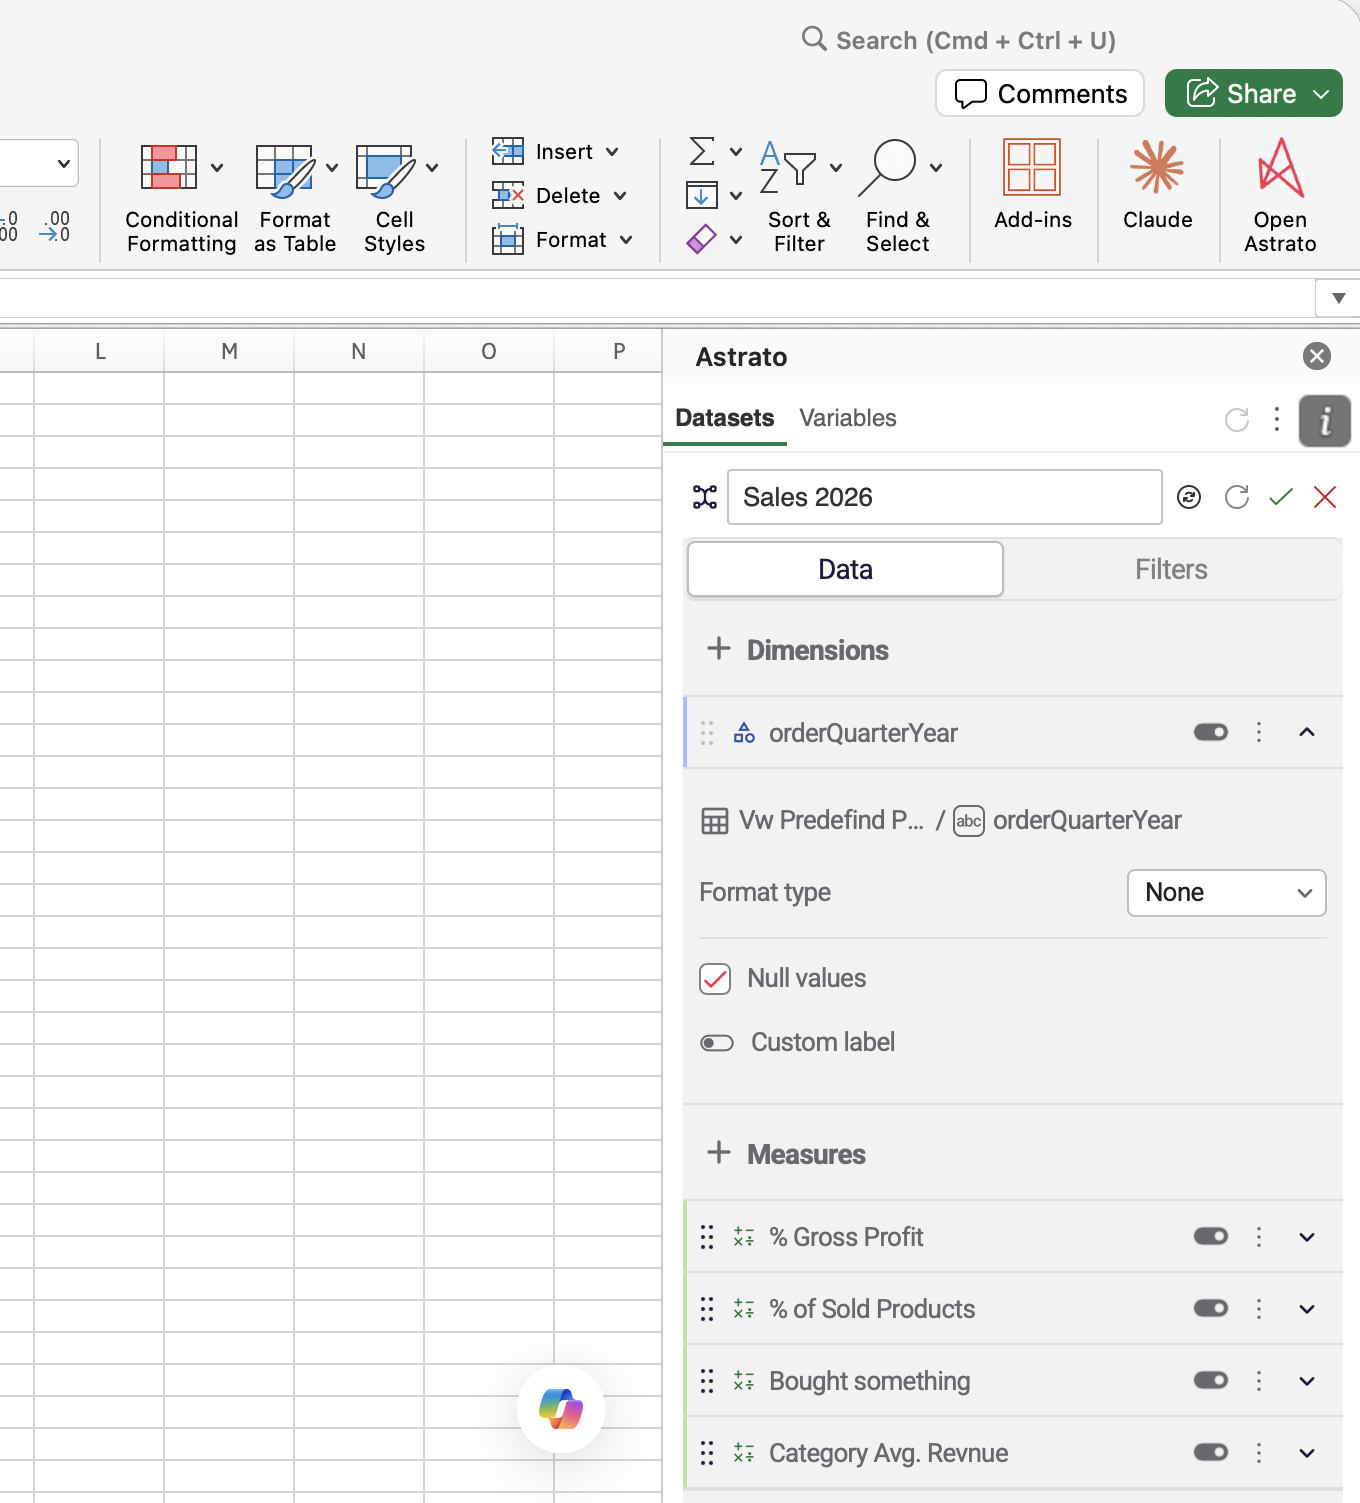
A worked example: the weekly pipeline and forecast workbook
Say your Monday report has a pipeline-by-stage tab, a forecast tab with weighted pipeline against quota, and an attainment-by-rep summary. You build it once on governed datasets and wire three cells: segment, region, and quarter.
Monday comes. You open last week’s file and press Refresh. The pipeline repopulates with this morning’s opportunities, the weighted-pipeline forecast recomputes against quota, and the attainment summary updates by rep.
Leadership asks for enterprise-only in EMEA — you change two cells and the whole report re-queries live, no export in sight. Add a coverage-ratio row against quota and a headcount-adjusted view, and those refresh too — no separate export for the finance-owned targets.
The commentary column and formatting you spent time on are untouched. The report that used to take a chunk of Monday is done in minutes, and it’s measured against live CRM-and-warehouse data, not a stale extract — so the forecast in the meeting is the same one on the dashboard.
Keep the report RevOps already built
None of this asks you to rebuild your reporting in a new tool. Because the data lands as native Excel formulas, the pivots, funnel charts, weighted-pipeline formulas, XLOOKUPs and the leadership-view formatting all keep working. A refresh changes the numbers, not your report. You keep the workbook the team already trusts — it just stops going stale between exports.
One number the whole revenue team trusts
The alignment win is worth calling out on its own. When sales, marketing, customer success and finance all pull from the same governed model, the weighted-pipeline number on the RevOps report is the same number on the CRM dashboard and in the board deck.
That ends the most tedious meeting in the revenue calendar — the one that starts by arguing about whose pipeline figure is right — and lets cross-functional teams spend the time on the actual decision instead. Data-driven only works when everyone’s looking at the same data.
It also changes how RevOps shows up: instead of fielding “why doesn’t your number match mine?” all week, you’re handing sales, marketing and CS a single view they can each open, slice to their own scope, and trust — which is the point of the RevOps role in the first place.
Sharing across the revenue team — safely
When the report is ready, you share it like any Excel file. Your connection and credentials never enter the workbook, so a VP or the leadership team opens it and reads the latest refreshed figures with no login and no exposure of your connection.
Because the last refresh is cached, the numbers are there offline too. And every refresh follows the signed-in user’s permissions, so a regional lead sees their territory and no one else’s — the same access rules your warehouse enforces, applied in the report.
That means one report can go to the whole revenue team without carving out a separate file per region or role.
The boundary: reporting vs operating
Reporting and analysis on live data — the pipeline report, the forecast, the attainment view — is exactly what Excel is for, and this makes it current and trustworthy. But operating on the data is a different job.
Updating an opportunity, reassigning a territory, triggering a follow-up, committing a forecast as the number of record — those are interactive, shared workflows, and they belong in a governed data app where the actions are audited and write back to the source. Use Excel to read and analyse the revenue picture; use a data app to change it.
Common mistakes
- Don’t rebuild what a refresh can update. If every Monday means re-pointing pivots or re-stitching exports, the workbook isn’t set up to refresh — separate the data from the presentation and let it update in place.
- Join upstream, not in the sheet. Reconciling CRM, marketing and product exports in Excel is where drift and errors live. Pull one governed dataset that’s already joined in the model.
- Define metrics once. Let the model own “weighted pipeline” and “attainment” so sales, marketing and finance can’t each compute them differently.
- Wire filters to cells. Drive rep, segment and period from labelled input cells so re-slicing the report is one edit, not a hunt through ten pivots.
- Know the boundary. Reporting lives in Excel; changing opportunities or committing forecasts lives in a governed data app.
Frequently asked questions
How do I keep an Excel pipeline report up to date automatically?
Point it at live, governed data instead of a weekly export. With the Astrato Excel Add-in, the report is built on refreshable datasets — press Refresh (or set a dataset to refresh on recalculation) and the pipeline, forecast and attainment views update from the warehouse. No export, no rebuild.
Can I get live CRM data into an Excel dashboard?
Yes, when your CRM data is consolidated in your cloud warehouse — which is the standard modern setup, with Salesforce or another CRM, marketing automation and product data flowing into Snowflake, BigQuery or Databricks. The Add-in brings that governed, joined data into Excel as refreshable formulas.
Will everyone’s pipeline number finally match?
Yes — that’s the point of running on a governed model. Weighted pipeline, attainment and churn are defined once in the semantic layer, so the RevOps report, the CRM dashboard and the board deck all show the same figure.
Can I slice by rep, segment or quarter without re-exporting?
Yes. Wire those to worksheet cells and changing a cell re-queries the warehouse for the new slice — the report re-evaluates on live data with no new export.
Do my pivots, funnel charts and formulas still work?
Yes. The data arrives as native Excel formulas, so your PivotTables, charts, weighted-pipeline formulas and formatting all keep working. A refresh updates the numbers, not the report.
How is this different from a spreadsheet data connector?
A connector pulls raw CRM or system tables into the sheet, where you still join the sources and define the metrics yourself. This brings governed data — already joined across CRM, marketing and product in the model, with metrics defined once and access enforced per user. It’s a governance layer, not just a pipe from the CRM to a cell.
Can the team update opportunities or commit a forecast from the report?
Not from Excel — the Add-in brings governed data in and refreshes it. Changing records or committing a forecast as the number of record is a governed workflow, which is what a data app is for. Writeback from Excel is on the way.
Next steps
If your team rebuilds the same pipeline and forecast workbook from exports every week, the fix is to give it a live, governed base.
- See how governed data lands in Excel on the Excel Add-in product page.
- For the wider picture, read Live, governed data in Excel.
- Book a walkthrough and we’ll turn one of your weekly reports into a live one on your own data.
Ready to experience next-gen analytics?
See how Astrato runs natively in your warehouse.