From AI Analytics to Data Apps: Turning Answers Into Action
AI analytics can answer questions. Data Apps help turn those answers into business workflows. Explore how Astrato connects live data, business context, and action.

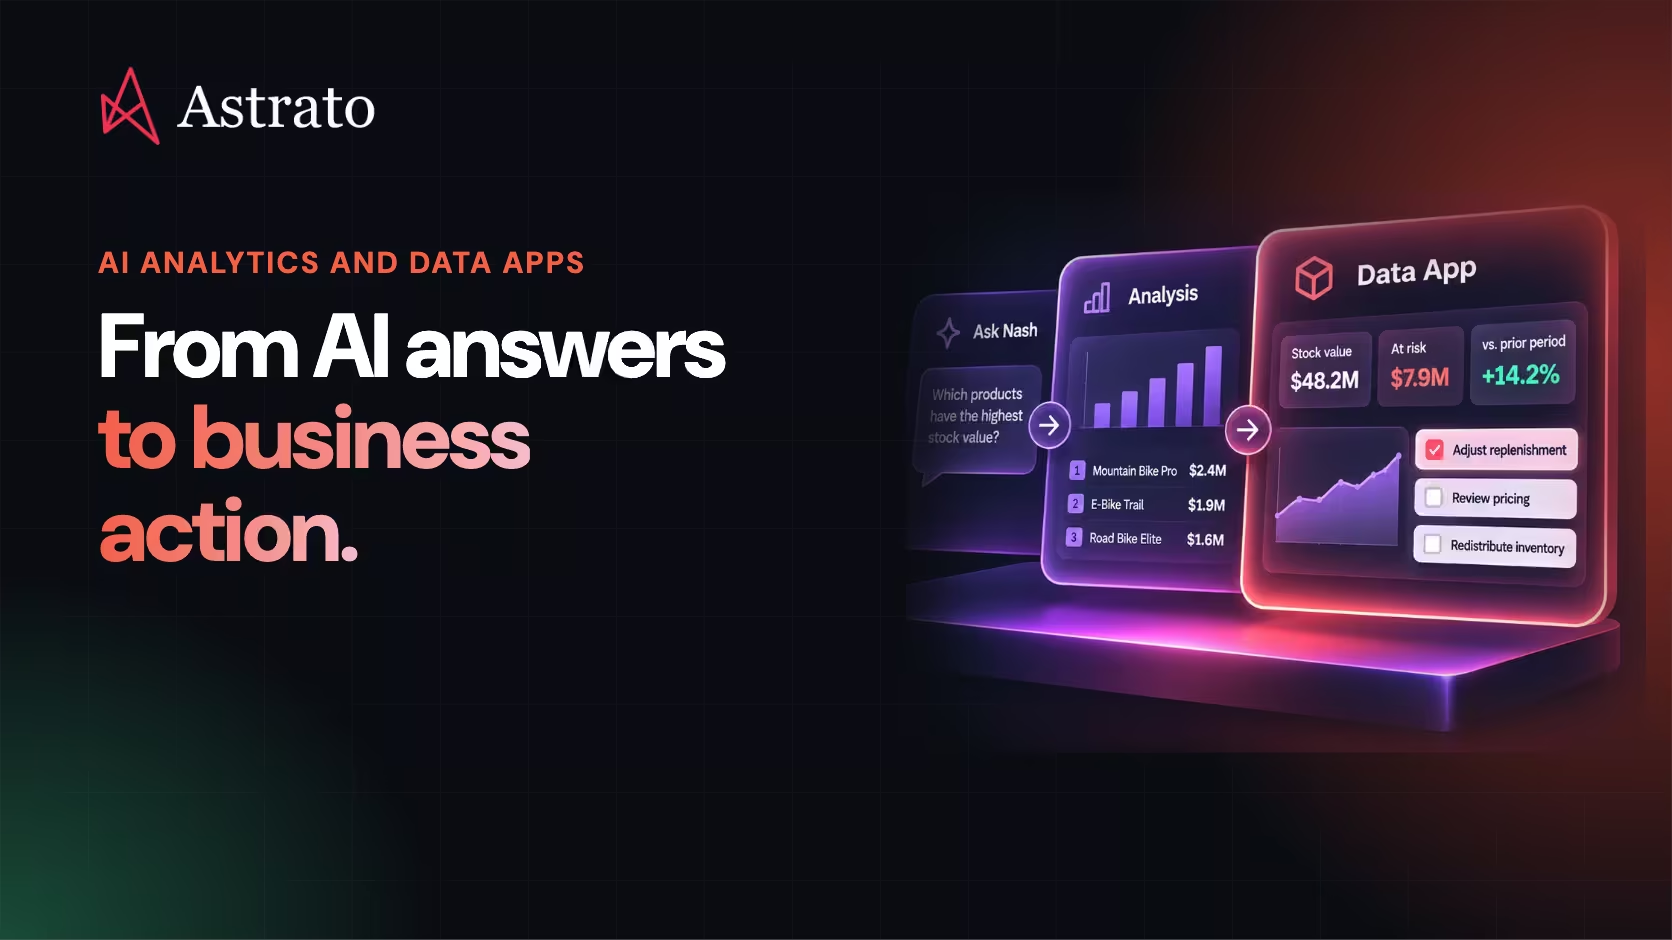
You ask an AI assistant which customers are at risk of churning.
Within seconds, it gives you a list. Maybe a chart, too. You can see which accounts have declining usage, which haven't renewed, and which have stopped buying.
That's useful information.
But what happens next?
Someone needs to investigate those accounts. Decide which ones deserve attention. Assign follow-ups. Track what happens. Then come back next week and do it all again.
The AI answered the question. It didn't create a repeatable way to manage the problem.
And that's where a lot of AI analytics stops today.
Businesses don't just need faster answers. They need a way to turn those answers into repeatable decisions and workflows.
That's the opportunity behind Data Apps: applications built around specific business decisions, combining live data, analytical context, and the tools people need to move forward.
The gap between knowing something and doing something
Consider a sales manager reviewing pipeline performance.
They ask an AI assistant:
Which deals are most likely to miss their expected close date?
The assistant identifies several opportunities with unusual patterns: delayed activity, stalled stages, or close dates that have repeatedly moved.
The manager now knows where to look.
But knowing where to look isn't the same as having a process for dealing with it.
The manager still needs to understand why those deals are at risk, compare them with similar opportunities, decide what intervention makes sense, and coordinate with the account owners.
The same gap appears across departments.
A finance team identifies spending above budget. An operations team spots excess inventory. A customer success manager discovers accounts with declining engagement.
In each case, analytics identifies a situation that requires attention.
But the actual business value depends on what happens afterward.
A report might help someone understand the problem. An AI conversation might help them investigate it.
A Data App can bring that information into a dedicated environment built around the decision itself.
What is a Data App?
A Data App is a business application that combines data, analytical logic, and an interface designed for a particular task or workflow.
Unlike a traditional dashboard, which primarily presents information, a Data App can organize the experience around what someone needs to decide or do.
Take an inventory manager responsible for several warehouses.
A dashboard might display stock value, turnover, and product availability.
An AI assistant might answer:
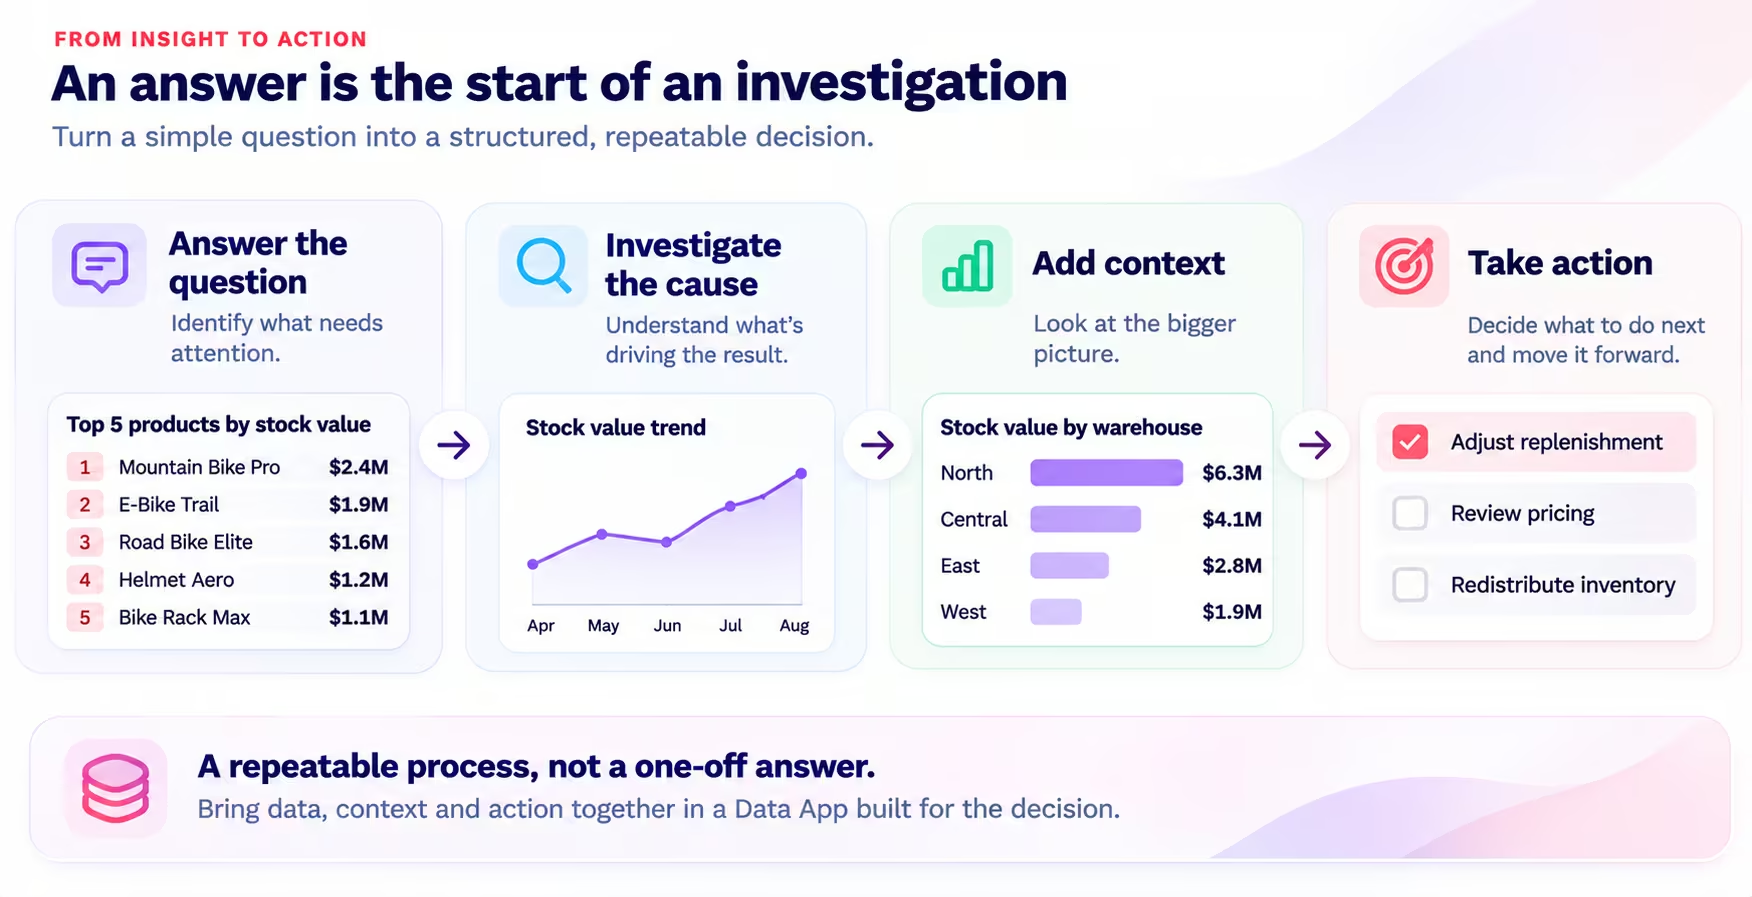
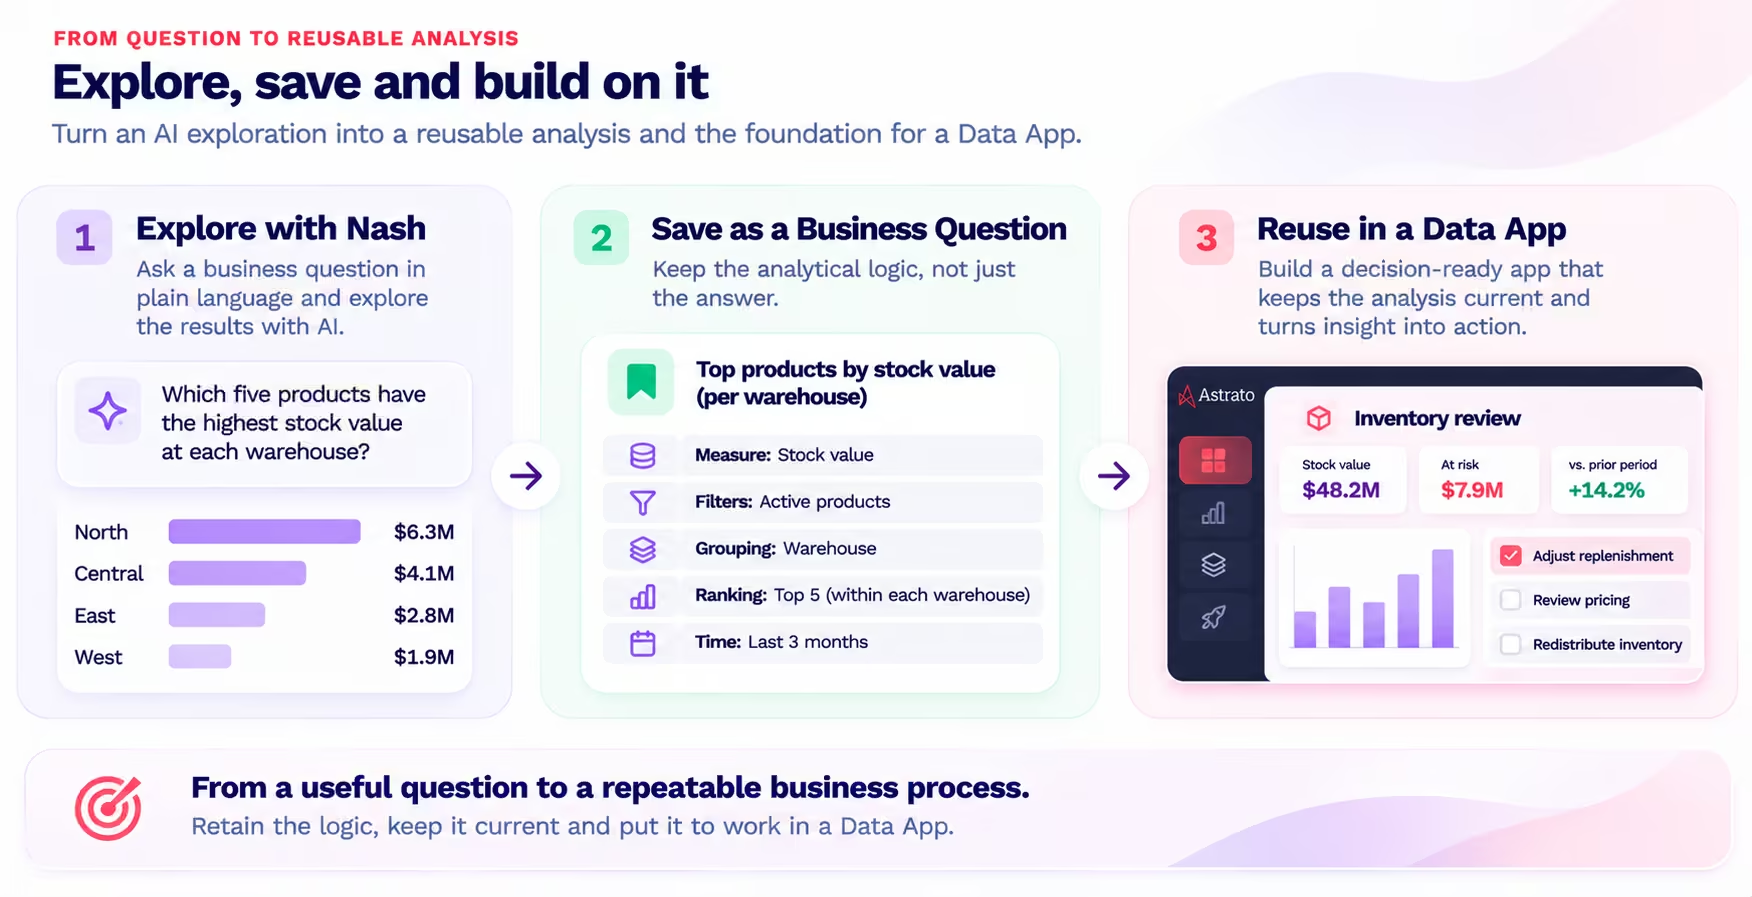
Which five products have the highest stock value at each warehouse?
A Data App could turn that analysis into an inventory review workspace.
The manager could examine the products requiring attention, compare warehouse performance, investigate trends, and work through the next steps in one place.
Depending on the application and its configuration, a Data App can also support operational inputs and workflows, such as entering targets, updating plans, or submitting changes for approval.
The difference isn't simply that the application has more buttons than a dashboard.
It's that the experience is designed around a business process, not just the presentation of data.
And to make that experience useful, the application needs more than access to database tables.
It needs to understand the business.
Why AI-generated applications need business context
Imagine asking AI to build an inventory management application.
You describe what you want:
Build an app that shows the five products with the highest stock value at each warehouse, compares their performance over time, and helps managers review inventory risks.
The request sounds clear.
But several important questions remain.
What exactly counts as stock value? Which warehouses should each manager see? Should the ranking show the top five products across the company or five within each warehouse? How should product categories be grouped? Which reporting periods should be compared?
An AI system can generate an interface without knowing the answers.
The result might look convincing while using assumptions that don't match how the business operates.
This is why connecting AI to company data is only part of the challenge.
The AI also needs access to the definitions and rules that give that data meaning.
That context belongs in a semantic layer.
A semantic layer sits between raw data and the tools people use to analyze it. It defines business concepts such as revenue, margin, customer segments, reporting periods, and other analytical logic.
Instead of requiring every dashboard, AI assistant, or application to interpret raw tables independently, the semantic layer provides a shared foundation.
For AI-built Data Apps, that foundation matters enormously.
It gives the application a better starting point than a collection of database columns and an instruction to figure everything out.
From one useful question to reusable analytical logic
At Astrato, the semantic layer does more than define individual metrics and dimensions.
It can also retain the analytical logic behind recurring business questions.
Suppose our inventory manager regularly asks:
Which five products hold the most stock value at each site?
Answering that question involves several decisions.
The analysis needs a stock value measure. It needs product and warehouse dimensions. It needs to rank products within each site, rather than across all sites combined.
Those choices shouldn't have to be reconstructed every Monday.
With Astrato, users can explore supported questions through Nash, its AI analytics assistant, and save the resulting analytical configuration as a Business Question.
A Business Question preserves the supported measures, dimensions, filters, calculations, sorting, and ranking rules behind the analysis.
It doesn't simply save a screenshot or freeze the answer.
The analytical definition can be evaluated against live warehouse data again as the underlying information changes.
That creates a useful progression:
Ask a question → Refine the analysis → Save the logic → Reuse it.
And it opens up a larger possibility.
If the business can retain the logic behind a useful question, that logic can help inform a more structured analytical experience.
Instead of starting every investigation from scratch, teams can build on definitions they've already established.
The building blocks of a decision-ready Data App
Let's return to the inventory example.
A useful inventory application needs several kinds of analytical logic working together.
It might need to group hundreds of individual product categories into a few management categories.
It might need to compare current performance with previous months.
It might need to identify the highest-value products within each warehouse.
And it might need calculations that reveal trends rather than isolated figures.
Astrato provides capabilities for retaining this context in its semantic layer.
Business Questions: Preserve the analysis
A Business Question captures the configuration behind a recurring analytical question.
For the inventory manager, that could be the stock value analysis broken down by product and warehouse, with the appropriate ranking rules.
The underlying data can change without requiring the question to be defined again.
Custom groups dimensions: Organize data the way the business operates
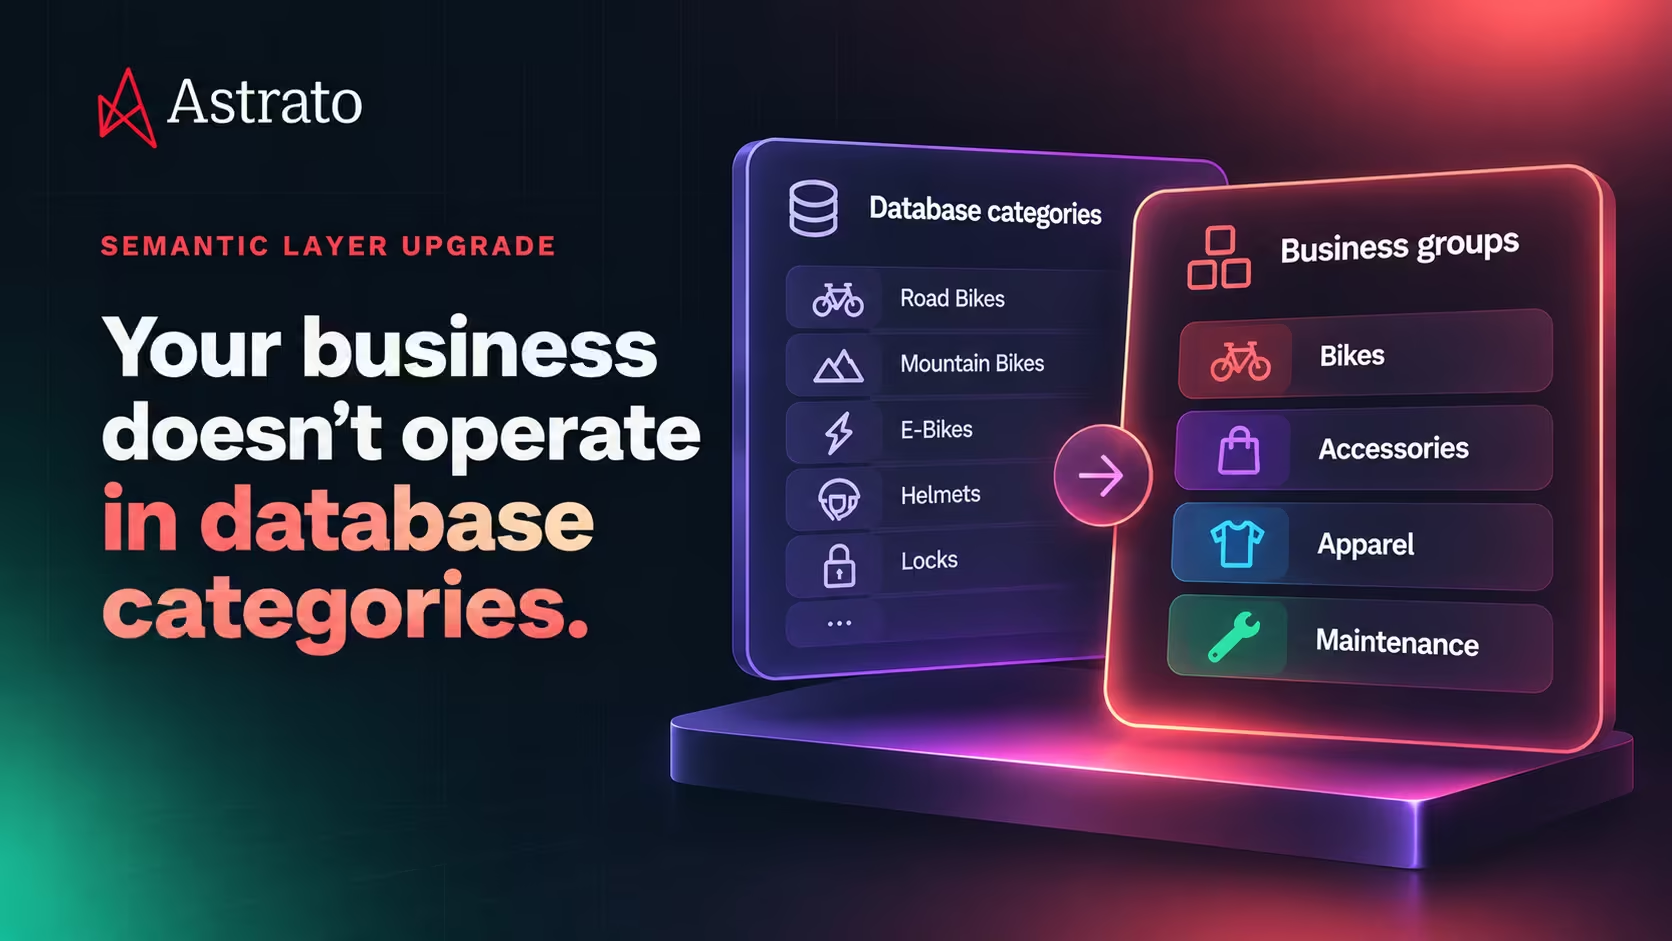
A database might contain dozens of detailed product categories.
Management may work with four broader groups: Bikes, Accessories, Apparel, and Maintenance.
Custom groups dimensions let teams define those business-oriented categories for supported analysis.
That means different analytical views can use the same management groupings instead of rebuilding category mappings independently.
Time Intelligence: Make comparisons consistent
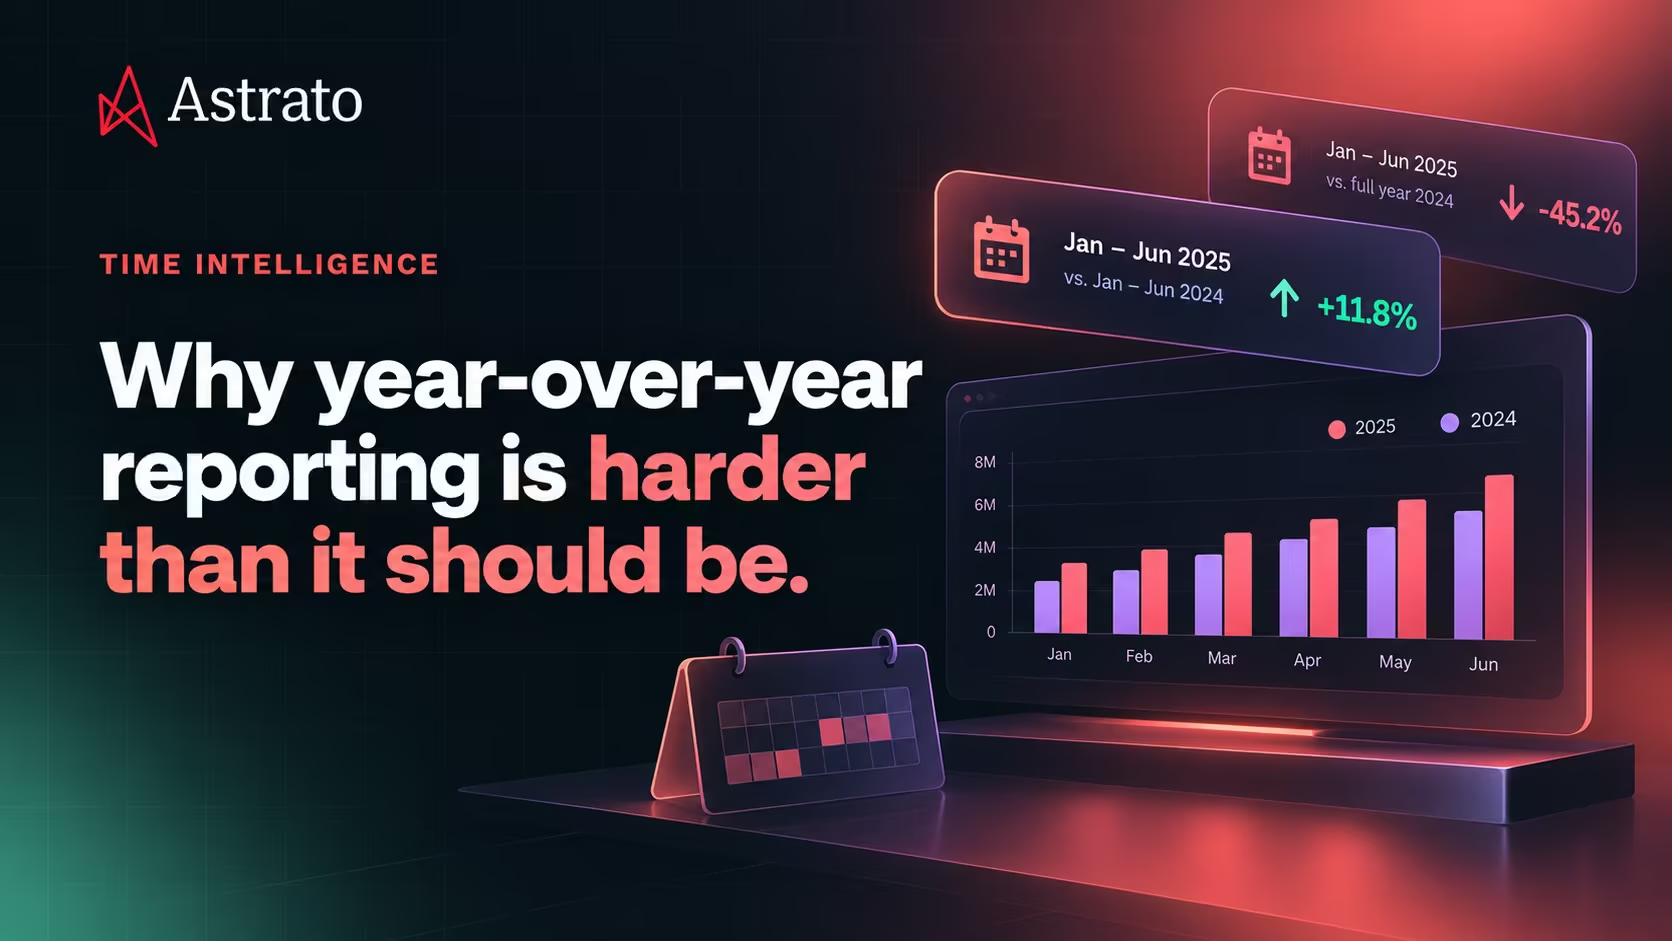
A trend means little if the periods being compared are inconsistent.
Time Intelligence helps teams define supported reporting windows and comparisons, such as year-over-year revenue or monthly performance.
That makes it easier to examine change using consistent time logic.
Advanced Calculations: Go beyond basic metrics
A manager might want a moving average, running total, or comparison against a group total.
Advanced Calculations allow supported analytical operations to be retained within Business Questions.
Instead of treating the calculation as a one-off chart configuration, the analytical question can preserve how its results should be calculated.
Top N Ranking: Focus attention
An application displaying every product in every warehouse could overwhelm the person using it.
Top N Ranking helps identify the highest- or lowest-ranked results according to a selected measure.
For example, the five products with the highest stock value at each site.
The ranking configuration can be retained with the Business Question, so the products may change while the selection logic remains consistent.
Set Filters: Define the population that matters
Not every decision concerns individual rows of data.
A commercial team might want to identify customers who bought Bikes but never Accessories.
That's different from simply filtering transactions to show Bike purchases.
Set Filters support reusable qualifying populations based on relevant conditions and related activity.
That makes them useful for customer analysis, targeting, and other questions where the population itself needs a precise definition.
These capabilities serve different purposes, and not every combination is appropriate for every analysis.
But together they illustrate a larger principle:
The business logic behind an application should be defined deliberately, not rediscovered every time someone builds a new interface.
From a dashboard to an inventory decision workspace
Now imagine the inventory manager has a Data App designed for their weekly review.
Step 1: Identify what needs attention.
The application presents the products with the highest stock value at each warehouse, using the agreed business definitions.
The manager immediately sees which products and locations deserve investigation.
Step 2: Understand the context.
They examine historical trends, compare locations, and review performance by management category.
A high stock value might be normal for a fast-selling product.
It might be a warning sign for a product with declining demand.
The analytical context helps distinguish between the two.
Step 3: Evaluate possible actions.
The manager considers whether to adjust replenishment, review pricing, investigate a supply issue, or redistribute inventory.
Different findings lead to different decisions.
Step 4: Move the process forward.
A decision-oriented application can bring relevant operational inputs and workflows into the same experience, where supported and configured.
Instead of switching between a dashboard, spreadsheet, messaging tool, and separate planning system, the business can design a more connected process.
The application doesn't need to make every decision automatically.
In many cases, the person reviewing the information should remain responsible for the judgment.
The value is in connecting the analysis to the process that follows.
Why live warehouse data changes the equation
There's another important requirement for business applications: the information needs to stay connected to reality.
If an inventory application is built on a static export, its usefulness begins to decline as soon as the source data changes.
New shipments arrive. Orders are fulfilled. Stock is transferred.
The same problem affects sales forecasts, customer health reviews, financial planning, and other recurring processes.
Astrato works directly with cloud data warehouses, allowing supported analytics and applications to query live warehouse data rather than relying on separate copied datasets.
That means the application can use current information from the underlying warehouse when it runs its queries.
It also makes governance important.
Different users may have different permissions. A regional manager shouldn't automatically gain access to every region simply because an AI-generated interface includes a company-wide view.
Astrato's governed data foundation supports applying access controls and business definitions to the analytical experience.
For organizations building Data Apps with AI, these aren't optional details to address after the interface is finished.
They're part of what makes the application suitable for real business use.
The bigger opportunity: Build applications around decisions, not dashboards
For years, business intelligence has largely revolved around reports and dashboards.
Those tools remain valuable.
They help organizations monitor performance, understand trends, and investigate problems.
AI makes it easier to ask questions and generate new analytical views.
But the opportunity goes further than producing reports more quickly.
Consider what happens when someone can describe a business problem and use AI to help shape an application around it.
A sales leader could work toward a pipeline review app.
A finance team could develop a budget review and planning experience.
An operations manager could build an inventory health workspace.
A customer success team could create an account review application.
These aren't simply different dashboards.
They're different business processes, each requiring its own information, analytical rules, decisions, and interactions.
The challenge is ensuring that the applications don't become isolated interpretations of company data.
That's why the semantic foundation matters.
Shared definitions establish what the numbers mean. Reusable analytical logic captures how the business investigates them. Data Apps provide a way to bring that context into experiences designed around specific decisions.
And AI can make the process of creating and refining those experiences more accessible.
The next chapter of AI analytics is about what happens after the answer
The question "Which products have the highest stock value?" will come up again next Monday.
The data will be different.
The business definitions shouldn't need to be reinvented.
And the manager shouldn't have to rebuild the entire process of investigating the result.
That's the shift from one-off AI answers toward reusable analytics and Data Apps.
With Astrato, businesses can connect live warehouse data, define shared business context, explore questions through Nash, and retain supported analytical logic in the semantic layer.
That foundation supports a broader vision: using AI to create business applications that help people investigate problems, evaluate options, and move work forward.
The goal isn't to replace every dashboard or automate every decision.
It's to make analytics more useful at the moment someone needs to act.
Because the most important question in business analytics isn't just "What does the data say?"
It's "What are we going to do about it?"
Explore Astrato to see how governed analytics, reusable business logic, and AI-powered Data Apps can bring data closer to everyday business decisions.
Ready to experience next-gen analytics?
See how Astrato runs natively in your warehouse.