Revenue Operations Data Apps: Turn RevOps Data Into Action
Revenue operations data apps turn scattered RevOps data into governed, real-time action — not just dashboards. What they are, with examples and how to start.

Revenue operations runs on data scattered across the CRM, billing, customer success, and marketing — and most of it ends up in a dashboard that shows the problem but can’t fix it. Revenue operations data apps close that gap. This guide covers what RevOps is, why its data is the bottleneck, and how teams turn revenue data into action with governed data apps on the warehouse.
A revenue operations team lives between systems. Pipeline sits in the CRM, usage in the product database, renewals in billing, leads in the marketing stack, and customer health in a success tool. The whole job of RevOps is to make those pieces add up to one predictable revenue engine — and the whole frustration of RevOps is that the data never sits still long enough to do it cleanly.
So teams build a dashboard. It shows the pipeline, the forecast, the churn risk — beautifully. And then someone has to actually act: reassign an account, flag an at-risk renewal, correct a bad record, adjust a forecast assumption.
None of that happens in the dashboard, so it happens back in the CRM and a spreadsheet. Revenue operations data apps exist to close that last gap — to turn the view into a workflow.
This guide explains what they are, with real examples, and where they fit alongside the rest of your revenue tech stack.
TL;DR
Revenue operations (RevOps) aligns sales, marketing, and customer success around one revenue process — and depends entirely on unified, trustworthy revenue data.
The bottleneck is rarely strategy; it’s data — siloed across systems, inconsistently defined, and entered by hand, so the numbers can’t be trusted or acted on.
A revenue operations data app is a governed app built on your revenue data where it already lives (the warehouse) that lets teams not just see the numbers but act on them — update records, model scenarios, write changes back — in real time.
What is revenue operations (RevOps)?
Revenue operations, or RevOps, is the function that aligns the teams responsible for revenue — sales, marketing, and customer success — around a single, shared view of the revenue lifecycle.
Instead of three departments optimizing their own slice, RevOps treats the entire revenue engine as one process, from first touch through renewal and expansion, and runs it on shared data and shared definitions.
The promise is predictable revenue: when the revenue operations team can see the whole revenue cycle in one place, it can spot where deals stall, where revenue leaks, and where to intervene. The reason it’s hard is that “one place” rarely exists. The data that describes the entire revenue lifecycle is spread across a tech stack that was never designed to agree with itself.
The real RevOps bottleneck is data, not strategy
Most revenue operations problems look like strategy problems and are really data problems. The usual culprits:
- Data silos. CRM data, product usage, billing, and customer success data each live in their own system, so no one has a unified view of the entire revenue cycle without stitching exports together.
- Poor data hygiene. Duplicate accounts, stale fields, and inconsistent stages mean the pipeline number nobody fully trusts — and a forecast built on shaky inputs.
- Manual data entry. Reps and ops update records by hand across tools, which is slow, error-prone, and the single biggest source of the bad data that poisons everything downstream.
- No shared definitions. “Qualified,” “churn,” “ARR” mean different things in different tools, so the same metric reads differently depending on who pulls it.
- Weak governance. Without clear data governance, there’s no single trusted source and no audit of who changed what — a real risk as revenue data feeds board reporting and revenue recognition.
Where data apps fit in the revenue tech stack
RevOps already runs on a stack of revenue operations software, and a revenue operations data app doesn’t replace it — it sits on top of the data that stack produces. It helps to separate two layers.
The first is the system-of-action layer: the CRM (such as Salesforce), revenue-intelligence tools (such as the Gong revenue AI platform), and revenue platforms (such as Salesforce Revenue Cloud) that run the day-to-day motion — logging calls, managing opportunities, capturing activity data. These are where revenue work happens, and a data app is not a substitute for them.
The second is the analytics-and-action layer on your unified revenue data. The data from all those tools typically lands in a data warehouse, where it can finally be joined into one picture. A revenue operations data app is built right there — on the warehouse, on the combined revenue data — so it can do what no single source tool can: analyze across the entire revenue engine and let the team act on what they find. It’s complementary to the revenue stack, not competitive with it: the tools run the motion; the data app governs and operationalizes the data they generate.
What is a revenue operations data app?
A revenue operations data app is a governed application built on your revenue data in the warehouse that lets revenue teams both analyze and act in one place.
The distinction from a dashboard is the whole point: a dashboard is read-only — it shows the pipeline, the forecast, the churn risk.
A data app adds the verbs. You can update a record, model a scenario, reassign an account, or correct bad data, and the change is written back to the warehouse under governance. (That difference between seeing and doing is the entire idea of a data app, and the line between a dashboard and a data app.)
Because it’s built on the warehouse, a revenue operations data app works on live, unified data rather than a stale export, applies one shared definition of every metric, and inherits real governance. That’s what turns scattered, untrusted revenue data into something a team can actually run the revenue process on.
Revenue operations data app examples
The clearest way to understand the category is to see it. Each of these is a live, explorable example of the kind of revenue data app a RevOps team can build — no customer logos here, just working apps you can open:
CRM sales performance
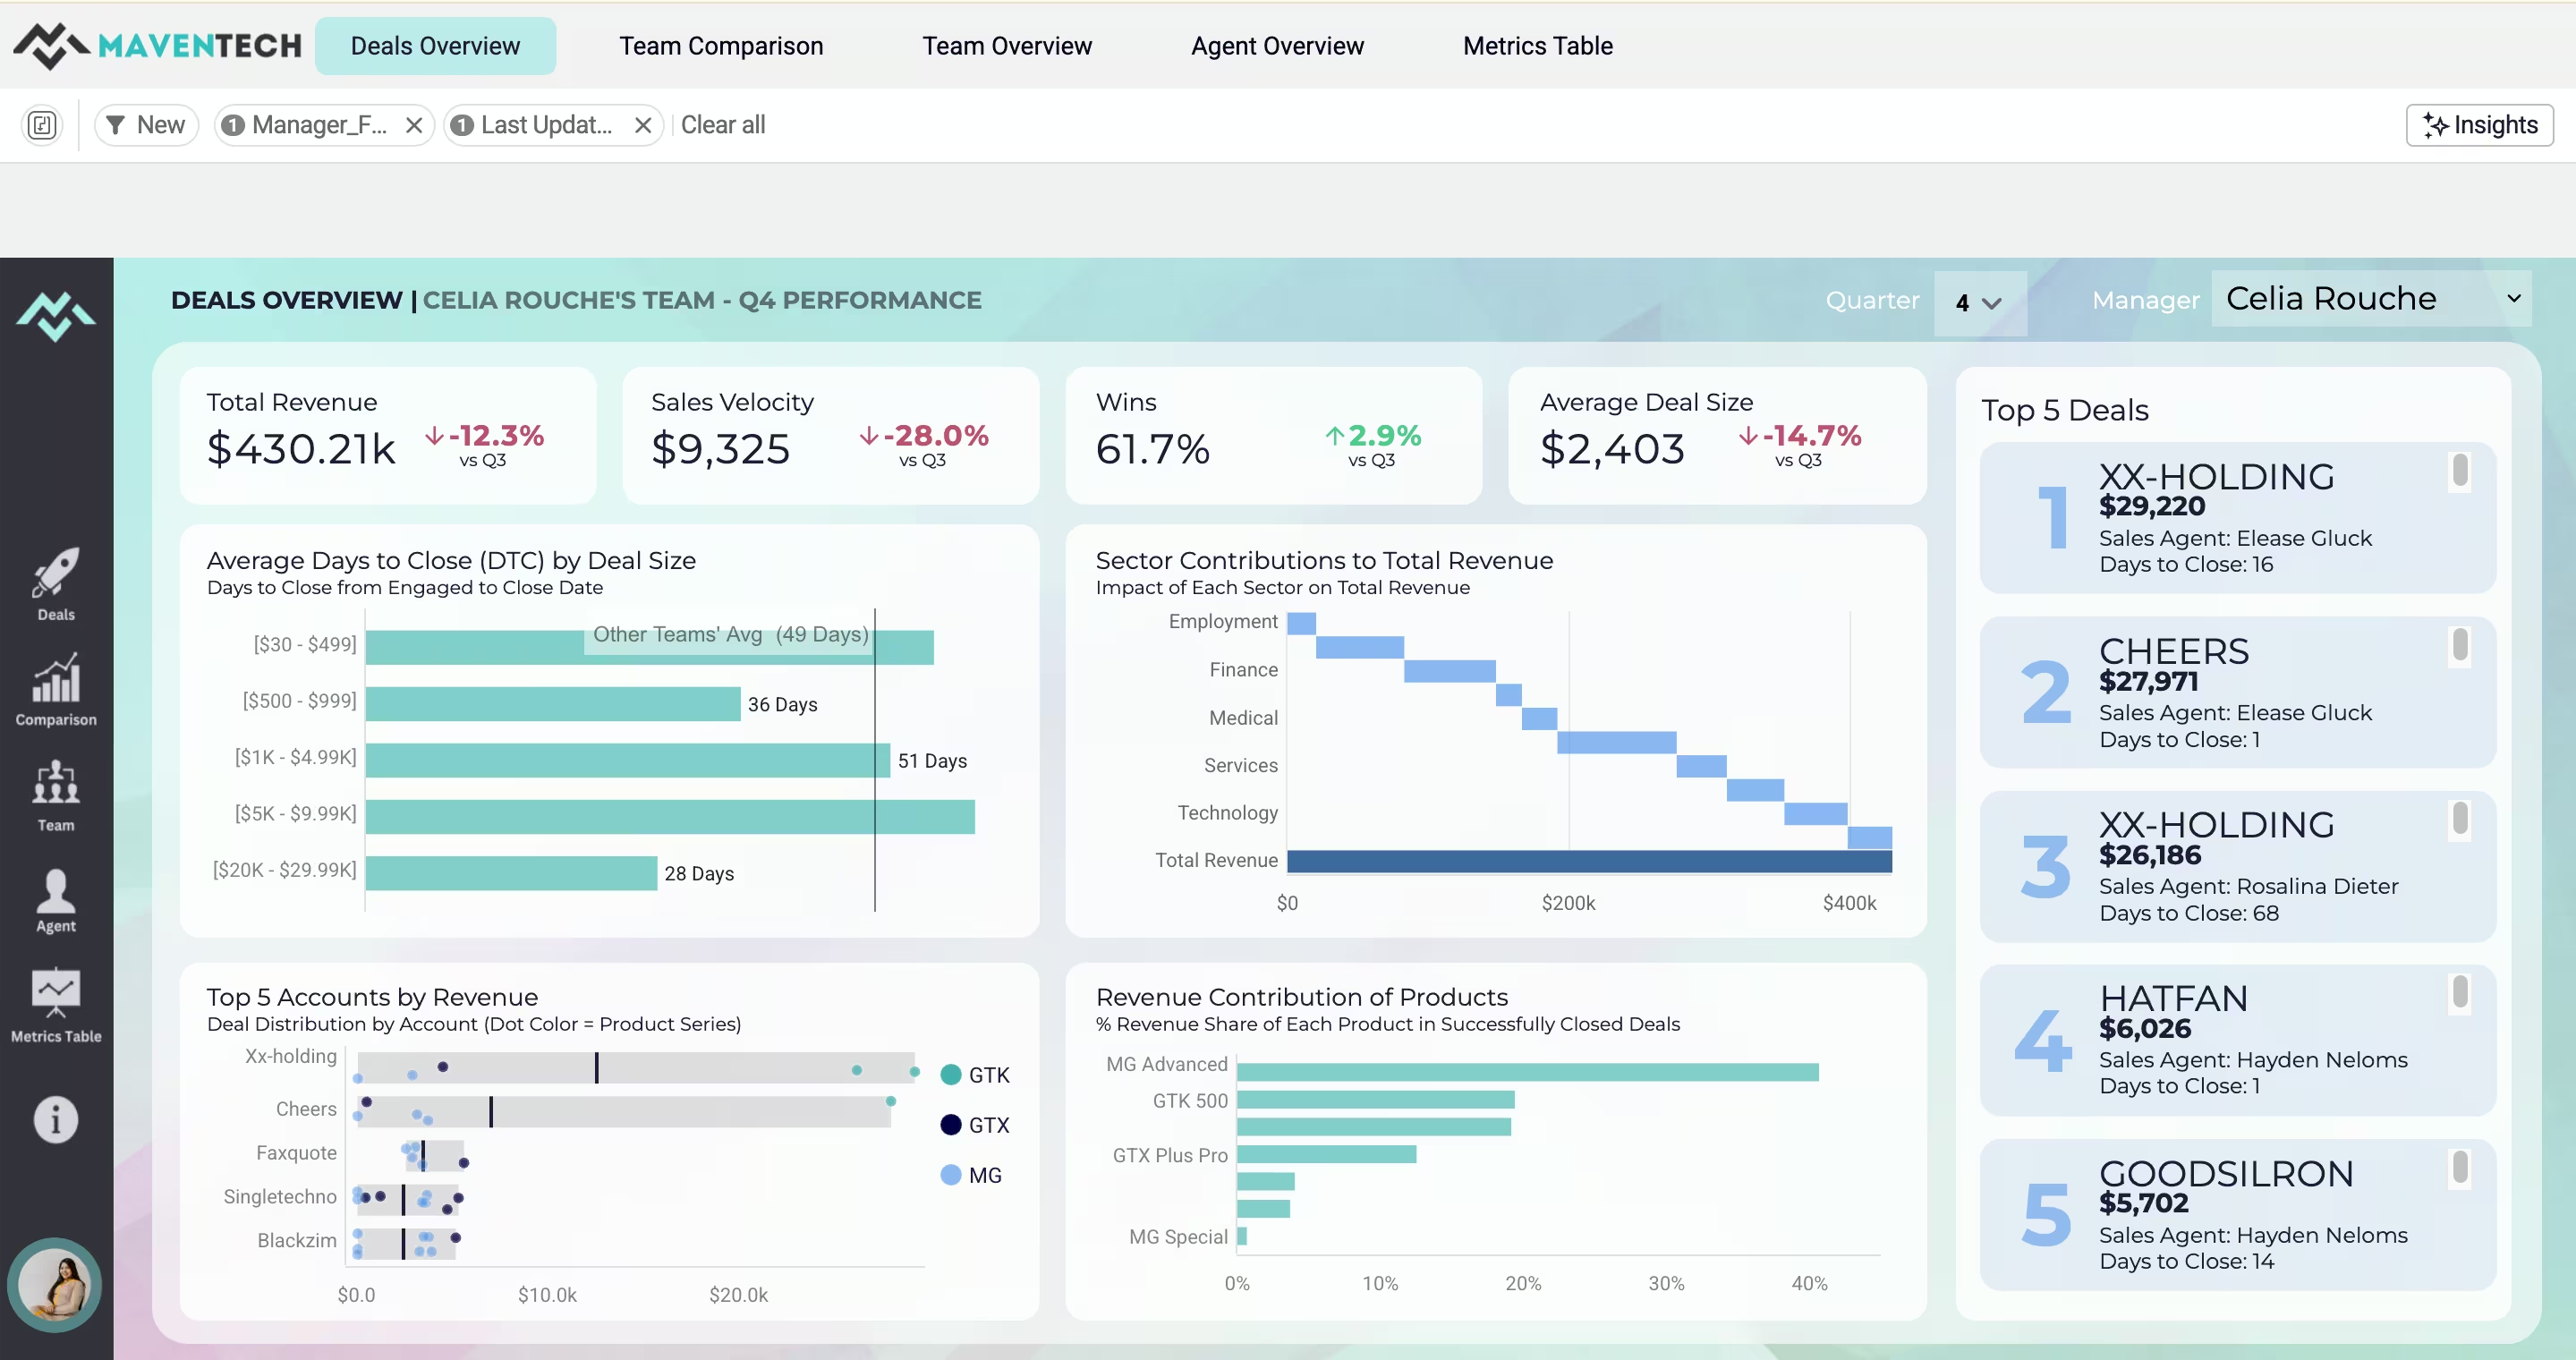
A CRM sales-performance app turns raw CRM data into a self-service view of deal sizes, top accounts, revenue share, and sales team performance — the pipeline picture RevOps needs, on live data instead of a Monday-morning export. (See the Maventech CRM Sales Performance demo.)
Churn risk and retention
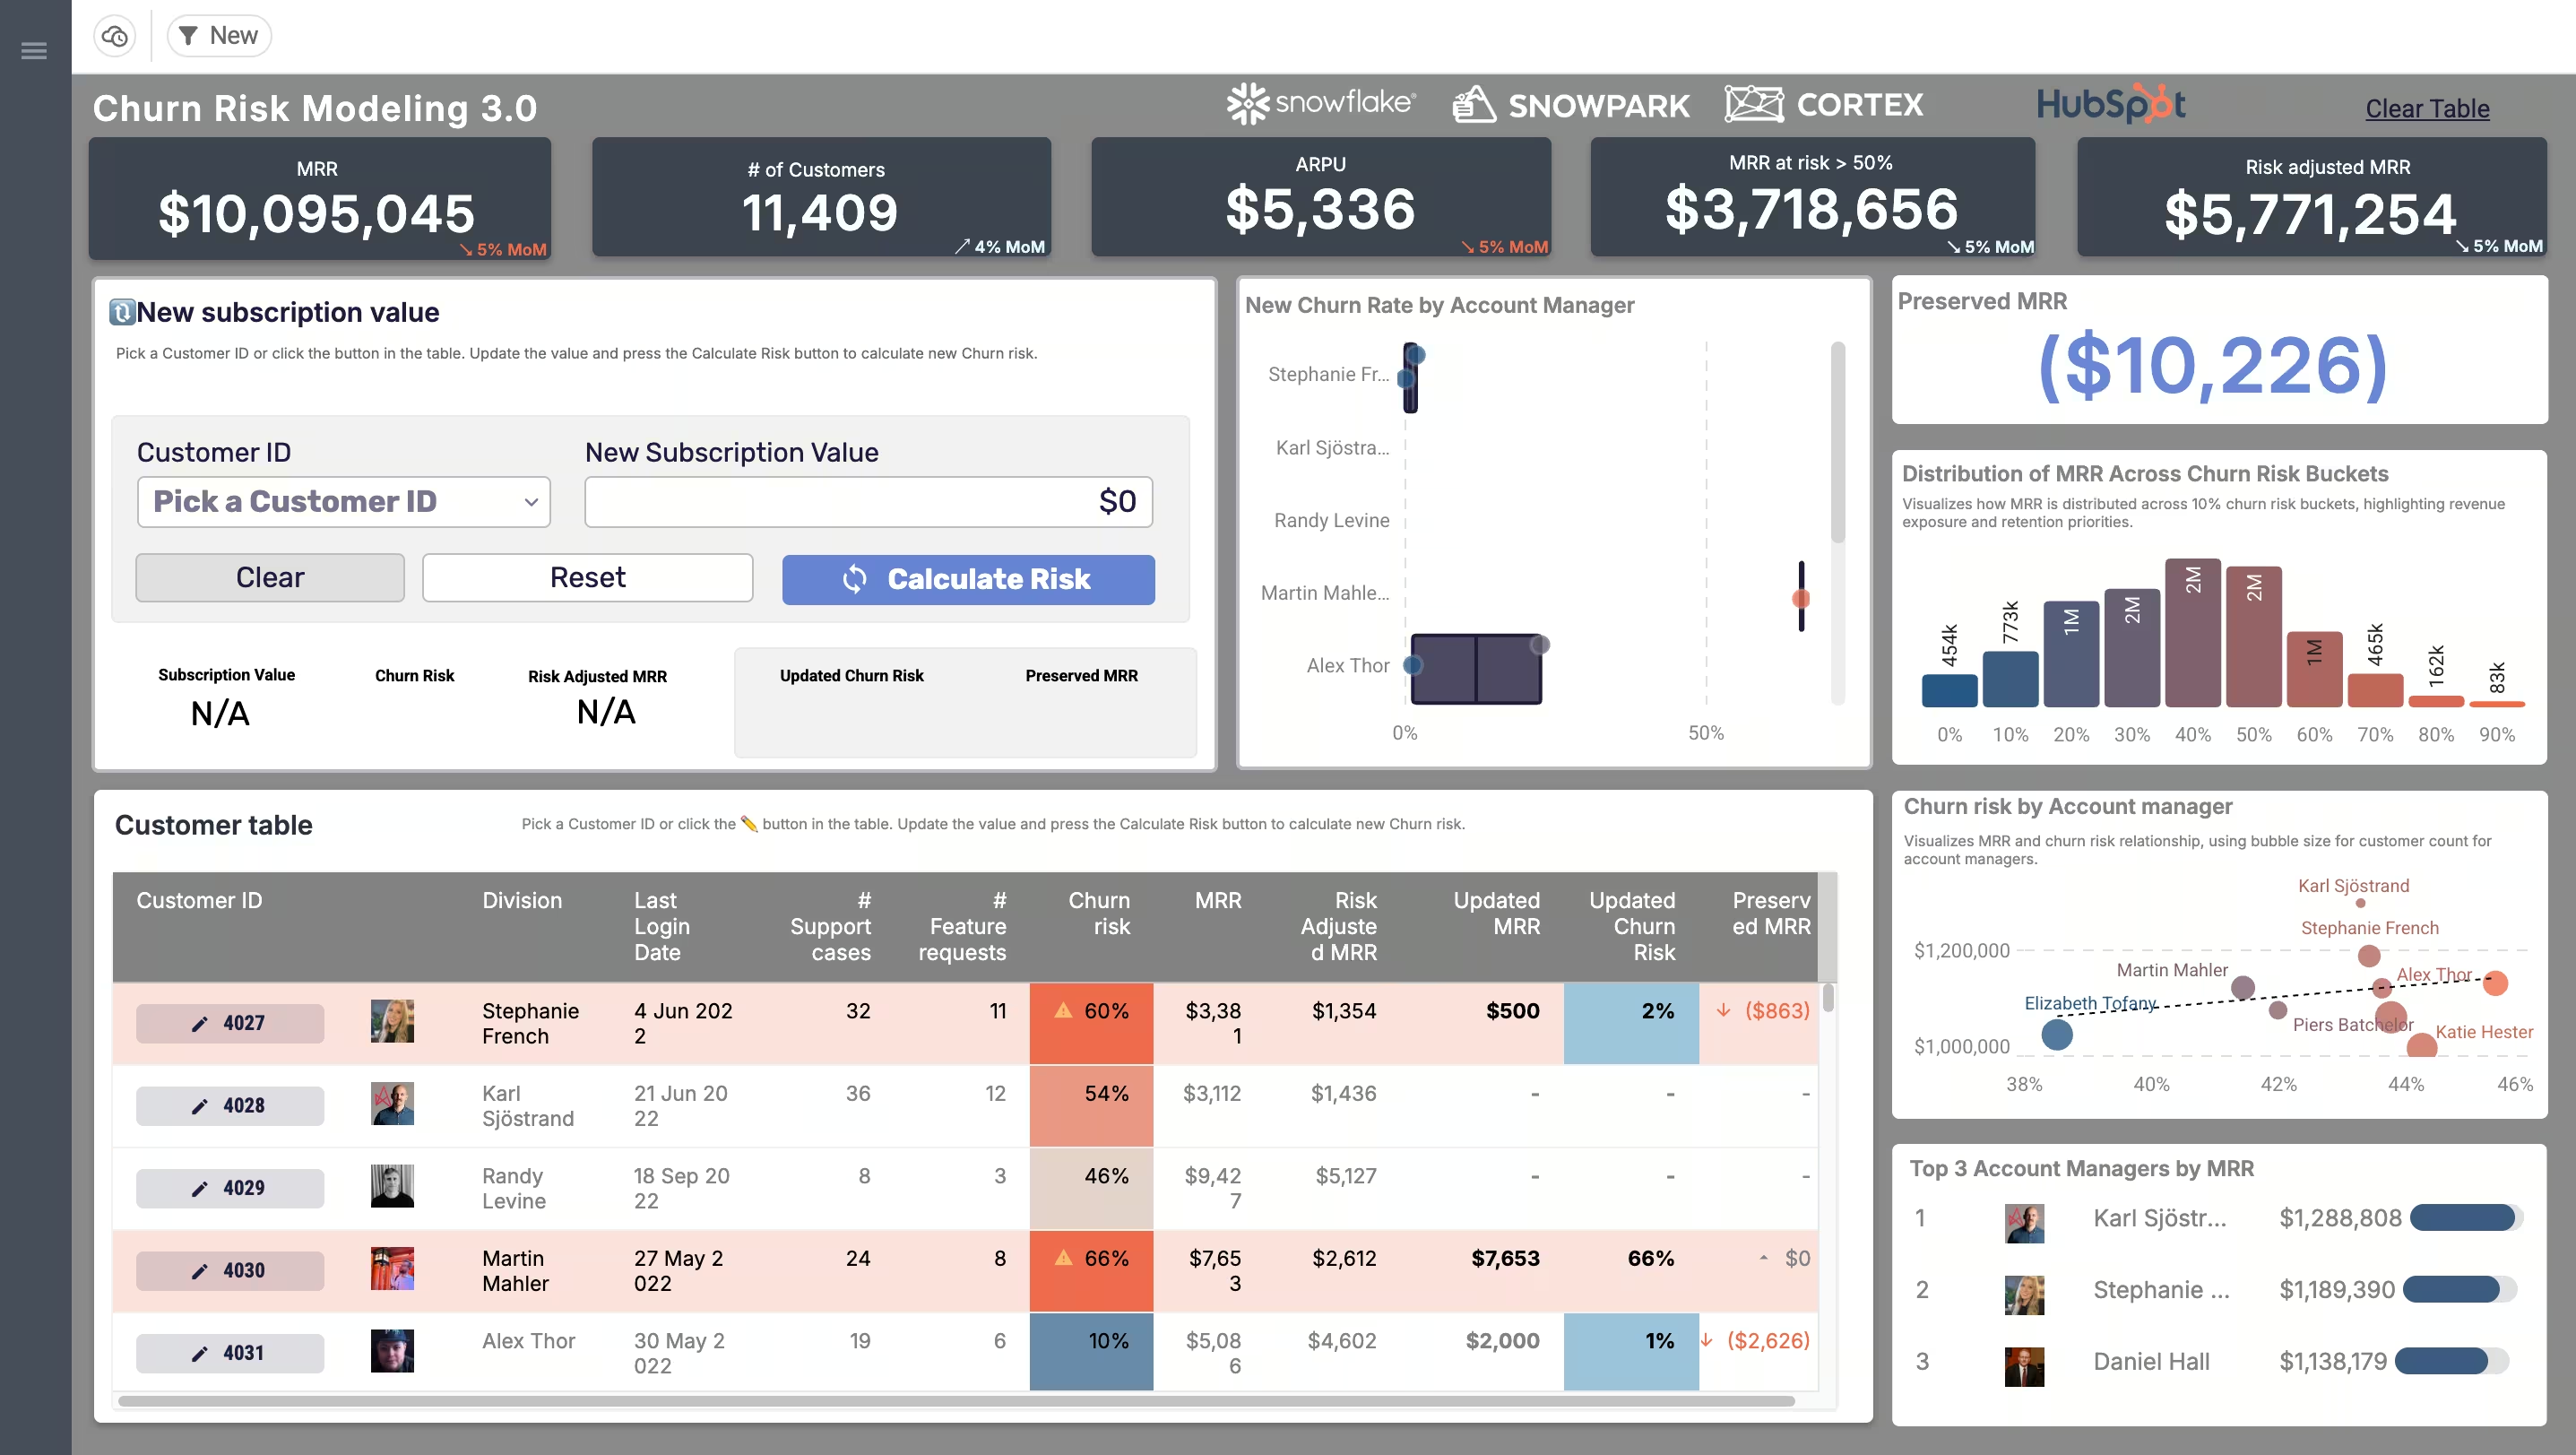
Retention is where revenue quietly leaks. A no-code churn-risk app lets a customer success or RevOps user adjust a customer’s MRR and instantly model the churn risk — an actual scenario you run, not a chart you read — powered by Snowflake and Snowpark. (See the Price Modeling & Churn Risk demo.) This is the data-app pattern at its clearest: change an input, get a modeled outcome, decide an action.
Revenue analytics at scale
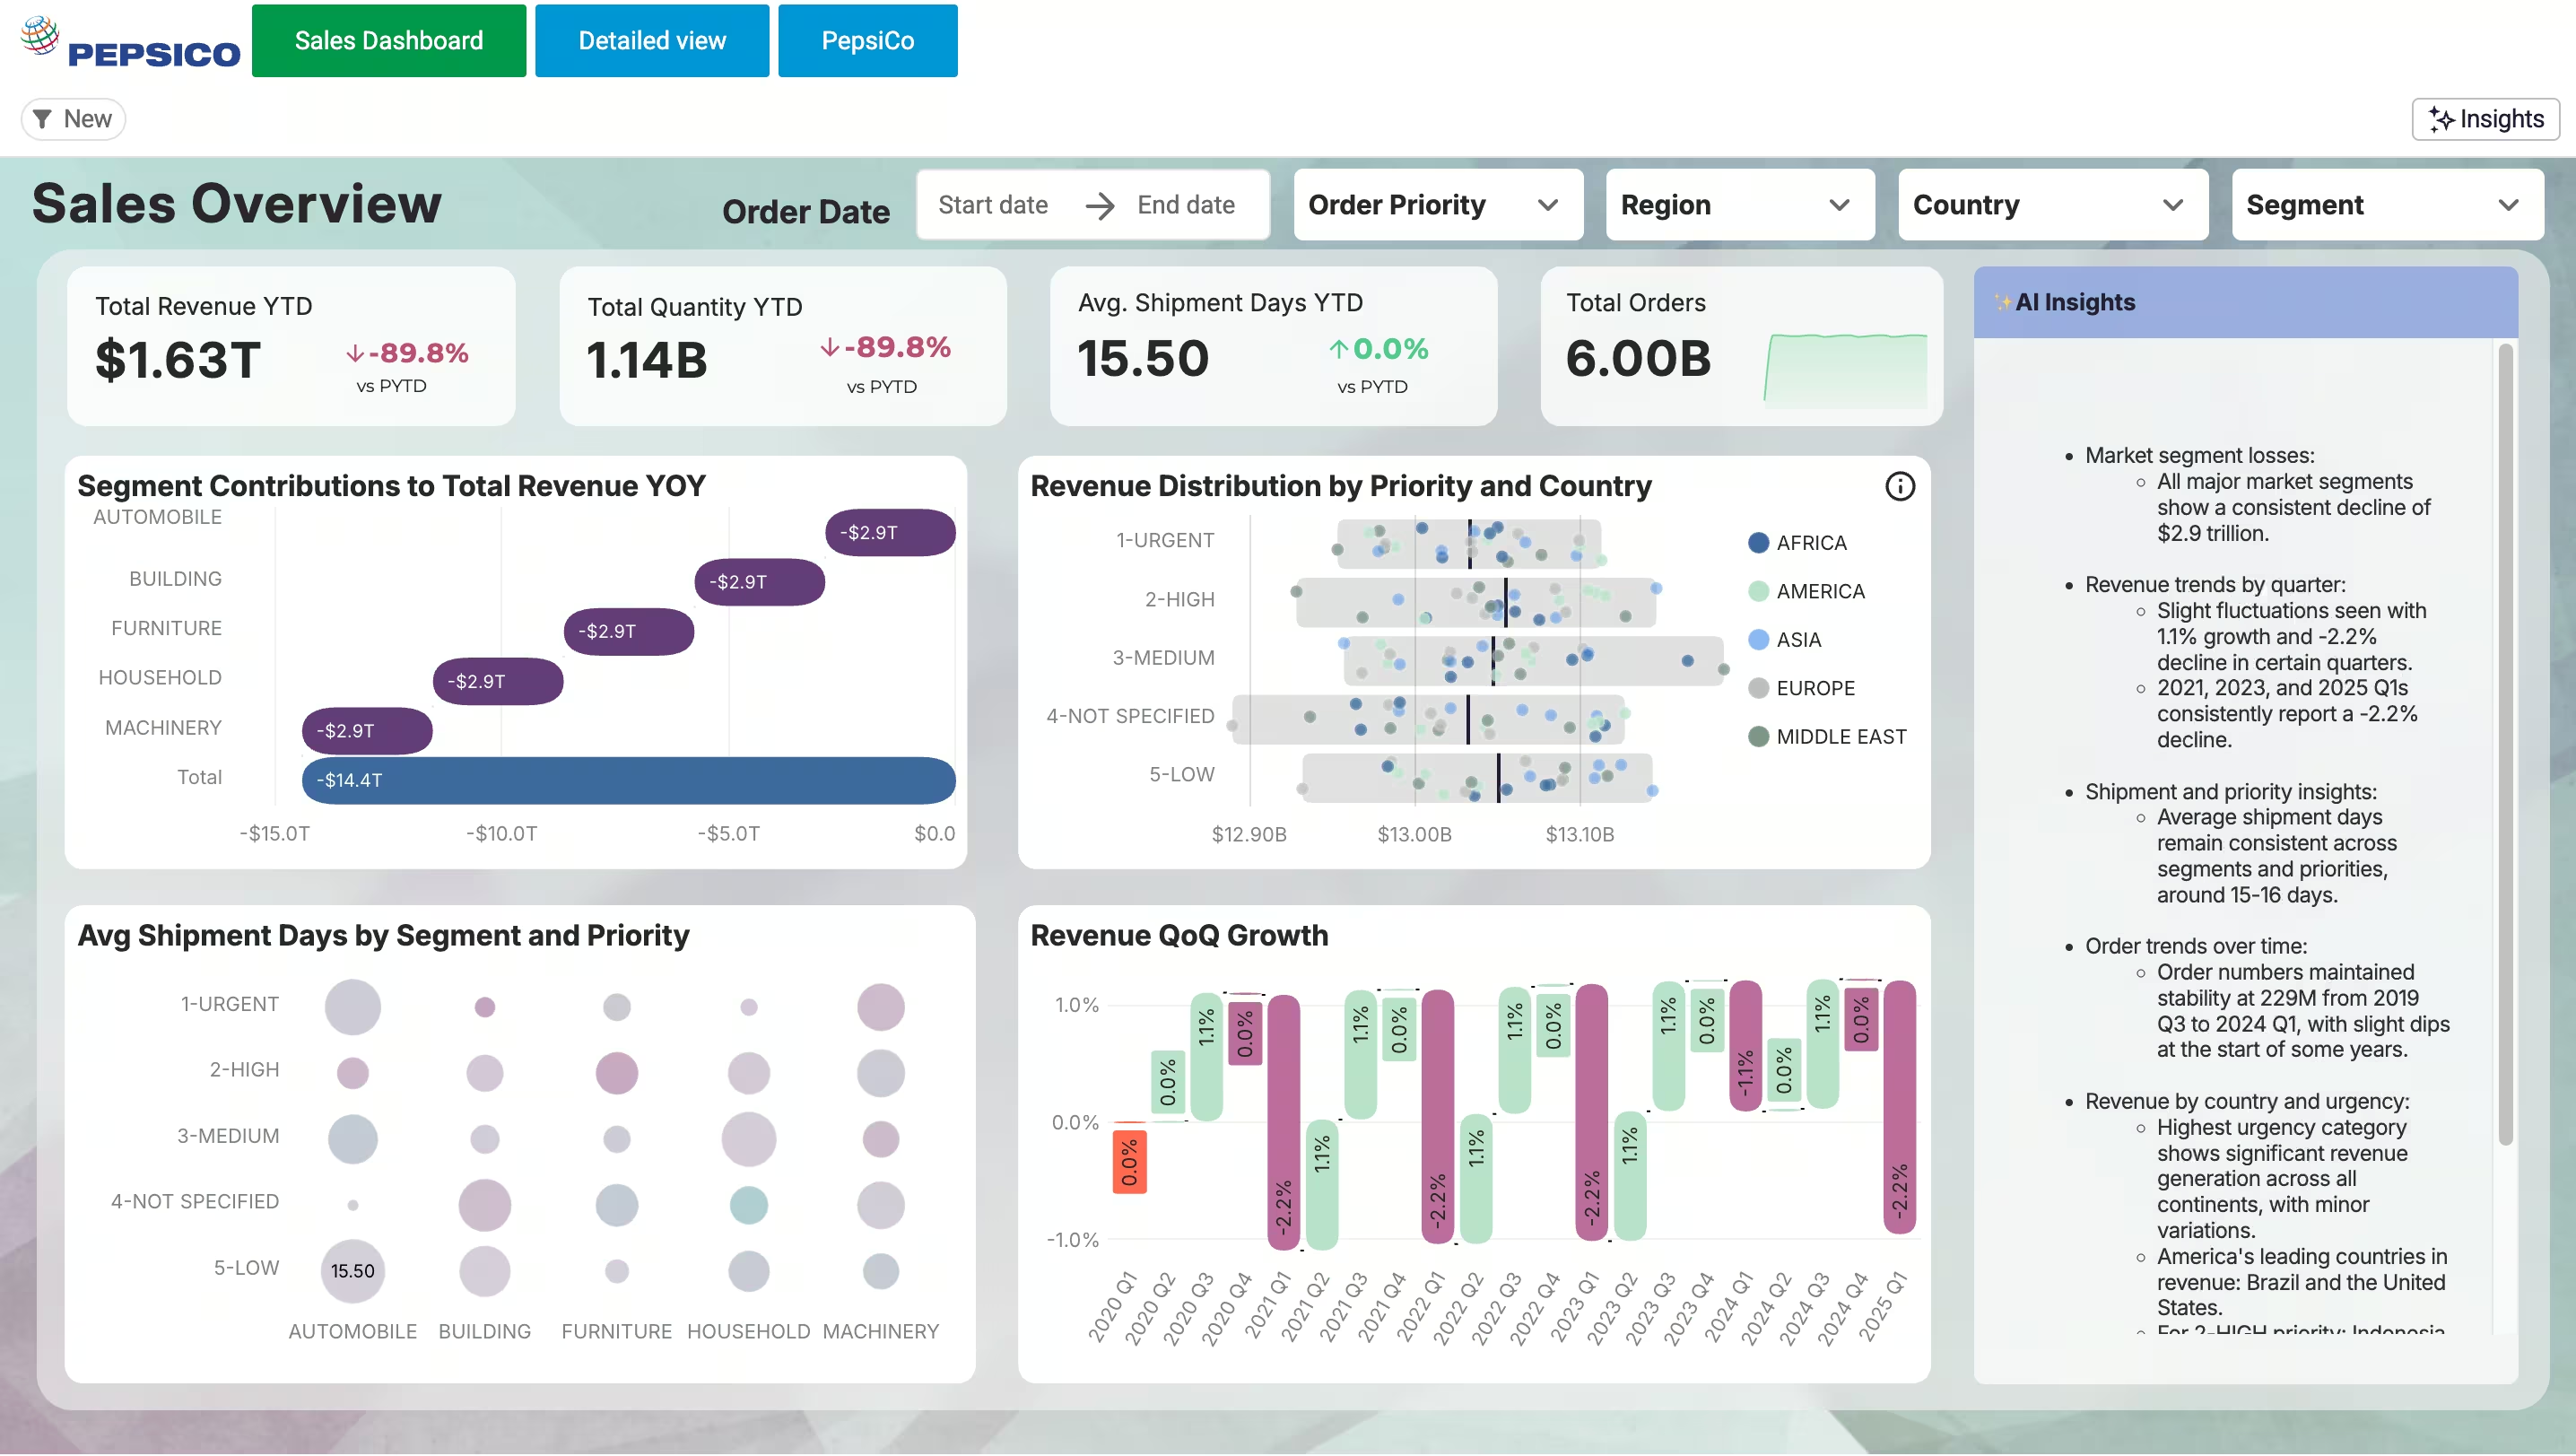
Revenue data gets big fast. A sales-overview app can drill into billions of rows of sales data live from the warehouse with no extracts — the kind of scale a growing revenue engine generates. (See the PepsiCo Sales Overview demo, on 6 billion rows.)
Self-service revenue reporting
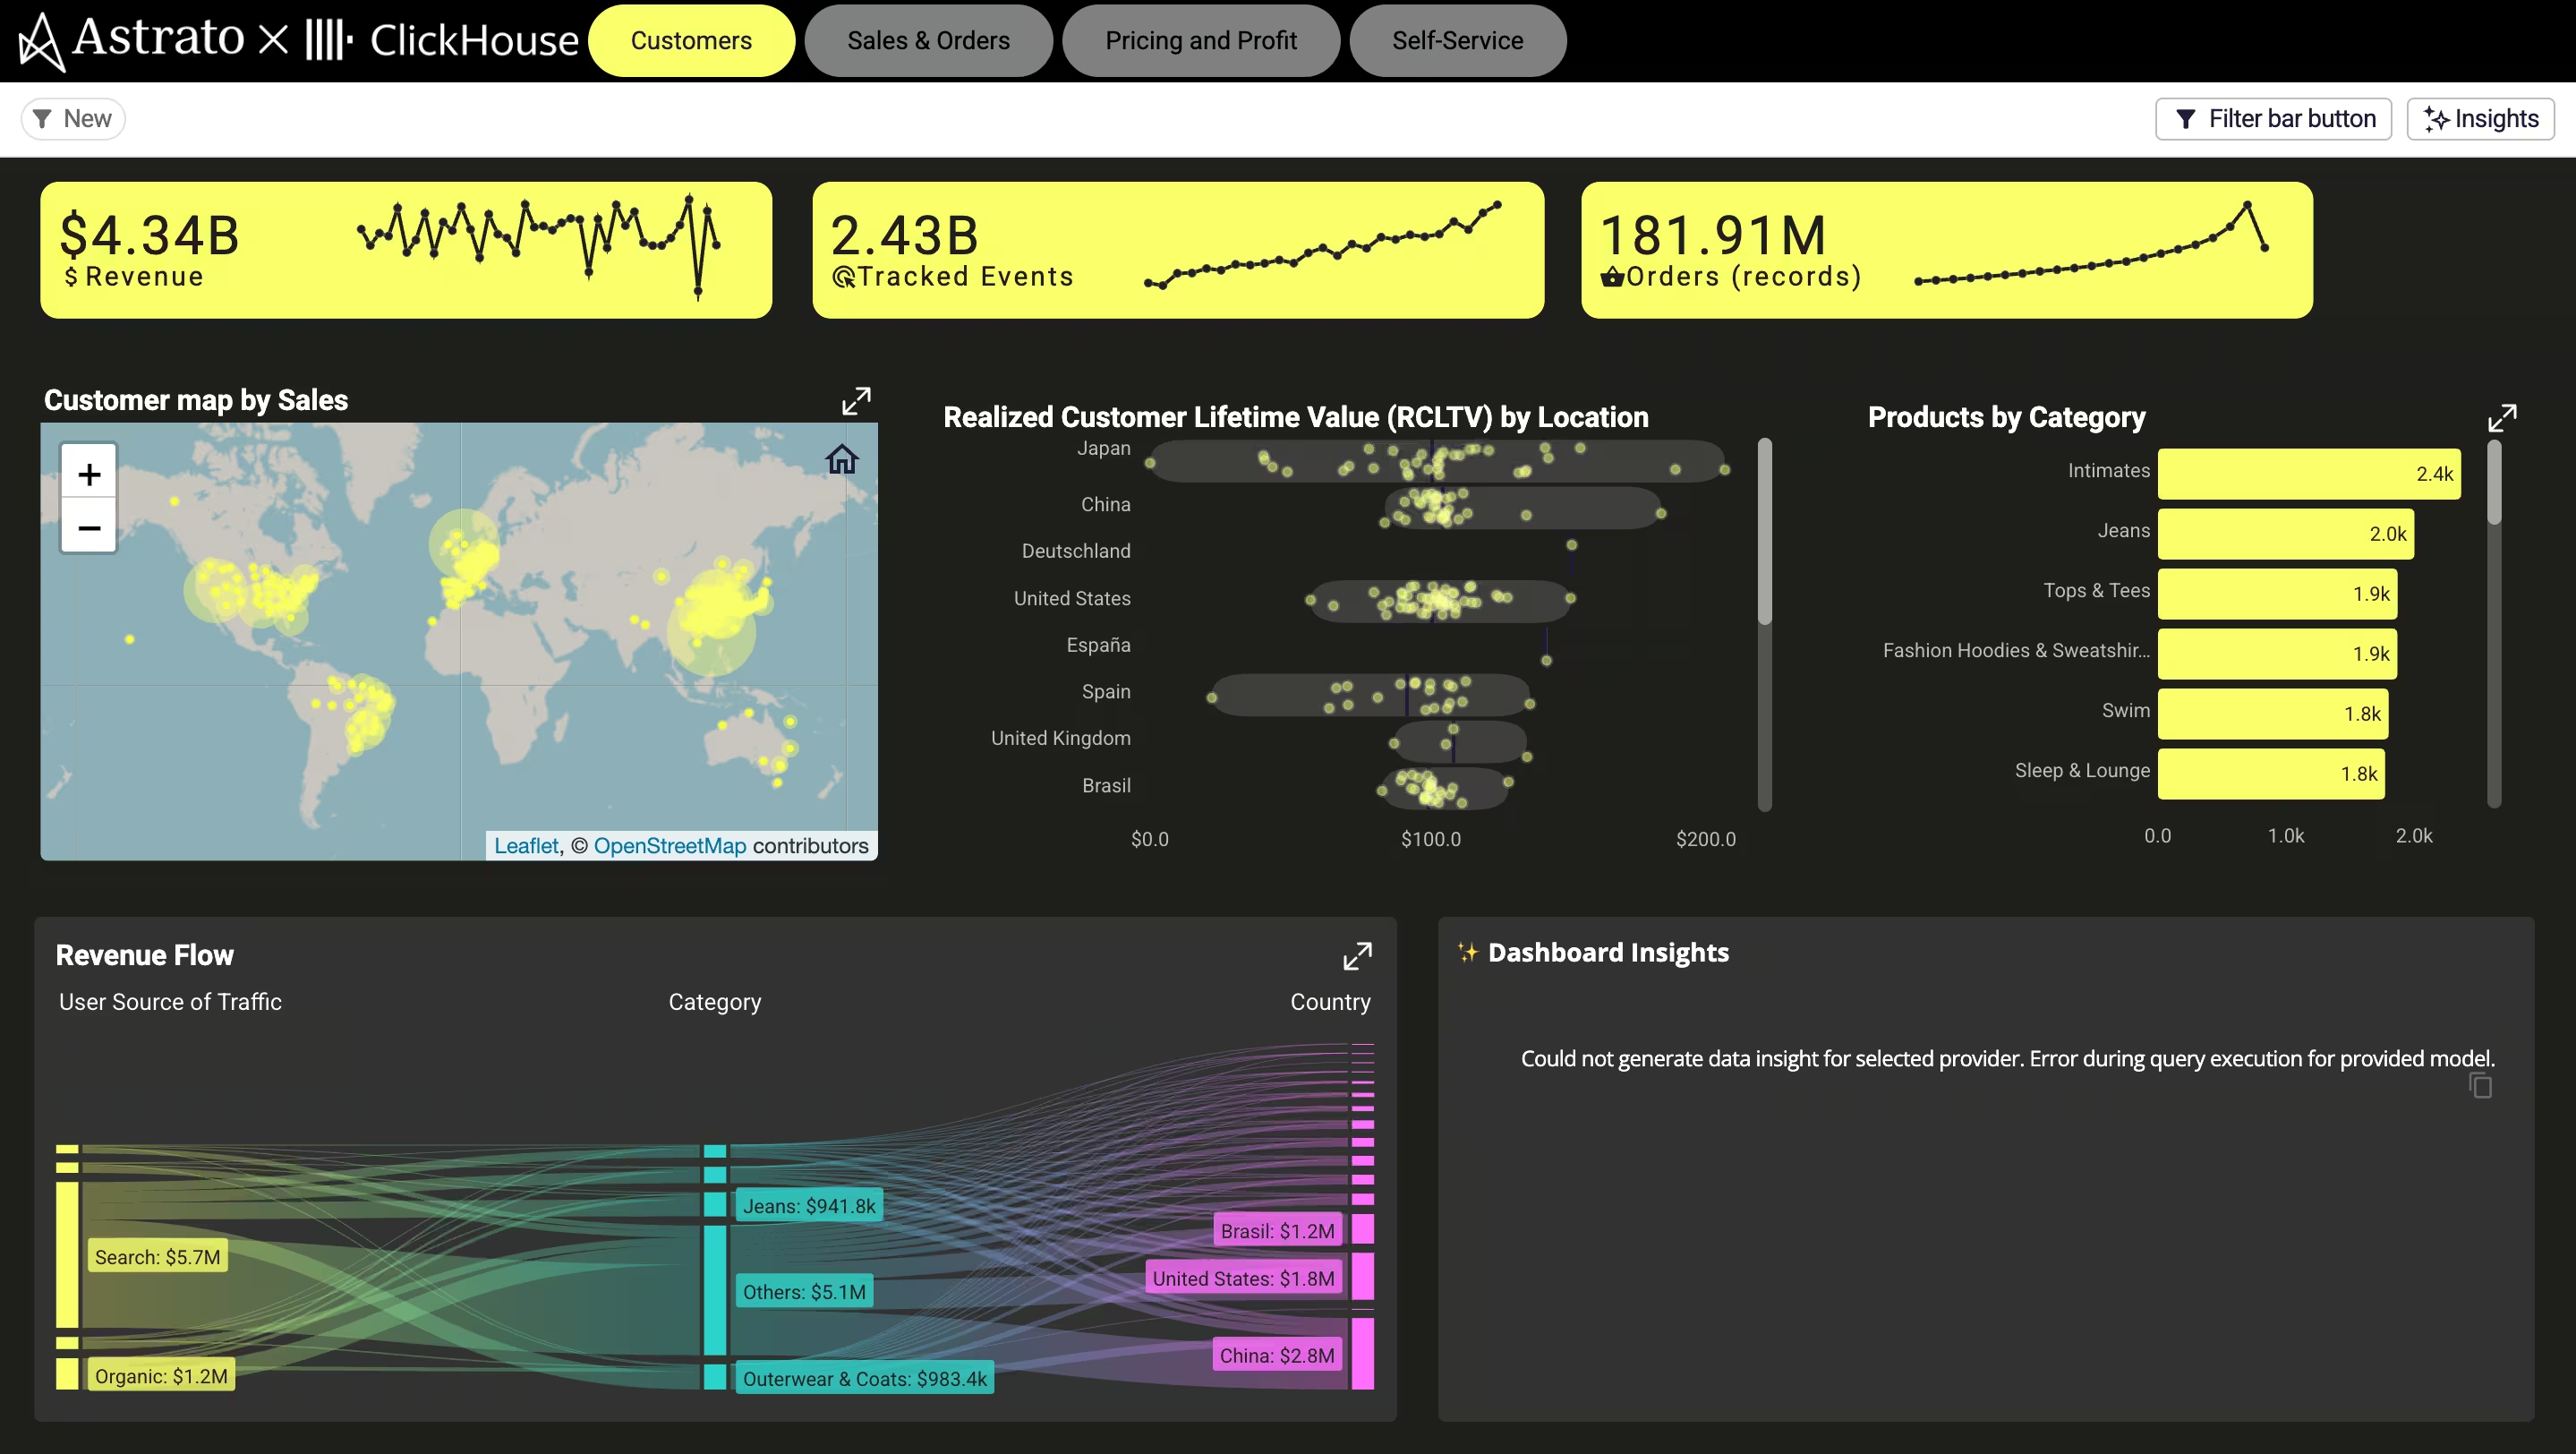
A retail-insights app gives revenue and sales teams self-service analytics — revenue heatmaps, category insights, and AI-generated trends — so they answer their own questions instead of queuing for the data team. (See the Retail Insights demo, powered by ClickHouse.)
Marketing and channel performance
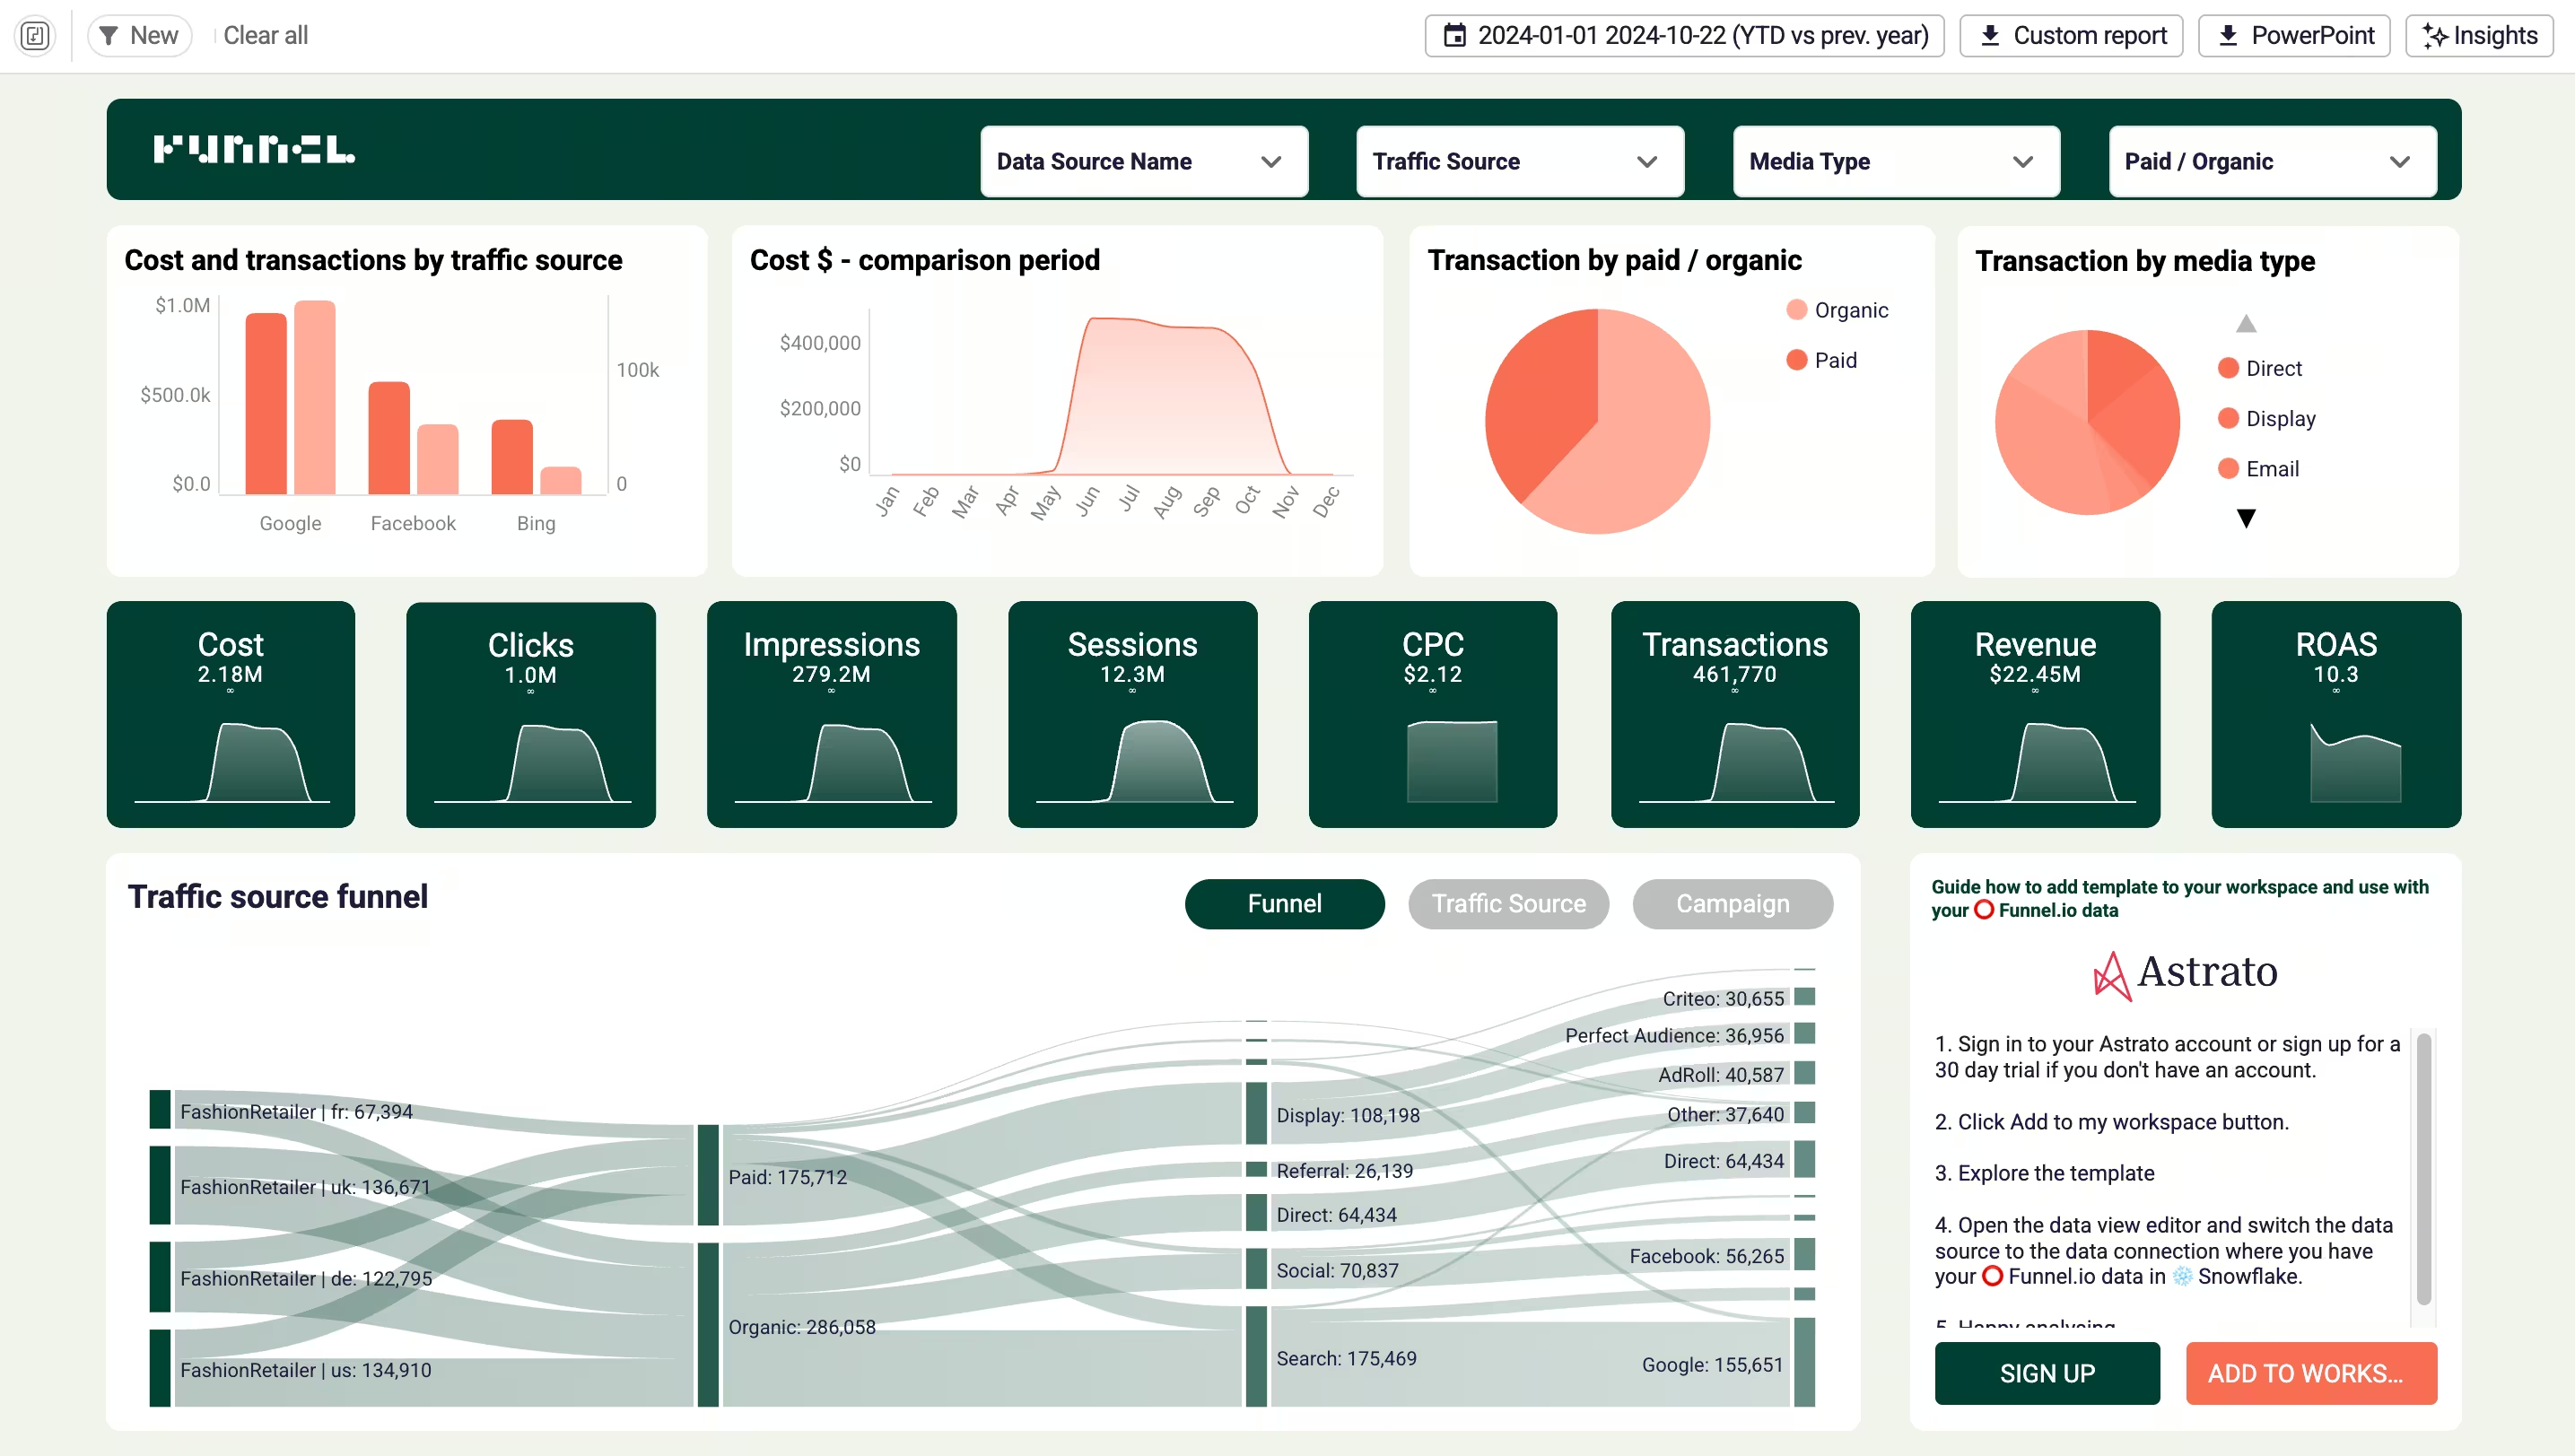
Because RevOps spans the full funnel, the top of it matters too. A marketing-performance template brings advertising data from across channels into one clean, business-ready view of what’s actually driving revenue. (See the Funnel.io advertising channel template.)
Underpinning all of them is self-service calculation — running totals, period comparisons, inline percentage changes — built by the revenue team without SQL or a data-team ticket. (See the Advanced Calculations demo.)
Why warehouse-native is the right foundation for RevOps
Building revenue data apps on the warehouse — rather than inside yet another siloed tool — matters for a few specific reasons:
- One unified source. The warehouse is where CRM, billing, product, and success data already converge, so the data app works on the whole revenue picture, not one slice.
- One definition of every metric. Defining revenue, churn, and ARR once in a semantic layer means the number is the same everywhere — the shared-definition problem solved at the source.
- Real-time, no extracts. Apps run on live warehouse data, so the pipeline and forecast reflect reality now, not the last sync.
- Action, governed. Updates and corrections are written back to the warehouse via writeback, under role-based controls and a full audit trail — the governance RevOps data needs as it feeds the board.
- AI on trusted data. With the data governed and unified, AI can surface revenue trends and draft insights that are actually reliable — grounded in one source rather than scattered, conflicting records.
From dashboards to action
The shift underneath all of this is simple to say and hard to do. For years, the answer to a revenue question was a dashboard — a better view of the numbers. But revenue operations doesn’t run on views; it runs on actions.
Reassigning the account, fixing the record, flagging the renewal, adjusting the forecast — those are the moments that move revenue, and a read-only chart can’t take any of them.
That’s the same move the best data teams are making everywhere, applied to revenue: operationalizing the dashboard into a workflow. Revenue operations data apps are how a RevOps team stops exporting its dashboards into spreadsheets to get anything done — and starts running the revenue engine in one governed place. (It’s the data analytics workflow pattern, pointed at revenue.)
How to get started
- Start with one painful workflow. Pick the revenue process that hurts most — churn flagging, pipeline hygiene, forecast adjustments — and build one data app for it rather than boiling the ocean.
- Unify the data first. Make sure the relevant revenue data is landing in the warehouse and defined consistently before you build on it.
- Put action in from day one. The value is in the verbs — design the app so the team can act, not just look, and write changes back under governance.
- Govern as you go. Establish clear data governance — who can change what, with an audit trail — so the revenue data stays trustworthy as more teams use it.
Frequently asked questions
What is a revenue operations data app?
It's a governed application built on your revenue data in the data warehouse that lets revenue teams both analyze and act — update records, model scenarios, write changes back — rather than just view a dashboard. It turns scattered, read-only revenue data into a workflow teams can run the revenue process on.
How is a revenue operations data app different from a dashboard?
A dashboard is read-only: it shows the pipeline, forecast, or churn risk. A data app adds action — you can change an input, reassign an account, or correct a record, and the change is written back to the warehouse under governance. RevOps runs on actions, not views, which is why the distinction matters.
Does a data app replace our CRM or RevOps software?
No. Tools like the CRM, revenue-intelligence platforms, and revenue clouds run the day-to-day motion and remain the system of action. A revenue operations data app sits on top of the data those tools produce — unified in the warehouse — to analyze across the whole revenue engine and act on it. It's complementary, not a replacement.
What revenue data can you build a data app on?
Any revenue data that lands in your warehouse: CRM and pipeline data, product usage, billing and recurring revenue, marketing and channel performance, and customer success signals. The point of building on the warehouse is that these sources converge there, so the app works on the whole picture.
Why build revenue operations data apps on a data warehouse?
Because the warehouse is where revenue data from every tool already converges, so you get one unified source, one shared definition of each metric via a semantic layer, real-time data with no extracts, governed writeback for action, and AI grounded in trusted data.
How do you start with revenue operations data apps?
Start with one painful workflow — churn flagging, pipeline hygiene, or forecast adjustments — make sure the relevant revenue data is unified in the warehouse, design the app so the team can act and not just look, and establish clear governance so the data stays trustworthy as adoption grows.
Operationalize your revenue data
Astrato is the warehouse-native BI platform revenue teams use to turn revenue operations data into action — governed data apps on Snowflake, BigQuery, Databricks, and more, with writeback, a built-in semantic layer, real-time data, and AI. Explore the demo apps — from CRM sales performance to no-code churn modeling — or book a demo to see your revenue engine run as a workflow, not a dashboard.
Ready to experience next-gen analytics?
See how Astrato runs natively in your warehouse.