What Is a Data App? Definition, Examples, and How They Work
A data app turns a read-only dashboard into a governed interface where business users act on live warehouse data. See how they work and real examples.

A dashboard shows you what happened. A data app lets you do something about it — on live, governed warehouse data, without leaving the screen. Here is what data apps are, how they work, and what separates an effective one from a dashboard with a few buttons bolted on.
It is the middle of the quarter and the VP of Finance is looking at a variance she does not like. The number is right there on the dashboard. She knows what the adjusted forecast should be.
And then she does what everyone does next:
- she leaves.
Opens a spreadsheet, emails a regional manager, files a ticket with the data team, and waits. Somewhere in that handoff, between seeing the problem and acting on it, the insight goes cold.
That handoff is the gap a data app closes. For fifteen years the dashboard has been the default artifact of analytics — the thing you open to see data. The data app is the thing you open to act on it.
Same warehouse underneath, fundamentally different category of tool. This guide explains what a data app actually is, how data apps work, the types you will run into, and how to tell an effective one from a dashboard wearing a costume.
TL;DR
A data app (or data application) is an interactive interface, built on top of your data platform, that lets people both see data and act on it.
Where a dashboard only reads from the warehouse, a data app reads and writes — users submit values, approve requests, map records, or run scenarios, and every action is written back to the cloud data warehouse under governed SQL with full audit trails.
Data apps need three things to work at scale: live query on real-time data, a semantic layer so everyone works from governed data, and writeback under the warehouse's own security model. Get those right and a dashboard becomes the place work actually happens.
What is a data app?
A data app is a web application whose entire job is to let people interact with data and act on the result. You can think of it as the operational cousin of the dashboard. A dashboard presents data; a data app lets you manipulate data and push your changes back to where the data lives. The interface might look like a familiar dashboard — charts, tables, filters — but it adds inputs: forms, approve buttons, editable cells, sliders, comment fields. When a user acts, the data app writes that action back to the warehouse as a governed record.
The term data application is the formal version; data app is what most teams actually say. They mean the same thing. What distinguishes a modern data application from a generic web or mobile app is where it gets its truth: a data app runs directly on your cloud data warehouse — Snowflake, BigQuery, Databricks, Redshift, Postgres — rather than on a copy of the data sitting in some other system. The warehouse stays the single source of truth for both the reading and the writing.
That single detail is what makes data apps trustworthy enough to run real operations on. Because the app reads live data and writes governed data back to the same place, there is no second copy to drift out of sync, no overnight job to wait on, and no separate security model to maintain. The data never leaves your warehouse.
Most “we need a dashboard” requests in 2026 are data-app requests in disguise. The team does not want to look at the number; they want to do something with it. Dashboards survived as the default because, for years, BI tools could not do anything else. That constraint is gone, which is why the category is moving.
Data app vs. data product: clearing up the vocabulary
Three terms get used interchangeably and should not be. Data app and data application are the same thing. A data product is broader: it is any data asset that is packaged, owned, documented, and maintained for other people to use — that could be a curated dataset, an API, a metric definition, or an app. A data app is one especially useful way to ship a data product: it wraps governed data in an interface that lets business users get value from it without touching SQL.
So the relationship is: data products are the what (a maintained, trustworthy asset built from your data sources), and data apps are one of the best hows (the interface people actually open). If your data team already thinks in terms of data products, a data app is how you put one in front of a non-technical user without losing governance.
A data app looks simple on the surface and depends on a specific stack underneath. Five pieces do the work.
1. Live query on the warehouse
The app queries your cloud data warehouse directly instead of importing data into its own engine. That means users see live data — data in real time, not last night's extract. Live query matters more for a data app than for a dashboard, because if one user writes a value, the next user has to see it immediately. Extract-and-refresh architectures break that loop.
2. A semantic layer and data models
Shared data models and metric definitions sit between the raw data and the app, so a “customer” or “net revenue” means the same thing everywhere. This is what keeps governed data consistent as more people interact with data through more apps. It is also what lets analytics engineers maintain logic in one place rather than burying it inside individual dashboards.
3. Writeback under governed SQL
This is the capability that turns a dashboard into a data app. Writeback lets a user action — a typed value, an approval, a mapping, a comment — land in the warehouse as a governed write, executed under SQL with the same role-based permissions and audit posture as anything else stored there. Not a CSV export. Not an overnight sync. A real, governed, reversible write.
4. No-code actions and workflow logic
Effective data apps let you build the workflow — approval chains, validation rules, triggers — visually, without scripting. The point of the pattern is to put the process in the hands of the business users who own it, so defining “finance approves under $25k, the director approves under $100k” should not require an engineer.
5. Warehouse-native security
Because writes inherit the warehouse's own model, data security, row-level permissions, data encryption, and audit all come from the place that already enforces them. Sensitive data and customer data never get copied into a separate tool with its own access rules. This is the difference between governance that is designed in and governance that is bolted on.
Put together, these five let a data app handle large volumes of data and many concurrent users without re-architecture, because the heavy lifting — compute, storage, governance — stays in the warehouse where it scales.
Features of effective data apps
Plenty of tools now claim “data apps.” When you evaluate them, the features that separate an effective data app from a dashboard with input boxes are concrete:
- Governed writeback: writes inherit warehouse permissions and produce an audit trail you can query. If the answer to “can we roll this back?” is “it depends,” it is not enterprise-ready.
- Live data, not extracts: the next user sees the last user's change immediately. Data accuracy depends on it.
- No-code workflow logic: approval routing and validation are built visually, so the people who own the process can maintain it.
- Audit, versioning, and rollback: every change is visible and reversible, ideally via the warehouse's native time-travel.
- Multi-warehouse fit: the app treats warehouse choice as configuration, so it still works when your stack grows from one warehouse to several.
- Embeddable: the same app can be white-labeled into a product or portal, which is what makes customer-facing data apps possible.
Most data apps fall into four patterns. They look different on the surface, but each one moves a workflow that used to require leaving the BI tool back inside it. Here are the types, with examples of data apps running in production.
1. Master data and dimension management
Business users unify records that disagree across multiple systems — product codes, customer records, regional hierarchies — and write the agreed standard back to the warehouse, with an audit trail.
Example: Ceres Pharma grew through 14 acquisitions into 23 entities, each with its own ERP, so the same product appeared under three codes. Rather than a multi-year master-data project, their team built a data app where business experts map each product to one corporate code and write it back to Snowflake — built in less time than evaluating another tool would have taken.
2. Operational planning and approval workflows
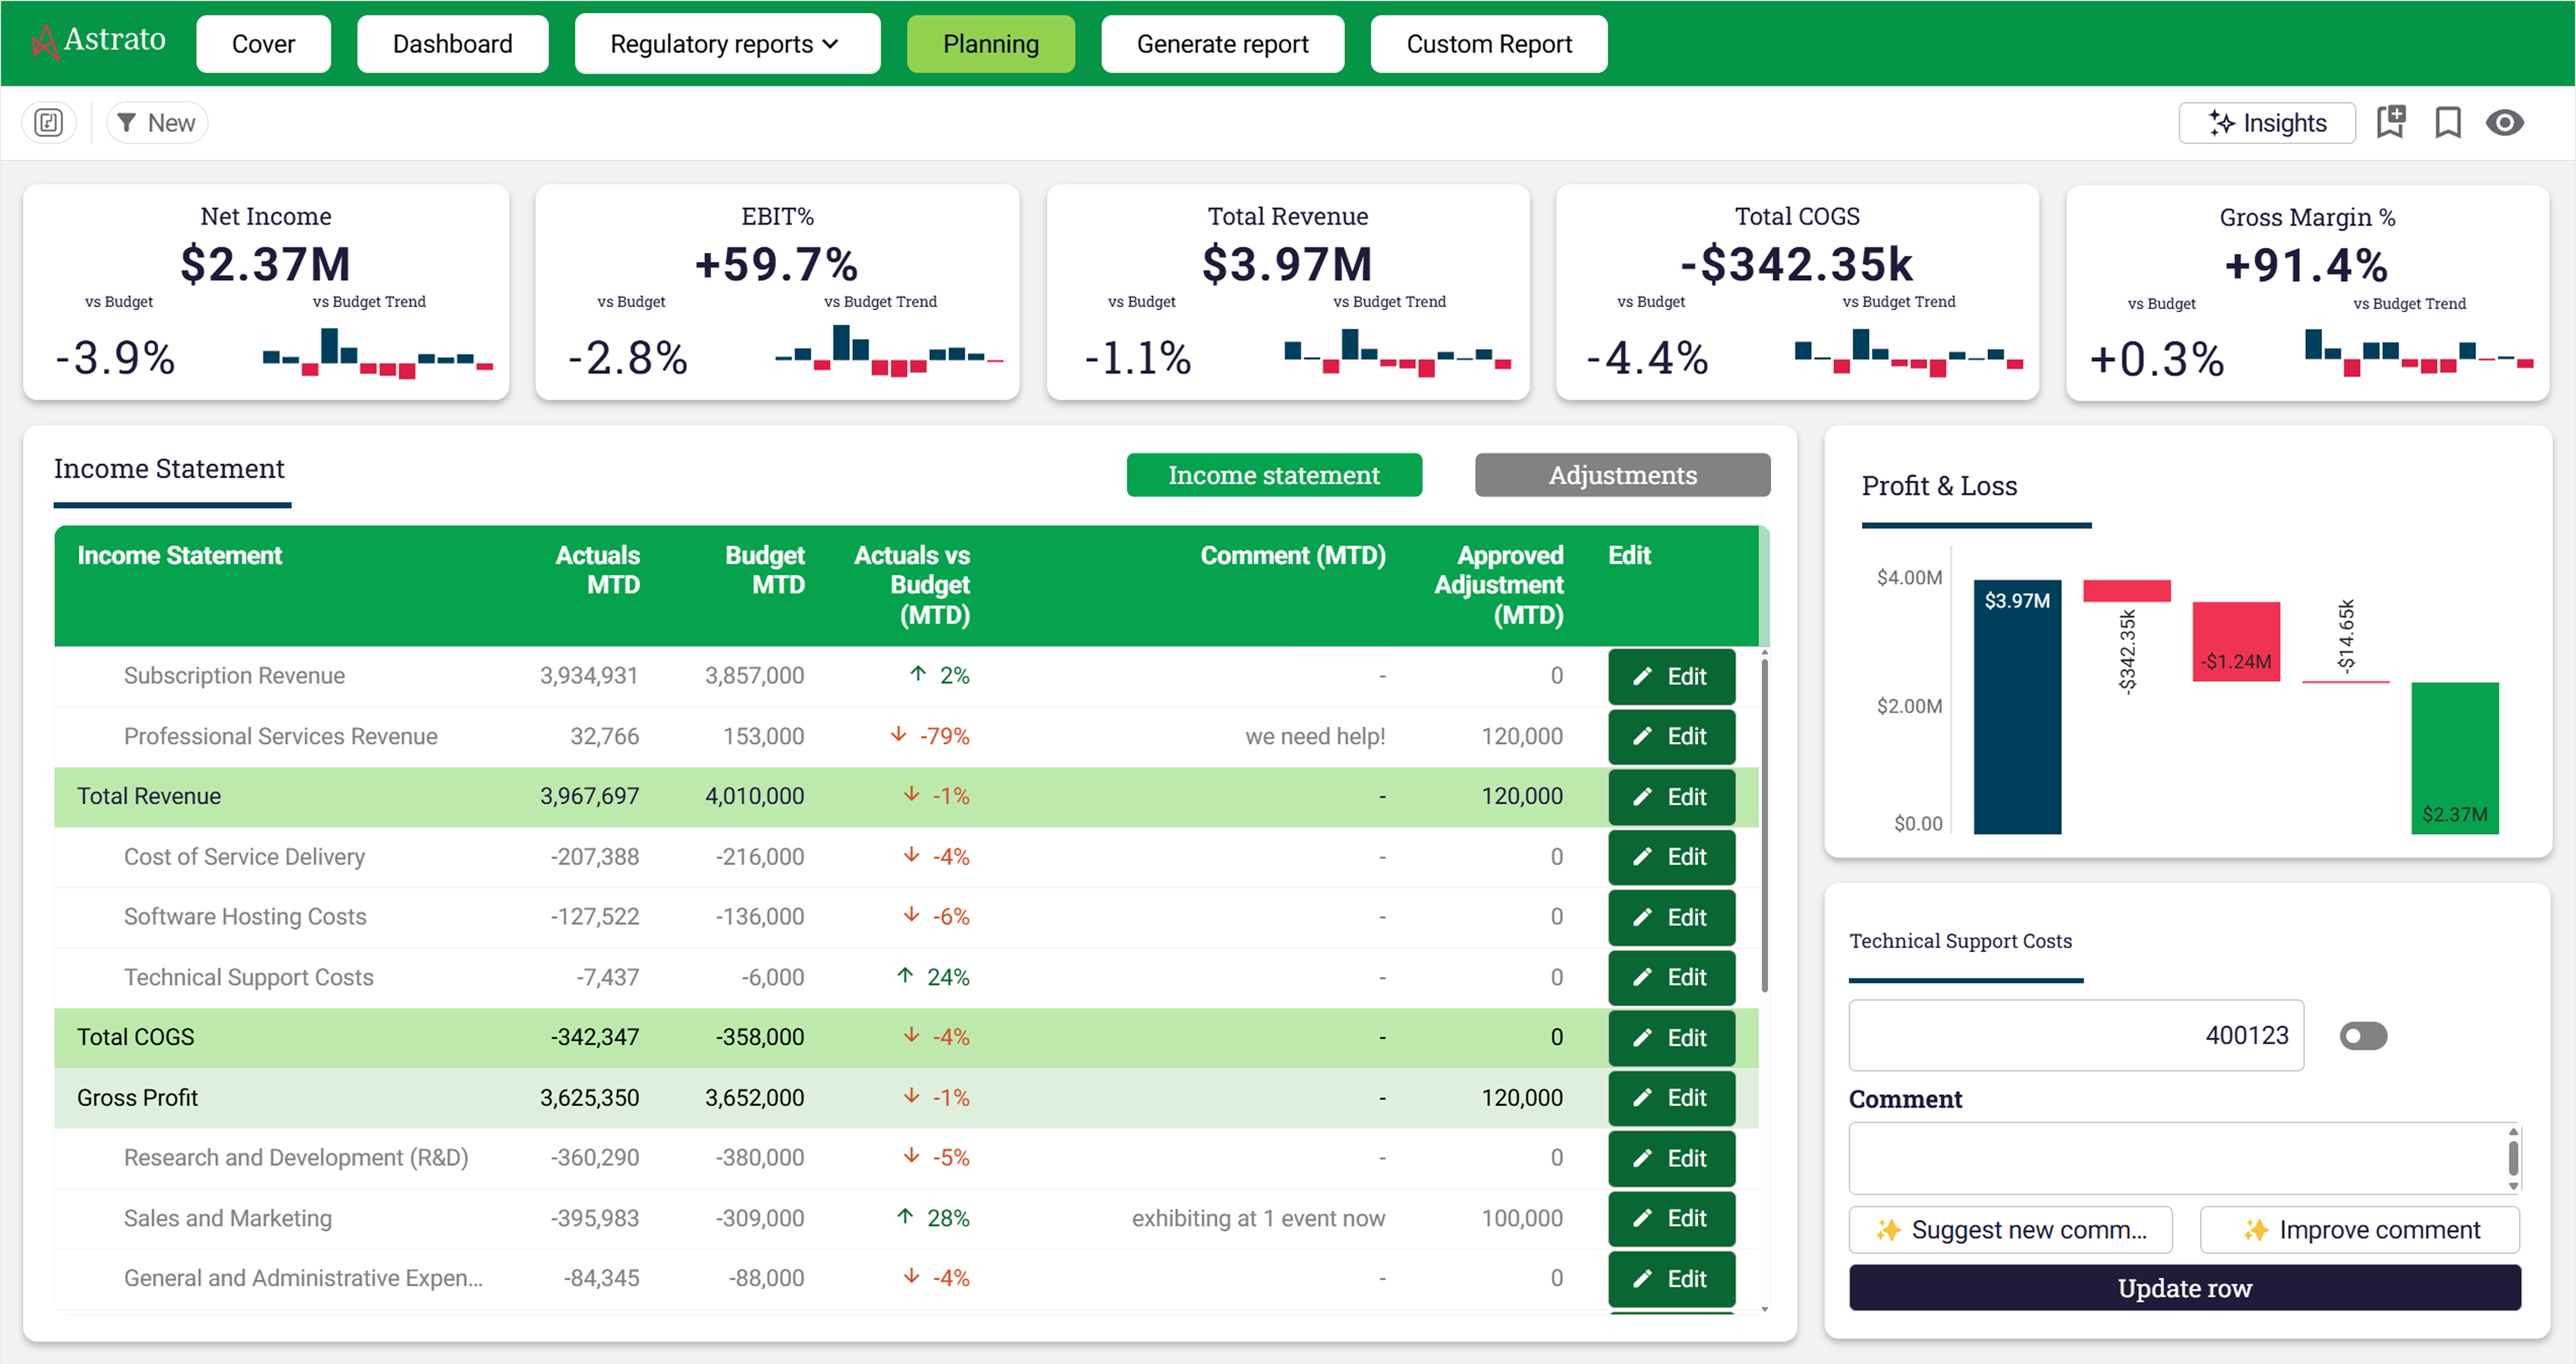
Budgeting, forecasting, and month-end close move out of linked spreadsheets and into a data app, where inputs are validated, approvals are routed, and the audit trail lives in the warehouse — while the Excel or PowerPoint output the business depends on is still generated on demand.
Example: at GlobalData, roughly 250 accountants used to spend four to five person-weeks a month copying CSV exports into Excel templates. Rebuilt as data apps on Snowflake, a hierarchy change now propagates in 15 minutes instead of across hundreds of spreadsheets, and the board still gets the same template. A global music publisher (PeerMusic) operationalized the same budgeting pattern across 40 entities in six weeks.
3. Scenario modelling and what-if analysis
Users enter a hypothetical — a price change, a new spec, a headcount plan — and see the consequence against live data in real time, because writeback captures the input and downstream calculations re-run.
Example: Elbiil sells benchmarking to EV manufacturers; their customers spec a hypothetical vehicle inside the dashboard and immediately see how it performs against the market. A two-person team did not have to build a scenario engine — the data app already had one.
4. Customer-facing and embedded data apps
The same pattern, pointed outward: a white-labeled data app embedded in your product so customers explore and act on their own customer data, with each tenant seeing only their slice. This is how teams turn analytics from a cost center into a revenue line — premium, interactive data apps customers will pay for, rather than static reports.
How to get started with data apps
You do not start with a platform migration. You start with one workflow. The shortest path:
- Find the spreadsheet that is secretly a system of record. If a critical process runs on a workbook that gets emailed around, that is your first data app.
- Confirm the data already lives in your warehouse. Data apps assume the warehouse is the source of truth. If it is, you are ready; if not, that is the prerequisite.
- Rebuild the workflow, not just the report. Move the data entry, validation, and approvals into a single data app — and keep generating the exact output format people already expect.
- Govern from the warehouse. Use the warehouse's permissions and audit so security is inherited, not recreated.
Teams that do this usually find two or three workflows move into the BI layer in the first year, and the count compounds from there. The ones that wait spend those years explaining to the board why the dashboards still do not match the spreadsheets.
Frequently asked questions
What is a data app in simple terms?
A data app is a dashboard you can act inside. Instead of only showing you data, it lets you change it — submit a forecast, approve a budget, fix a record — and writes your action back to the data warehouse under proper permissions and an audit trail.
What is the difference between a data app and a dashboard?
A dashboard is read-only: data flows one direction, from the warehouse to your screen. A data app is bidirectional: you see the current state and act on it, and the action writes back to the warehouse. Most operational use cases — planning, approvals, exception handling — are data-app shaped, not dashboard shaped.
Is a data application the same as a data app?
Yes. “Data application” is the formal term and “data app” is the everyday one. Both describe an interactive interface that lets users read and write governed data from inside the analytics layer.
What is the difference between a data app and a data product?
A data product is any maintained, documented data asset built for others to use — a dataset, an API, a metric, or an app. A data app is one way to deliver a data product: it wraps governed data in an interface a non-technical user can act on.
What do data apps require to run?
Three things: live query against a cloud data warehouse so users see real-time data, a semantic layer so everyone works from governed definitions, and writeback under the warehouse's own security so actions are captured safely. Without those, you have a dashboard with buttons, not a data app.
Can you build data apps on Power BI or Tableau?
Both offer limited writeback through extensions or add-ons, but neither was architected with writeback as a first-class capability — so governance has to be re-established outside the warehouse and workflows like approval chains usually need custom development. For genuine data apps, warehouse-native platforms built for the pattern are a better fit.
What are some examples of data apps?
Budgeting and forecasting apps, month-end close and management-accounts apps, master-data and dimension-mapping apps, what-if scenario tools, and customer-facing embedded analytics where users act on their own data. Each replaces a workflow that used to live in spreadsheets and email.
See what a data app looks like in practice
Astrato is the warehouse-native BI platform for guided self-service, embedded analytics, and operational data apps.
Book a demo or start a free trial to see writeback, approval workflows, and live-query architecture working on your own warehouse data — and explore live examples of data apps in the demo gallery.
Ready to experience next-gen analytics?
See how Astrato runs natively in your warehouse.