Types & Examples of Data Apps: 7 Real-World Examples
Examples of data apps — from finance and sales to operations, forecasting, and embedded analytics. See real interactive data apps and what each one does.

The fastest way to understand a data app is to see one. This guide walks through the main types of data apps — with real, interactive examples you can open and click — so you can recognize which kind your own team needs and borrow ideas to build it.
“Data app” is an easy idea to nod along to and a hard one to picture. So instead of another definition, here are the examples of data apps — grouped by type, each one a real interactive app you can open in the Astrato demo gallery and click through yourself.
A quick reminder of what makes these data apps rather than dashboards: they let you interact with data and act on it — entering inputs, running models, writing values back — not just visualize data and read it. (If you want the full distinction first, see what a data app is and dashboard vs data app.) Every example below runs live on a cloud data warehouse, querying data in real time rather than a stale extract.
TL;DR — the types of data apps at a glance
Data apps fall into a handful of repeatable types. The clearest way to learn what data apps do is by example:
• Operational & workflow apps — act on the data: log issues, manage inventory, steer operations (Bug Reporter, Logistics & Shipping).
• Finance & planning apps — P&L, paginated reporting, scenario inputs (Financial P&L, Finance Planning).
• Predictive & what-if apps — enter a hypothetical, get a model result (Churn Risk, Stock Forecasting, Seattle Housing).
• Sales & customer apps — CRM performance, retail insight (Maventech CRM, Retail Insights).
• AI-powered apps — ask questions, generate summaries, analyze sentiment (Ask Astrato AI, Employee Feedback).
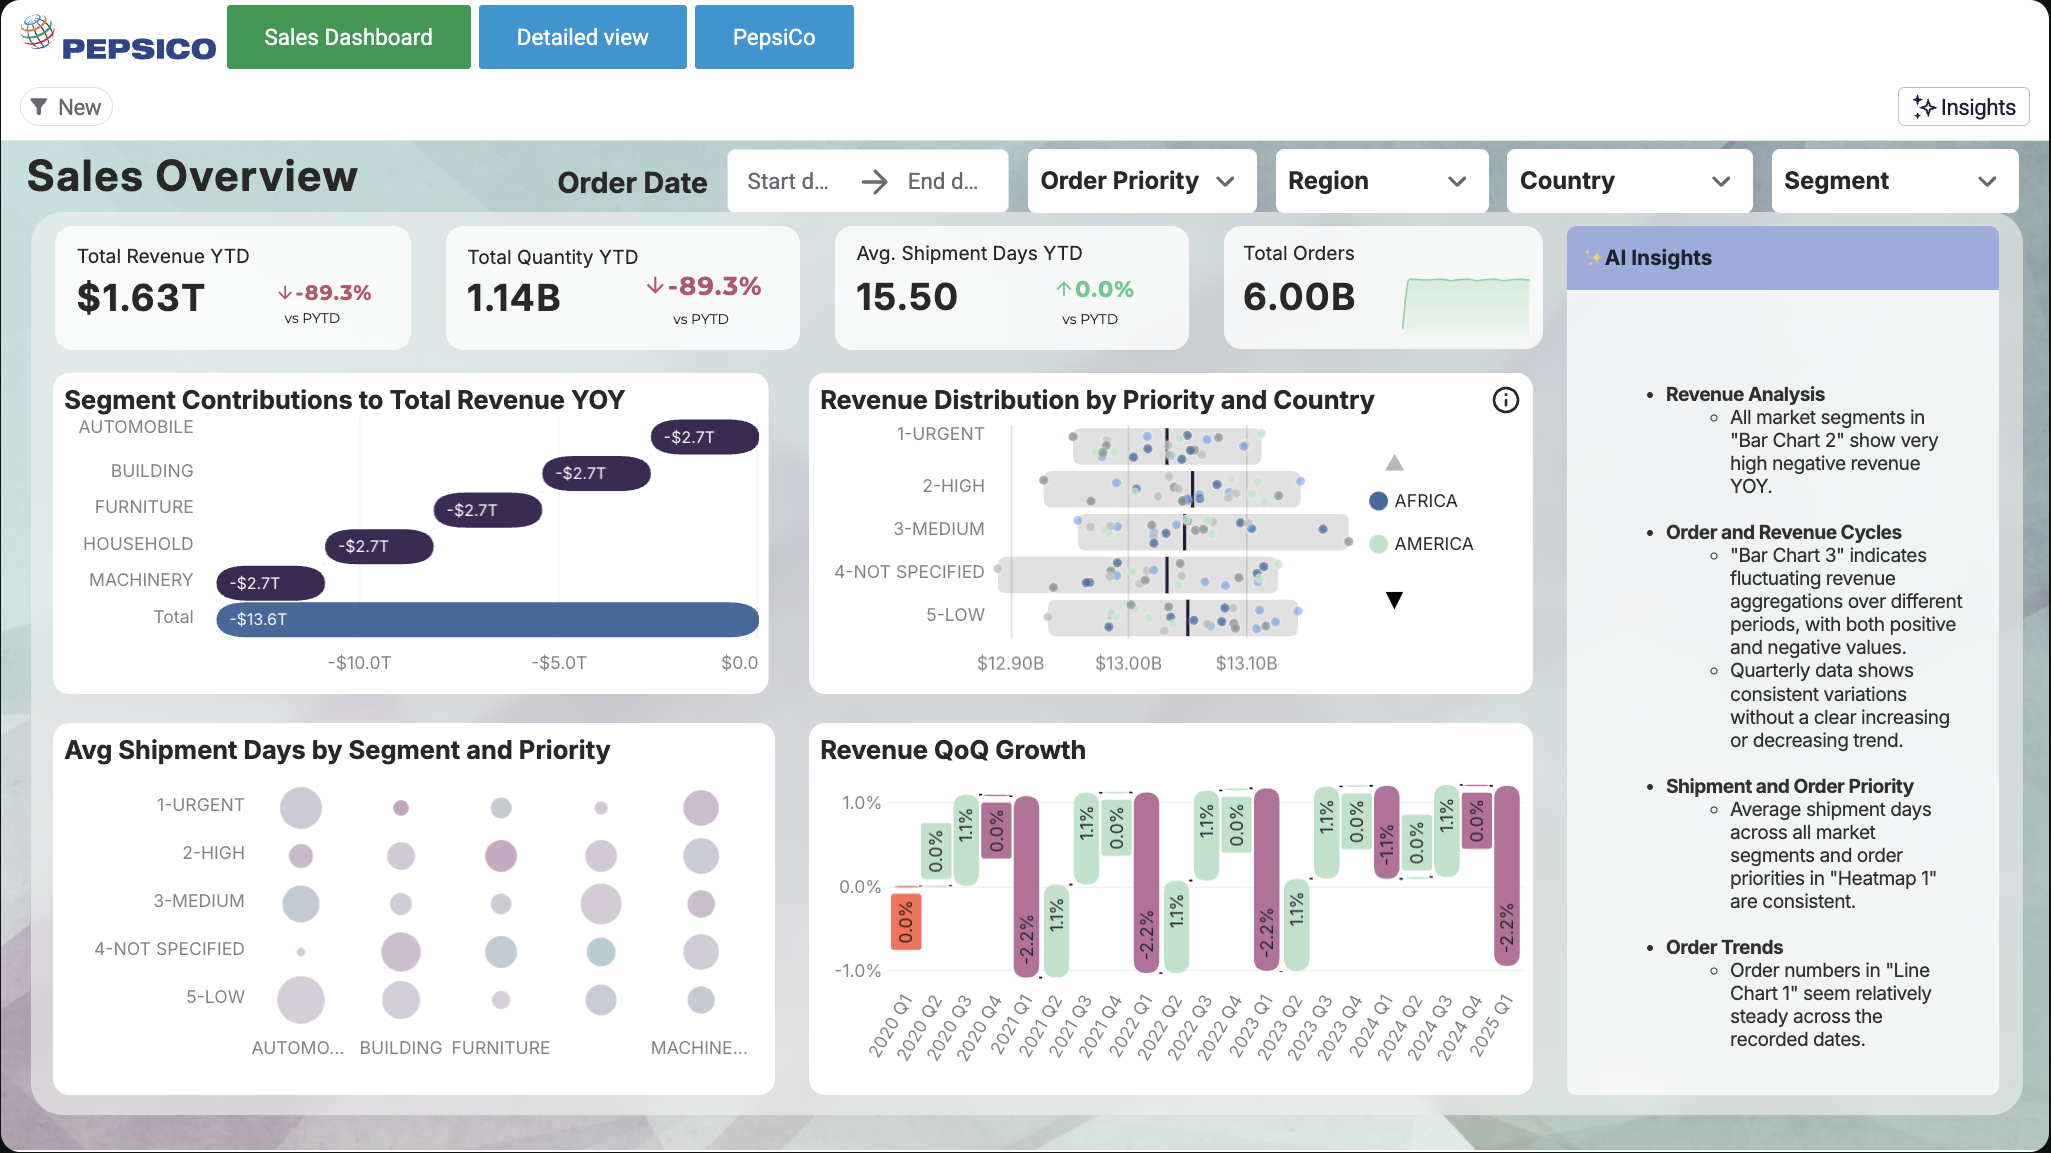
• Big-data & real-time apps — explore billions of rows live (PepsiCo 1.5B rows, ClickHouse logs).
• Data-ingest & admin apps — pull external data in, monitor your own usage (Zoopla/Snowflake ingest, Usage Monitoring).
What makes these examples data apps (not dashboards)
Before the examples, the through-line. A dashboard lets you explore data — view, filter, drill. A data app adds the ability to act on it: an input form, an approve button, a model that runs, a value written back to the data warehouse. The data apps are interactive in a deeper sense than a clickable chart — your actions change something. As you read, watch for that tell: each example doesn’t just present data, it lets a user do something with it.
1. Operational & workflow data apps
These are the clearest examples of data apps: the screen is the workflow. People don’t just monitor a process — they run it, and their actions write back to the warehouse. This is the heart of operational data workflows.
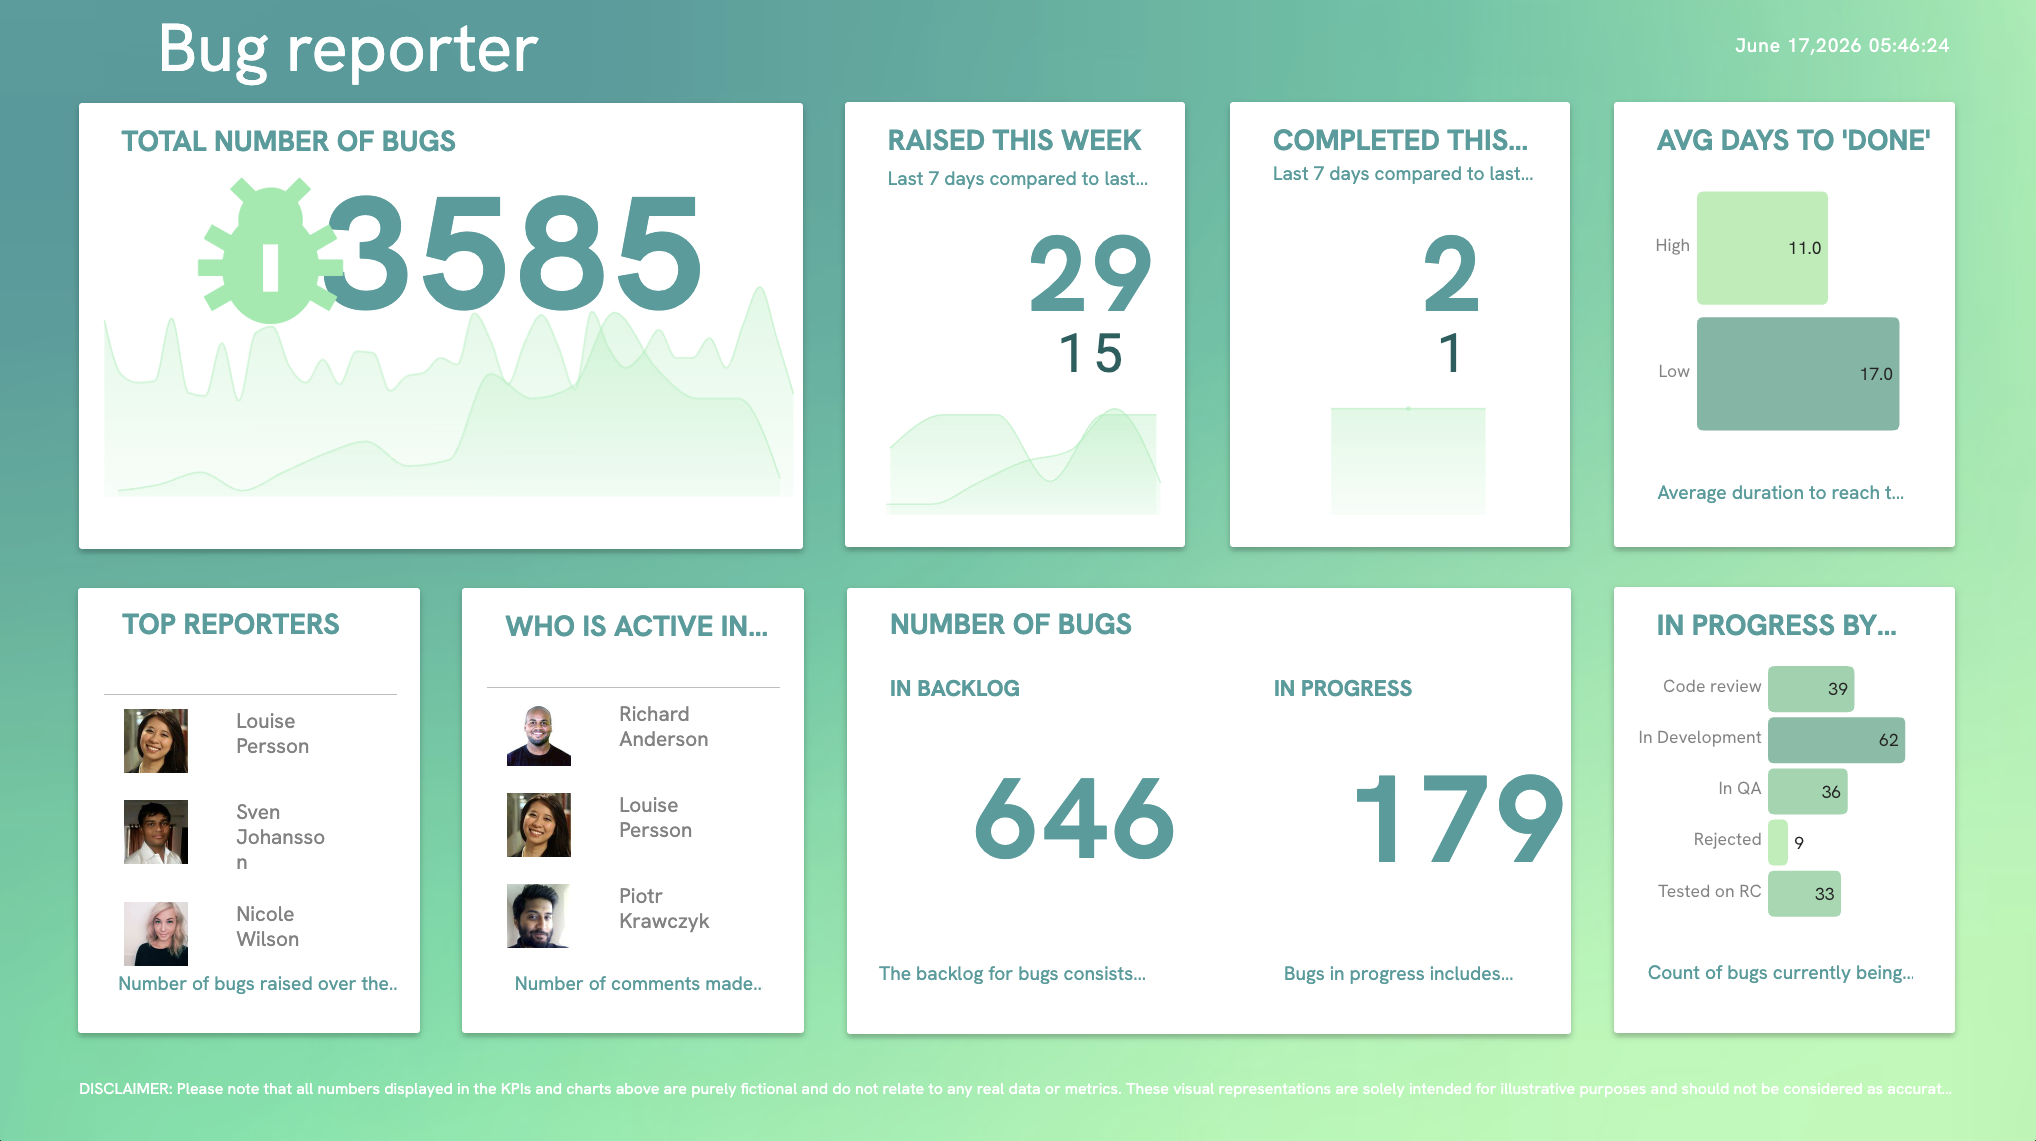
- Bug Reporter: Create and manage issues with inline forms, track top reporters, and filter by status, assignee, and priority — a live issue tracker for product, QA, and support teams, powered by real-time data.
- Logistics & Shipping: With live writeback, the app doesn’t just monitor shipments — you actively steer operations from inside it, updating records as conditions change.
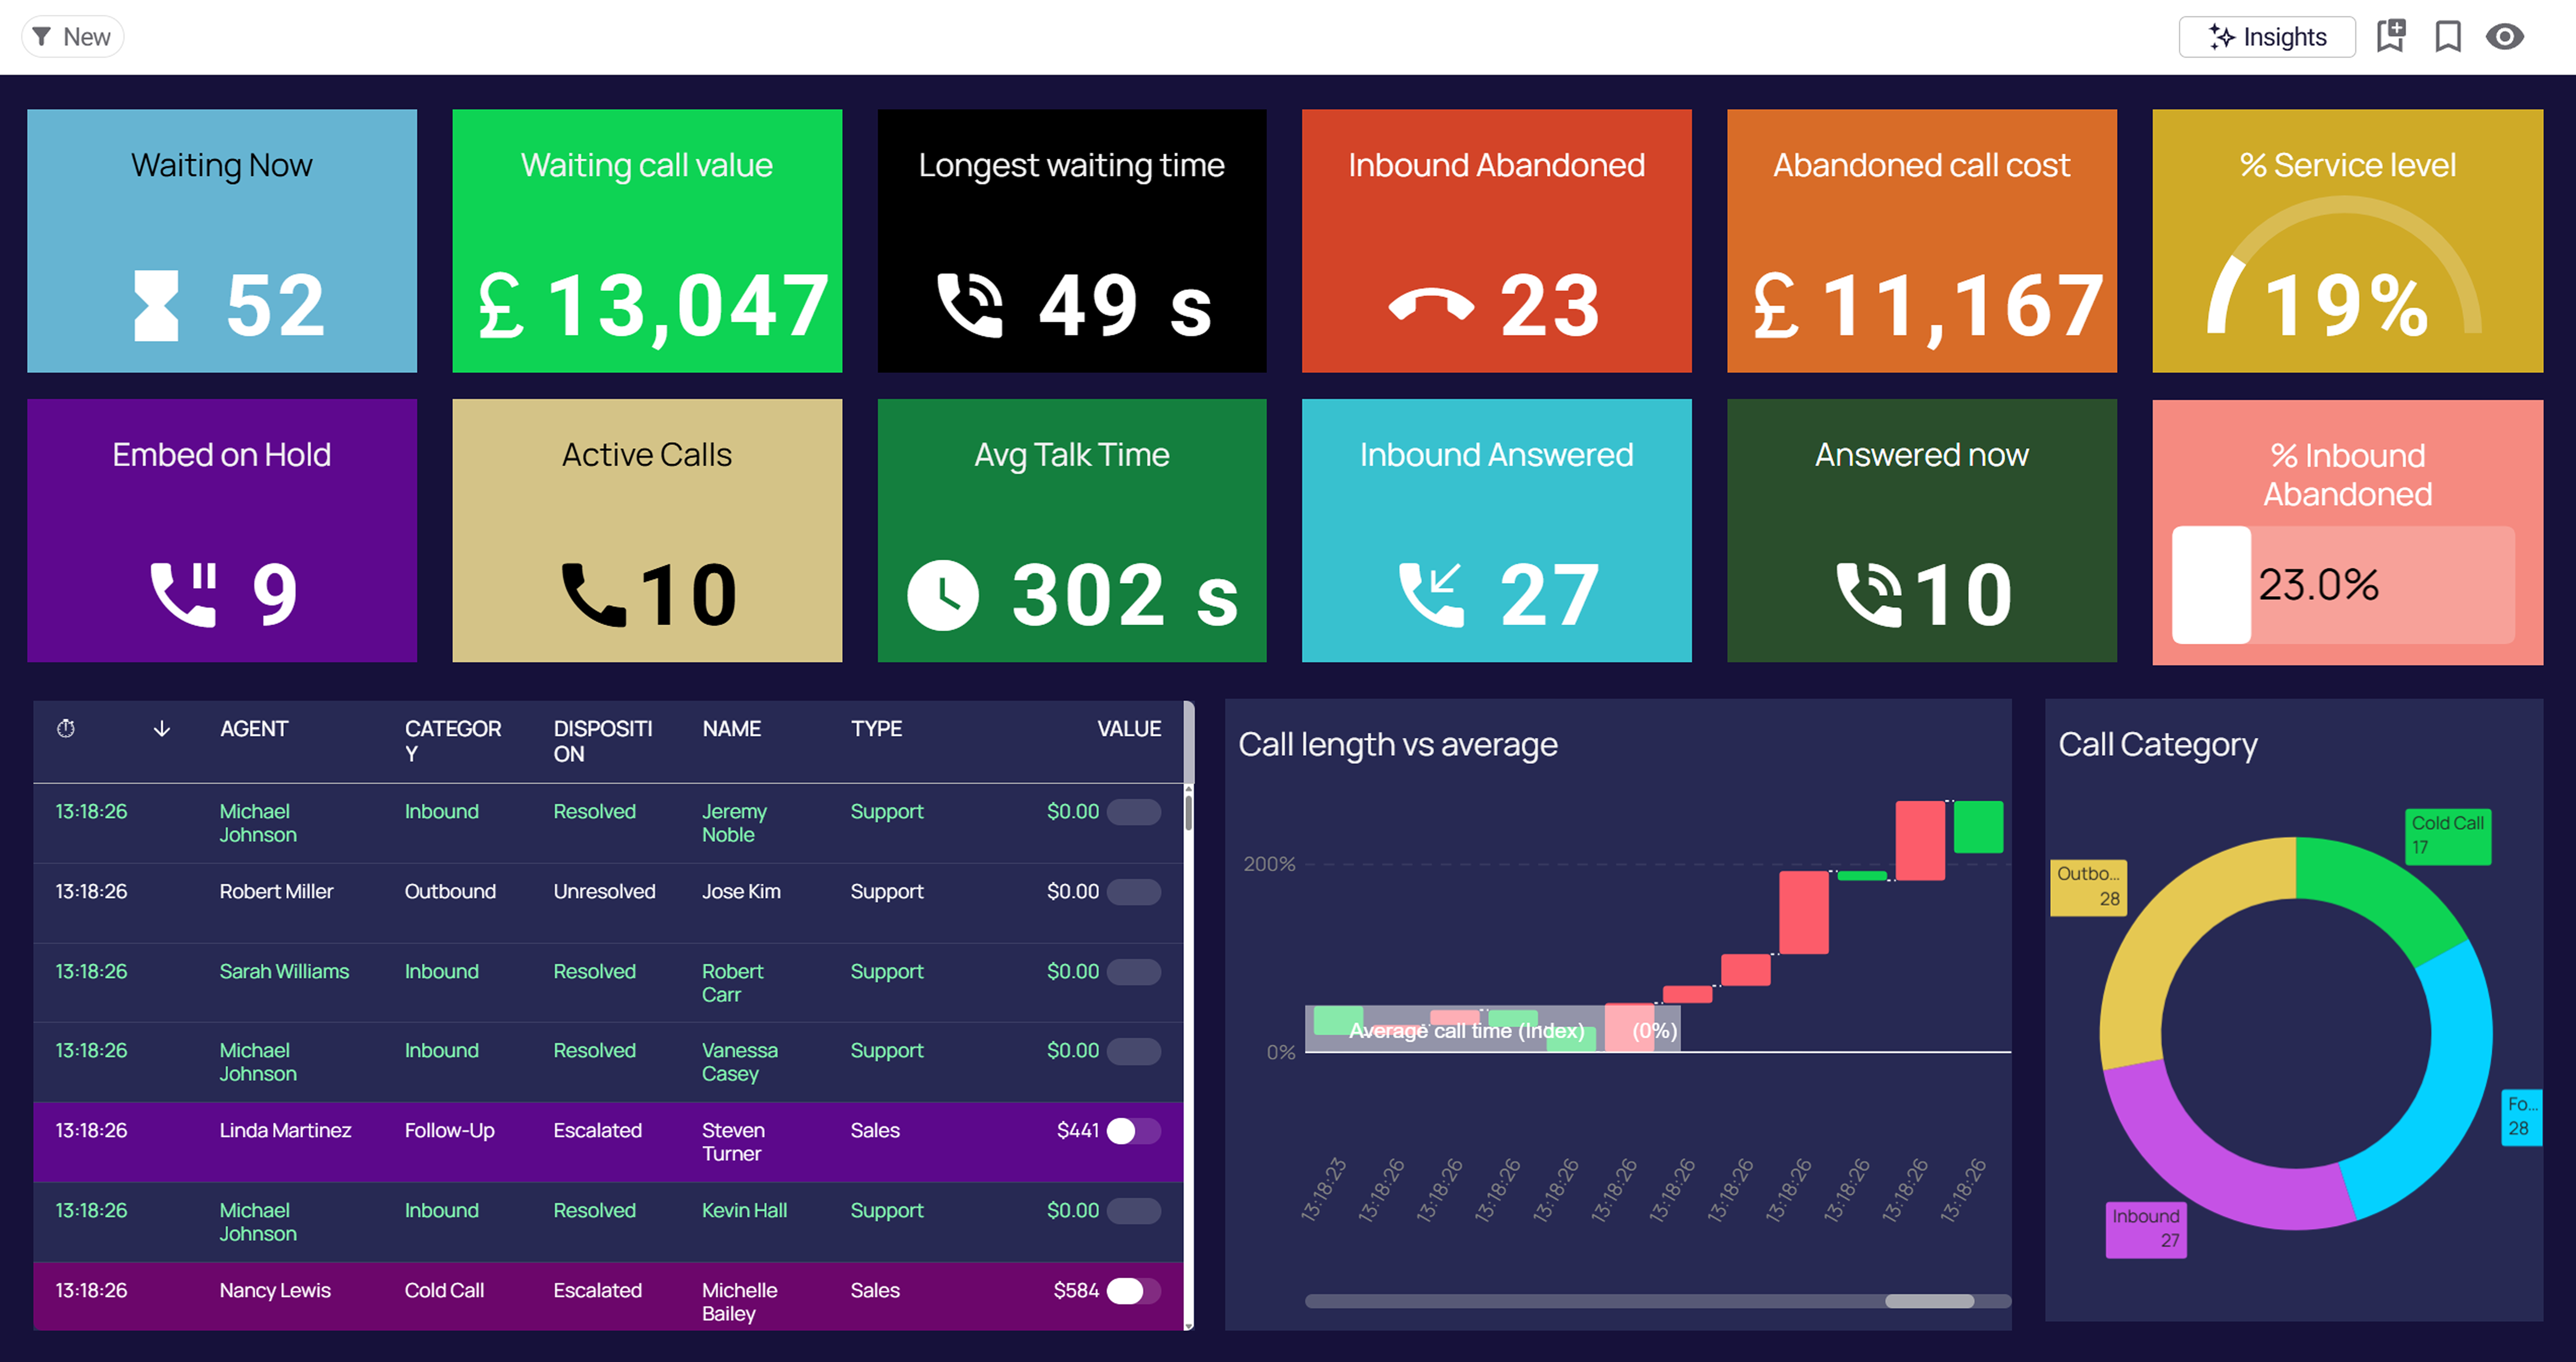
- Call Centre Wallboard: A real-time wallboard tracking agent performance, call metrics, and queue management — operational telemetry teams act on as it happens.
Browse more in the gallery’s Operations and Data Workflows categories.
2. Finance & planning data apps
Finance is where data apps replace the most spreadsheets. These combine reporting with the ability to enter, adjust, and distribute — turning business data into something a finance team can act on, not just read.
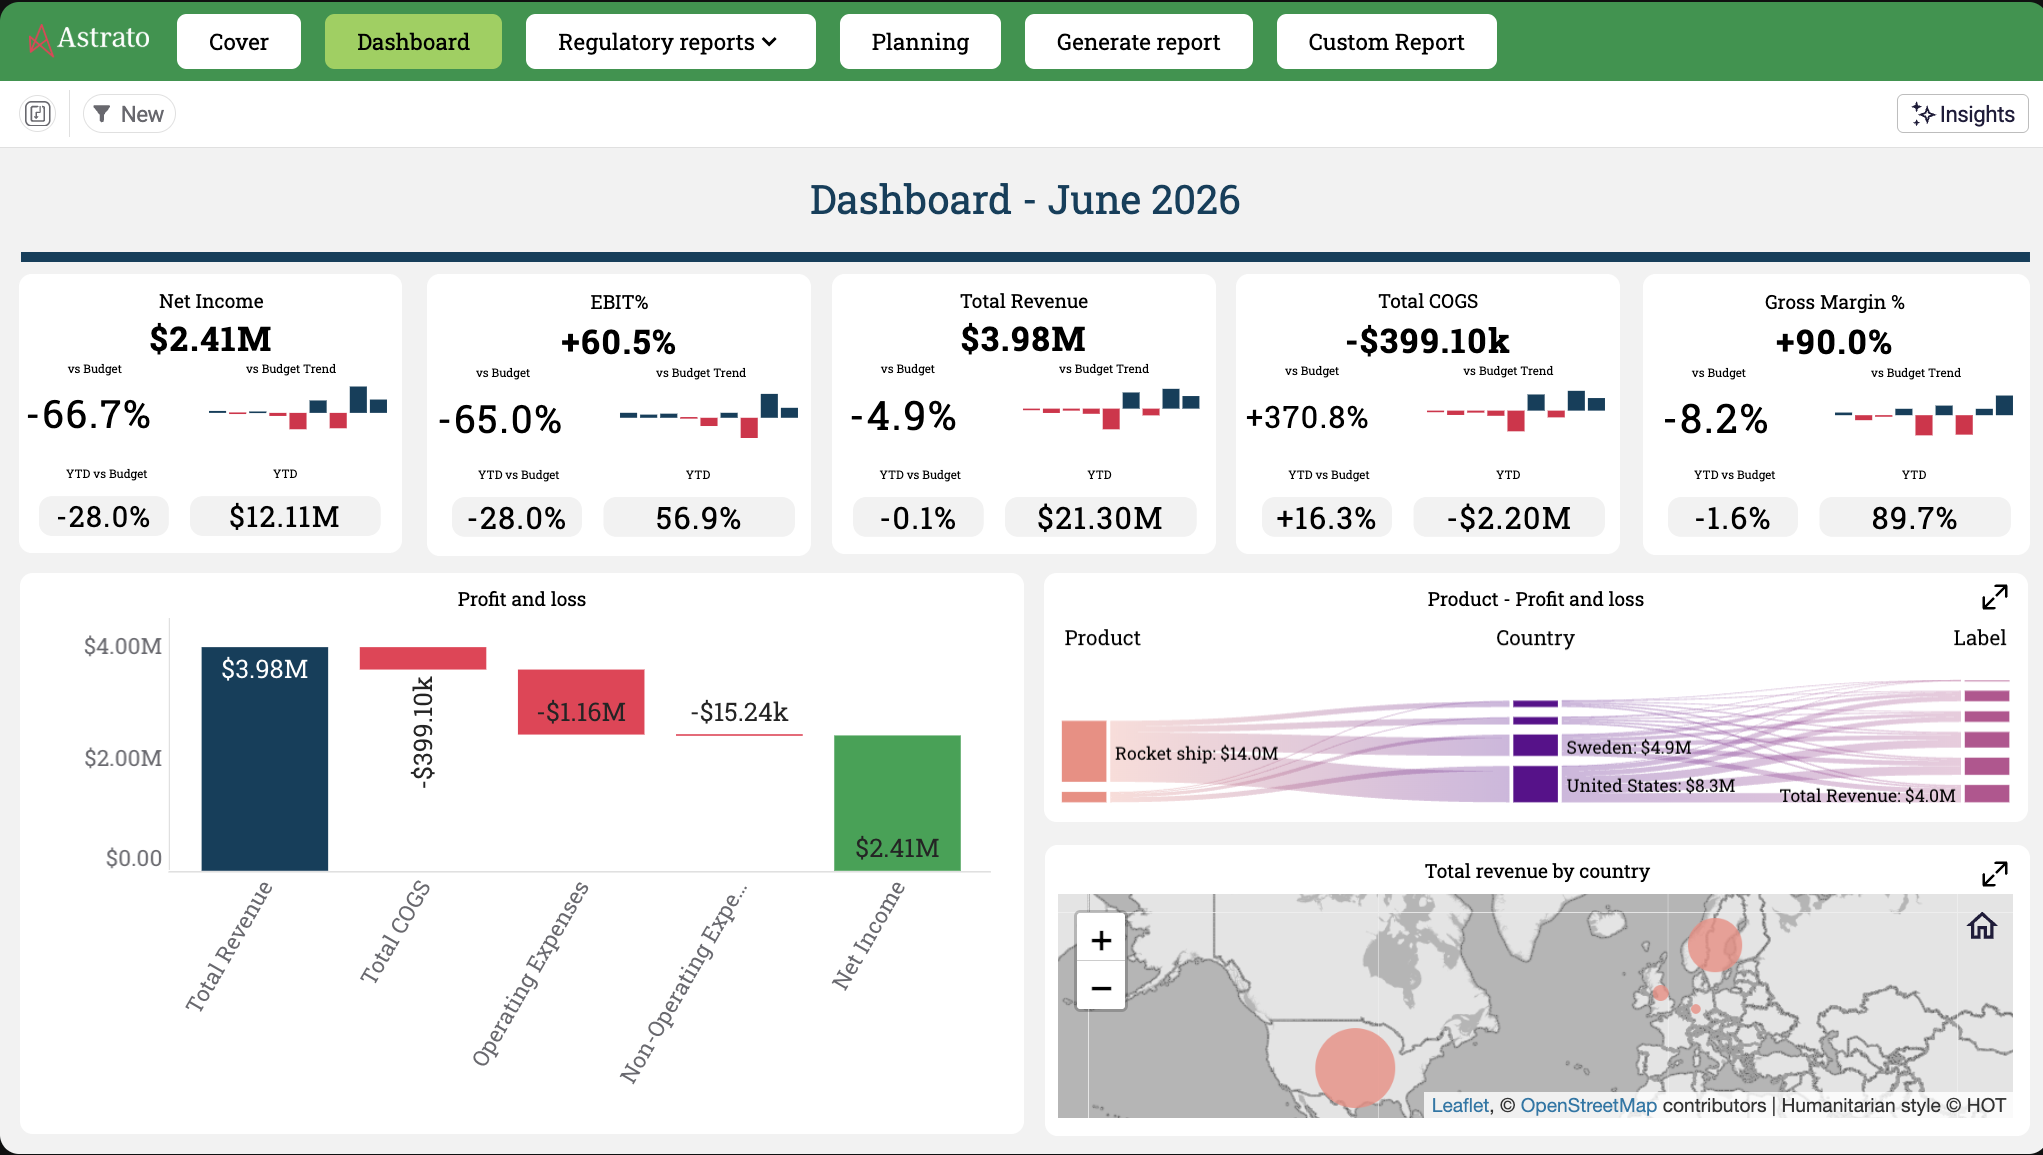
- Financial Profit & Loss: Makes complex financial statements accessible to business users — intuitive P&L analysis on cloud-native, governed data.
- Finance Planning (PDF & Excel Reporting): Create, schedule, and distribute paginated reports and data exports, with AI summaries turning complex data into actionable insight — the reporting workflow, operationalized.
- Advanced Calculations: Business users apply quarter-over-quarter growth, running totals, and period-over-period logic with no SQL — self-service modeling on live numbers.
See the gallery’s Finance category for more.
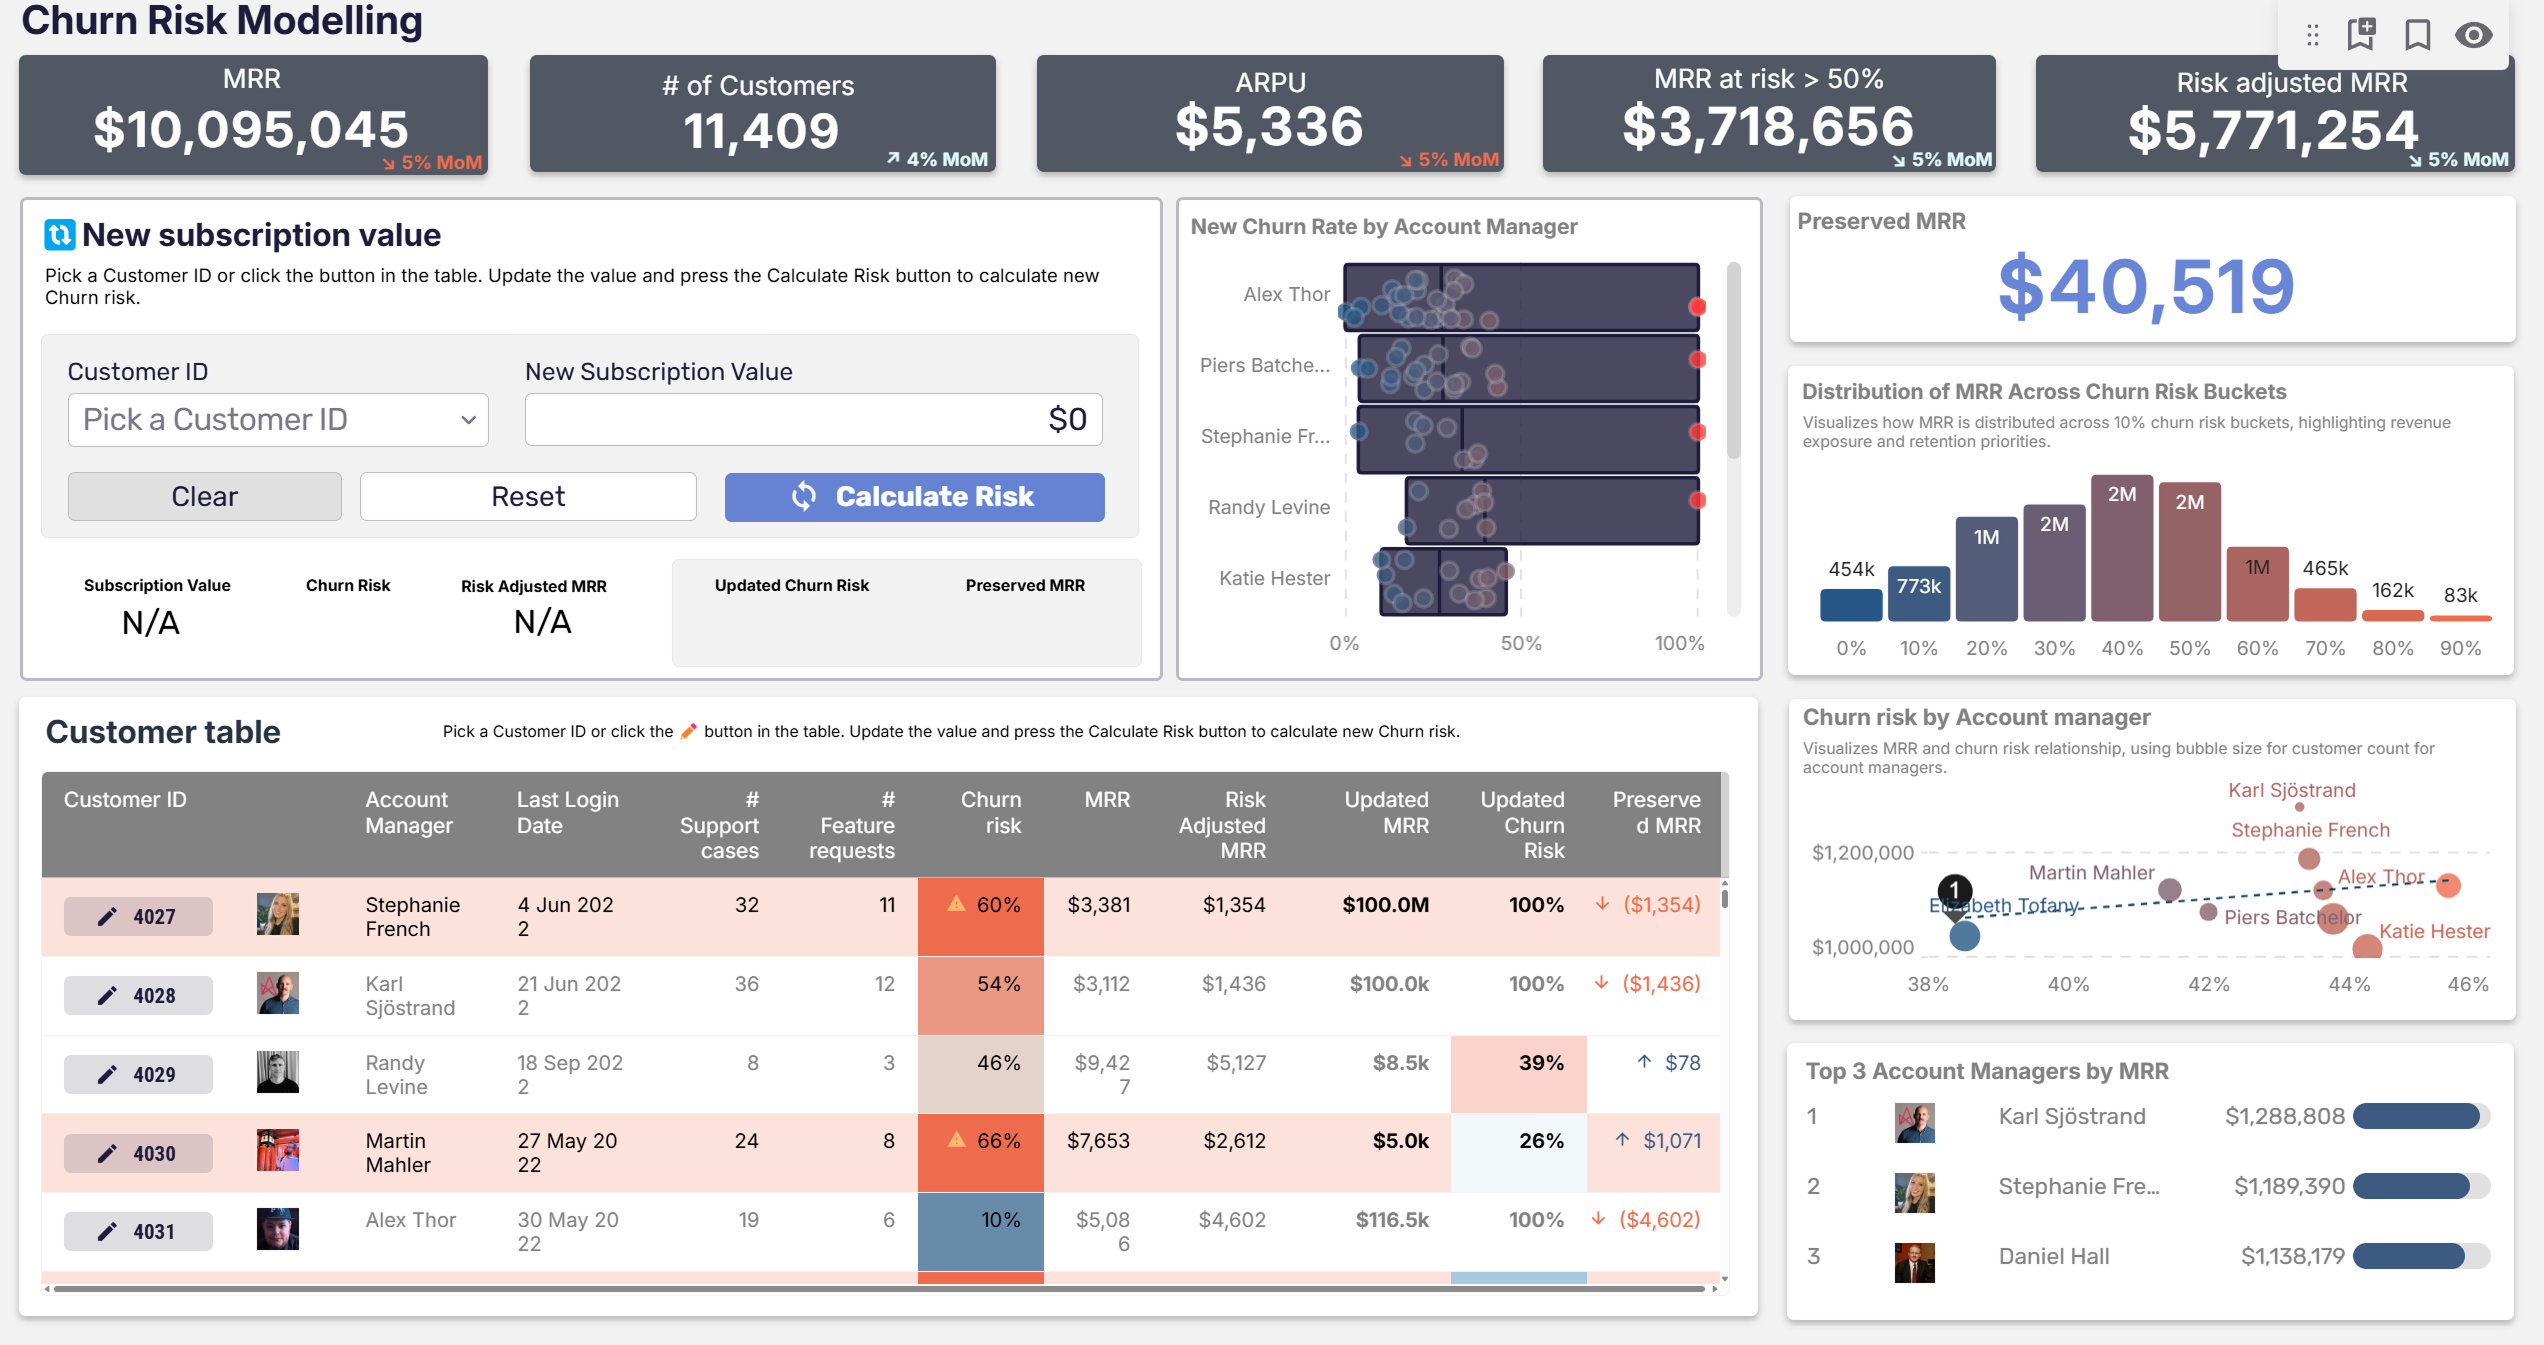
3. Predictive & what-if data apps
This type turns data into predictive output: the user enters a hypothetical and the app runs a model against live data, returning a result in real time. These are some of the most striking examples of data apps, because a read-only dashboard simply can’t do them.
- Price Modeling & Churn Risk: Select a customer, change their monthly recurring revenue, and model their churn risk — no-code modeling that doesn’t need a data scientist’s time, powered by Snowflake and Snowpark.
- Stock Inventory Forecasting: Enter a product category, measure, and time frame; behind the scenes a Snowpark procedure (Prophet) returns an advanced forecast — a model wrapped in a form.
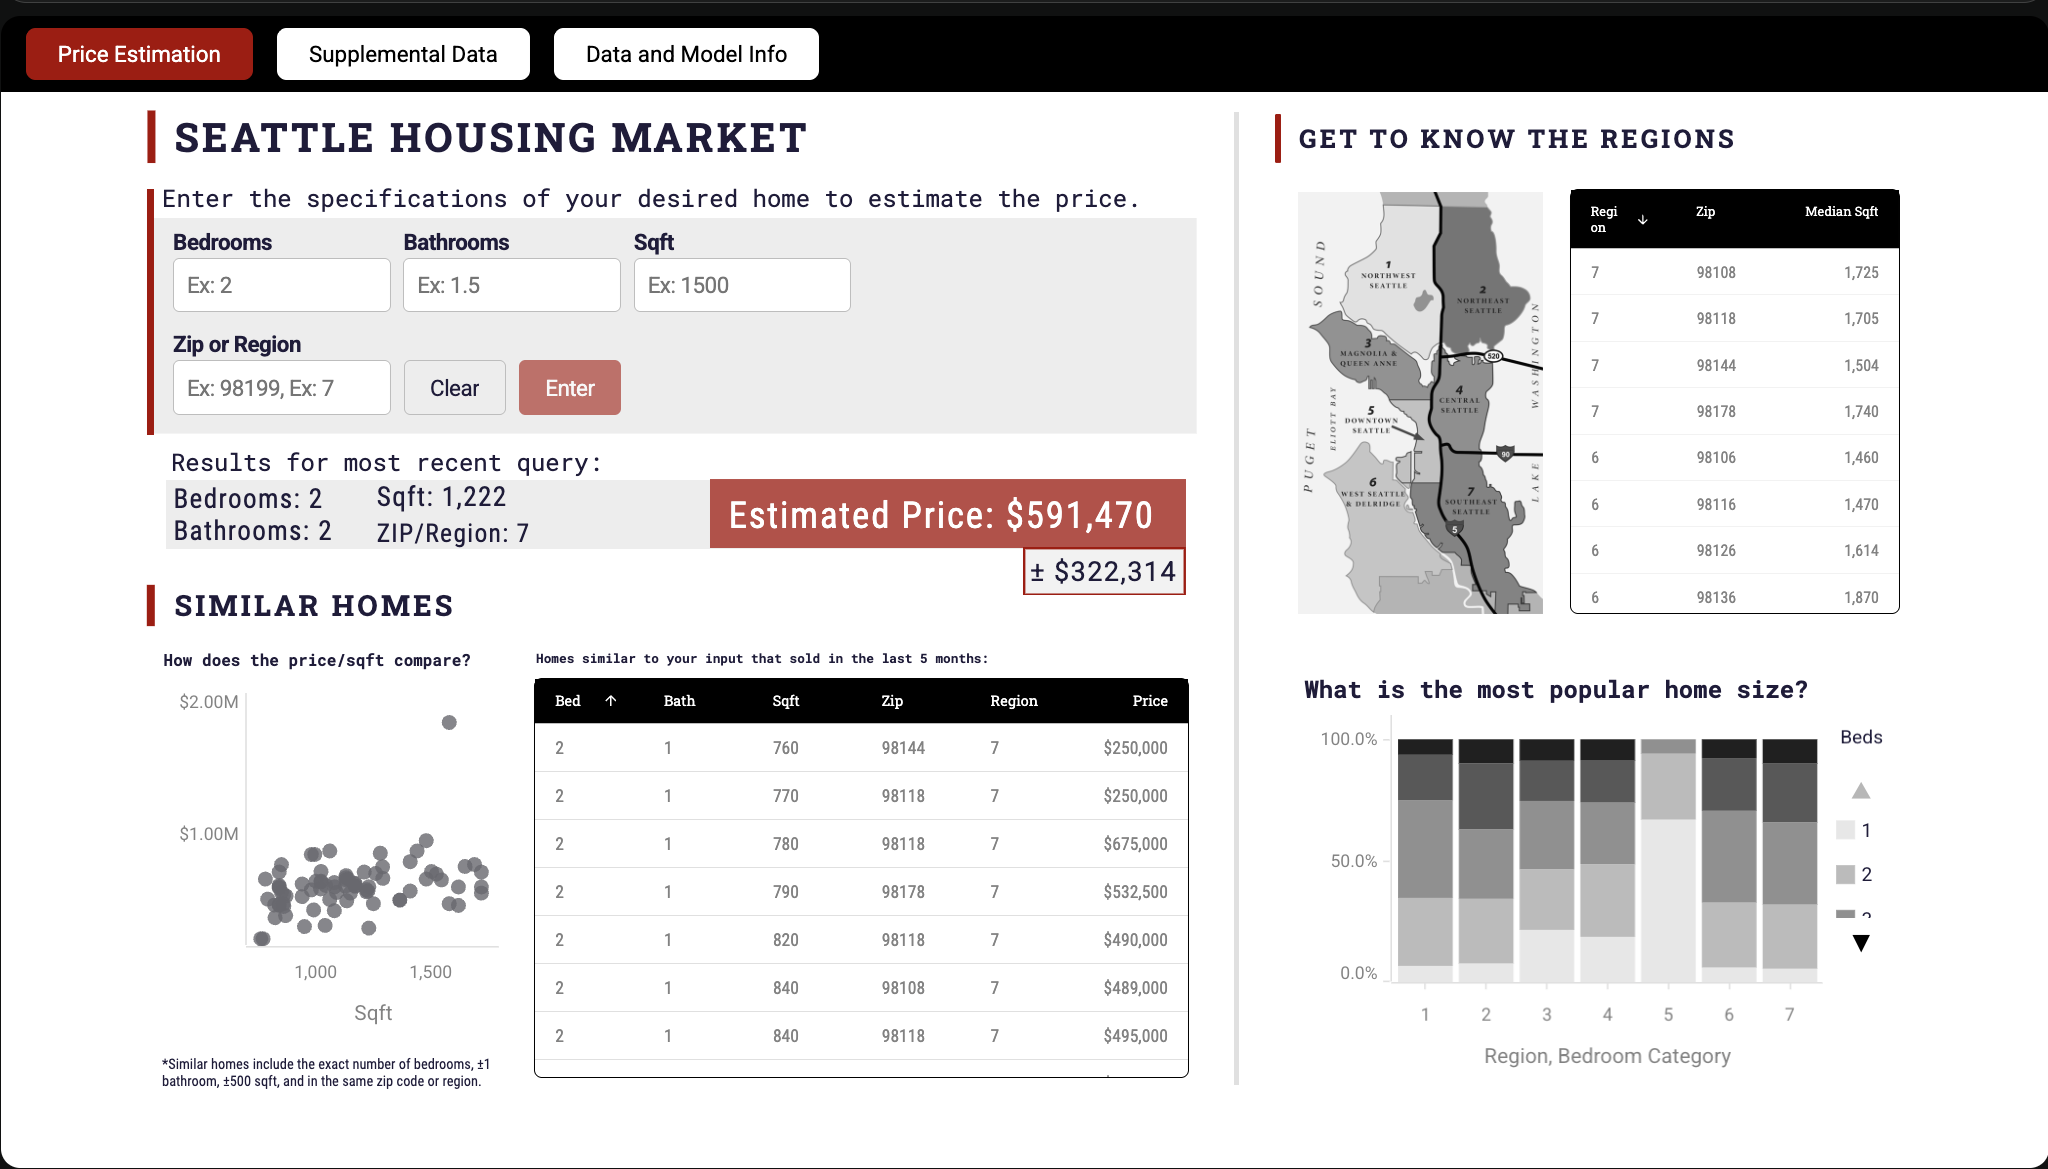
- Seattle Housing Price Estimation: Enter home attributes — bedrooms, bathrooms, square footage, region — and a statistical model predicts the price, then surfaces comparable homes.
- Advertising Spend ROI Optimizer: Runs budget allocations through a regression model to predict ROI across channels — a planning app you act inside.
4. Sales & customer data apps
Pointed at revenue: these help teams act on customer data — prioritizing accounts, spotting high-value segments, steering retail strategy.
- Maventech CRM Sales Performance: A CRM data app visualizing deal sizes, top accounts, and team performance, so reps and leaders can identify high-value opportunities and act on them.
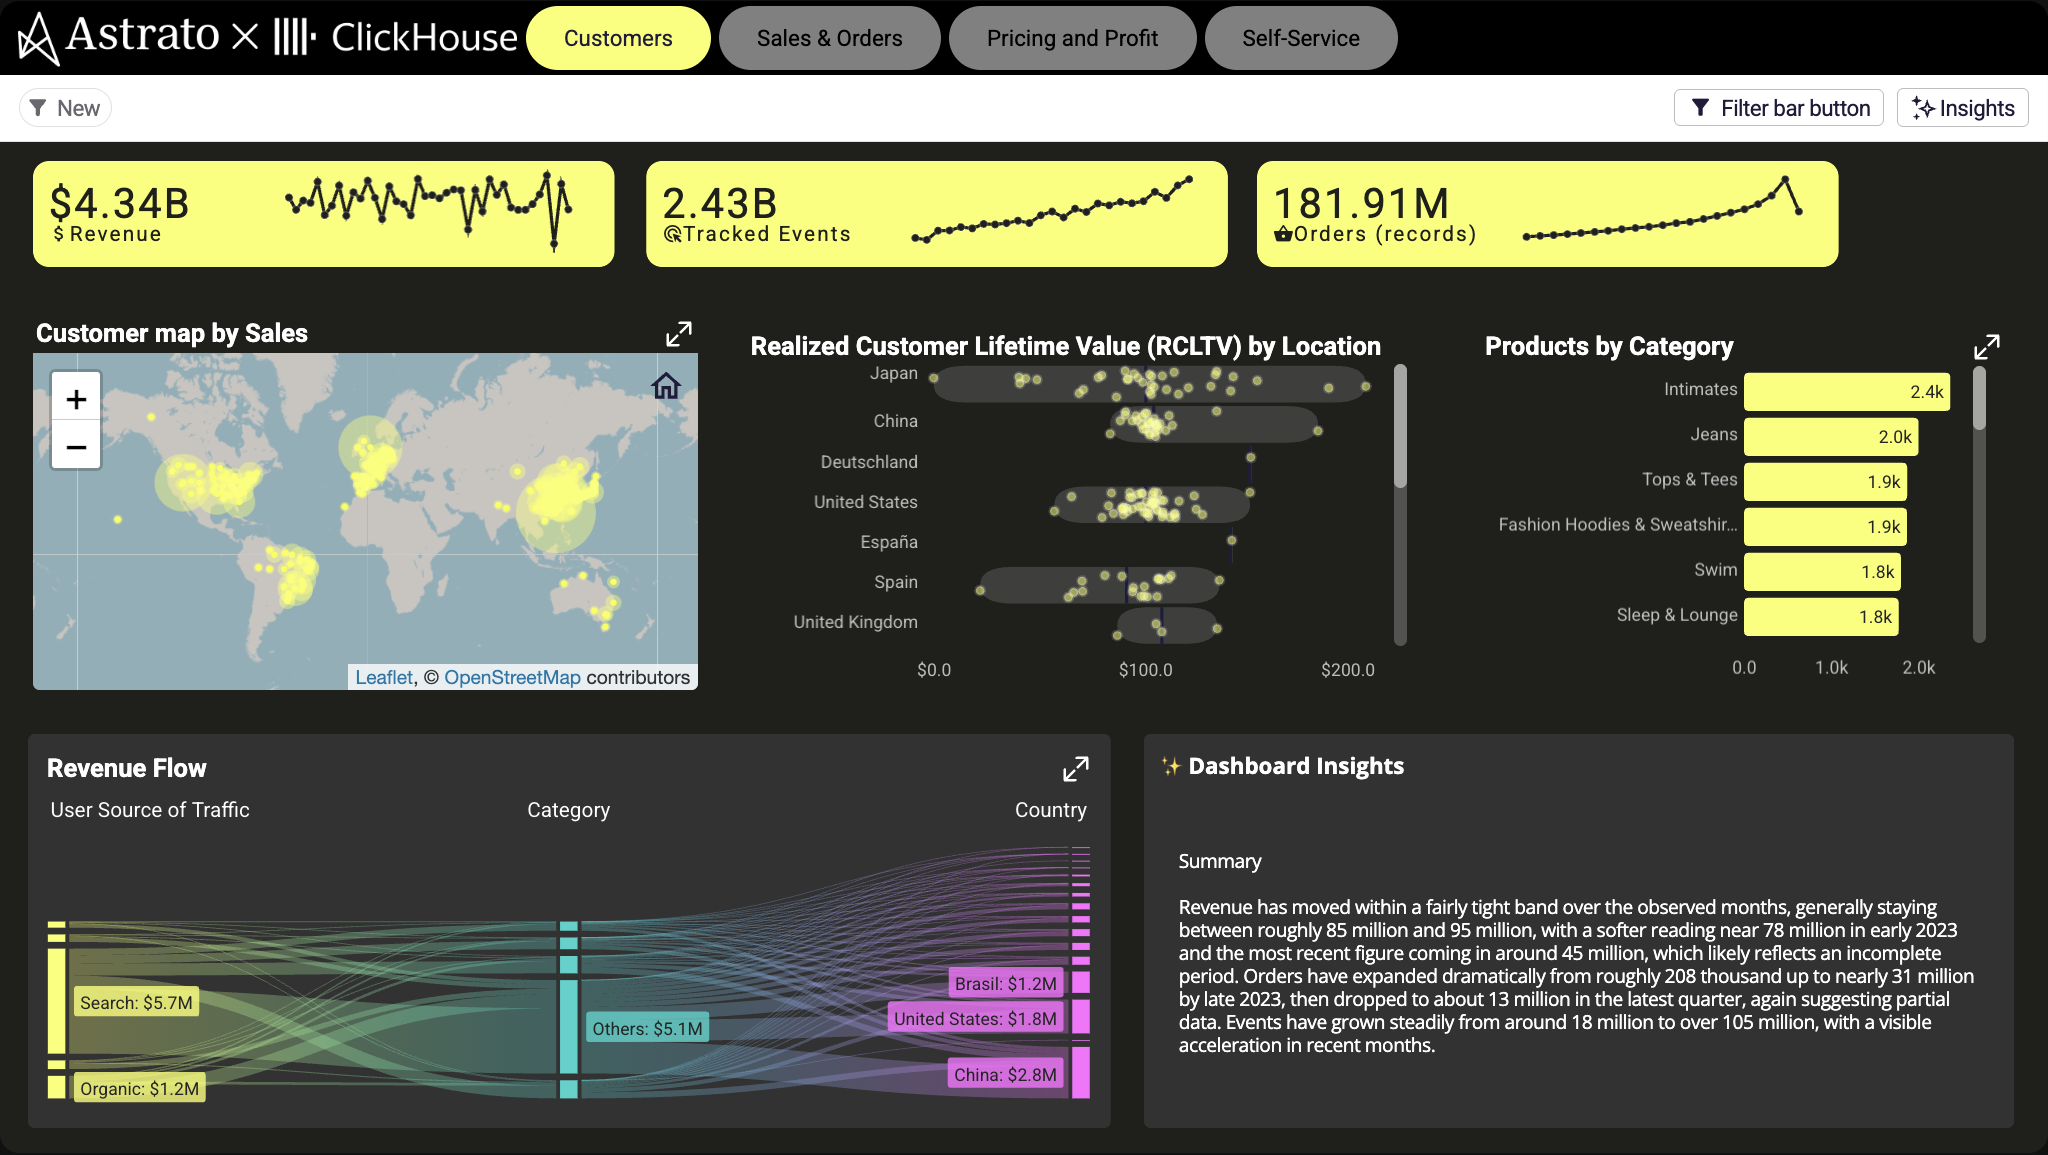
- Retail Insights (ClickHouse): Explore customer, sales, and product performance across global markets with self-service custom reporting on governed data — no IT support required.
- FMCG Sales: A real-time “control center” for sales strategy — data-driven decisions on the fly instead of ad-hoc queries.
More in the gallery’s Sales & Retail category.
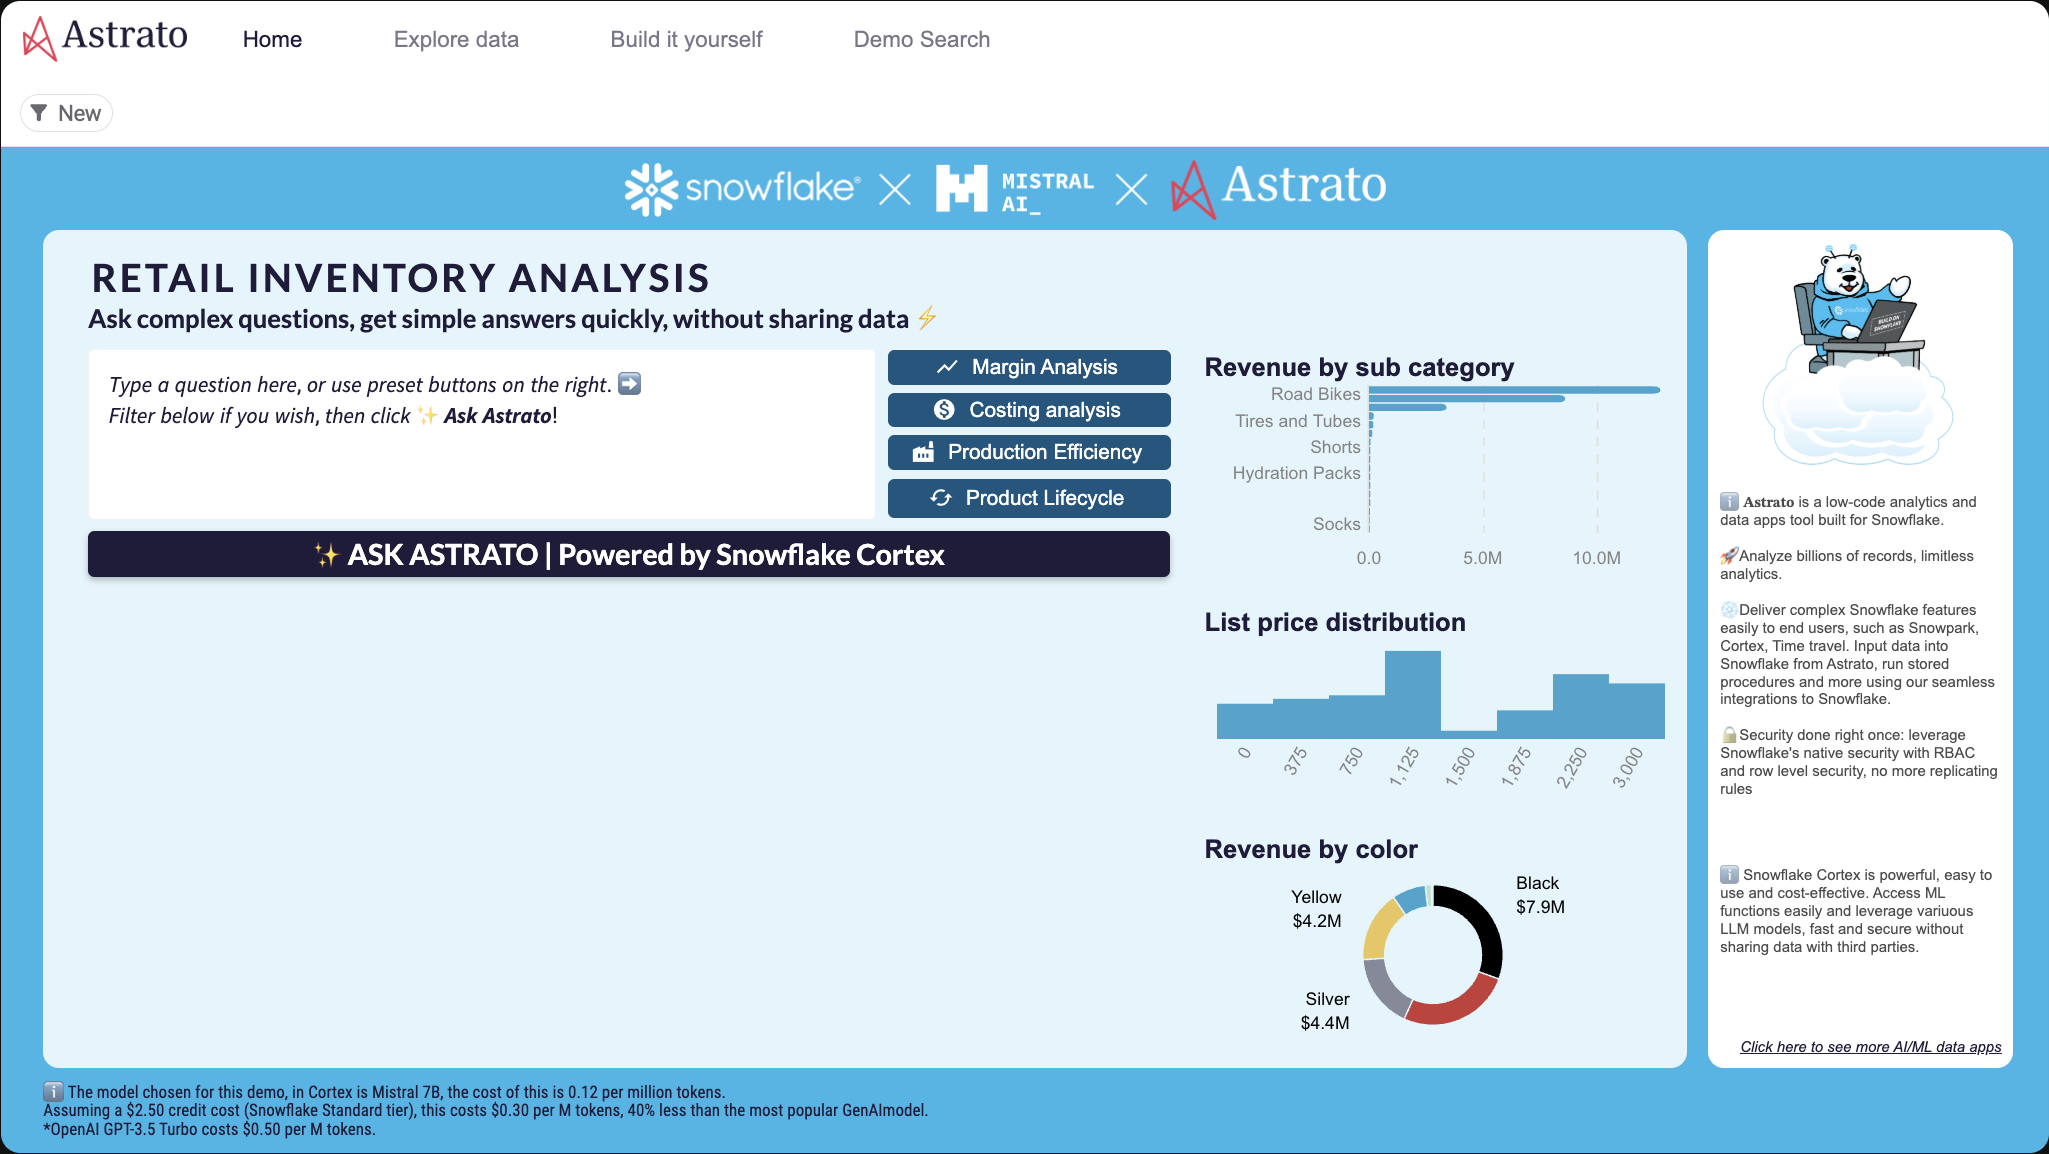
5. AI-powered data apps
A fast-growing type: data apps that put AI directly on governed warehouse data, so business users get insights from data in plain language — or generate new data — without leaving the app.
- Ask Astrato AI (Snowflake Cortex): Ask complex questions and get simple answers fast, with the AI brought to the data rather than the data shipped out.
- AI-Accelerated Employee Feedback (HR): Combines writeback with AI sentiment analysis (Snowflake Cortex) so HR can update data in real time and read drivers and keyword segmentation from feedback.
- Input Form with AI Co-pilot: A form where a GenAI co-pilot helps generate content inline — AI woven into the act of data entry, not bolted on after.
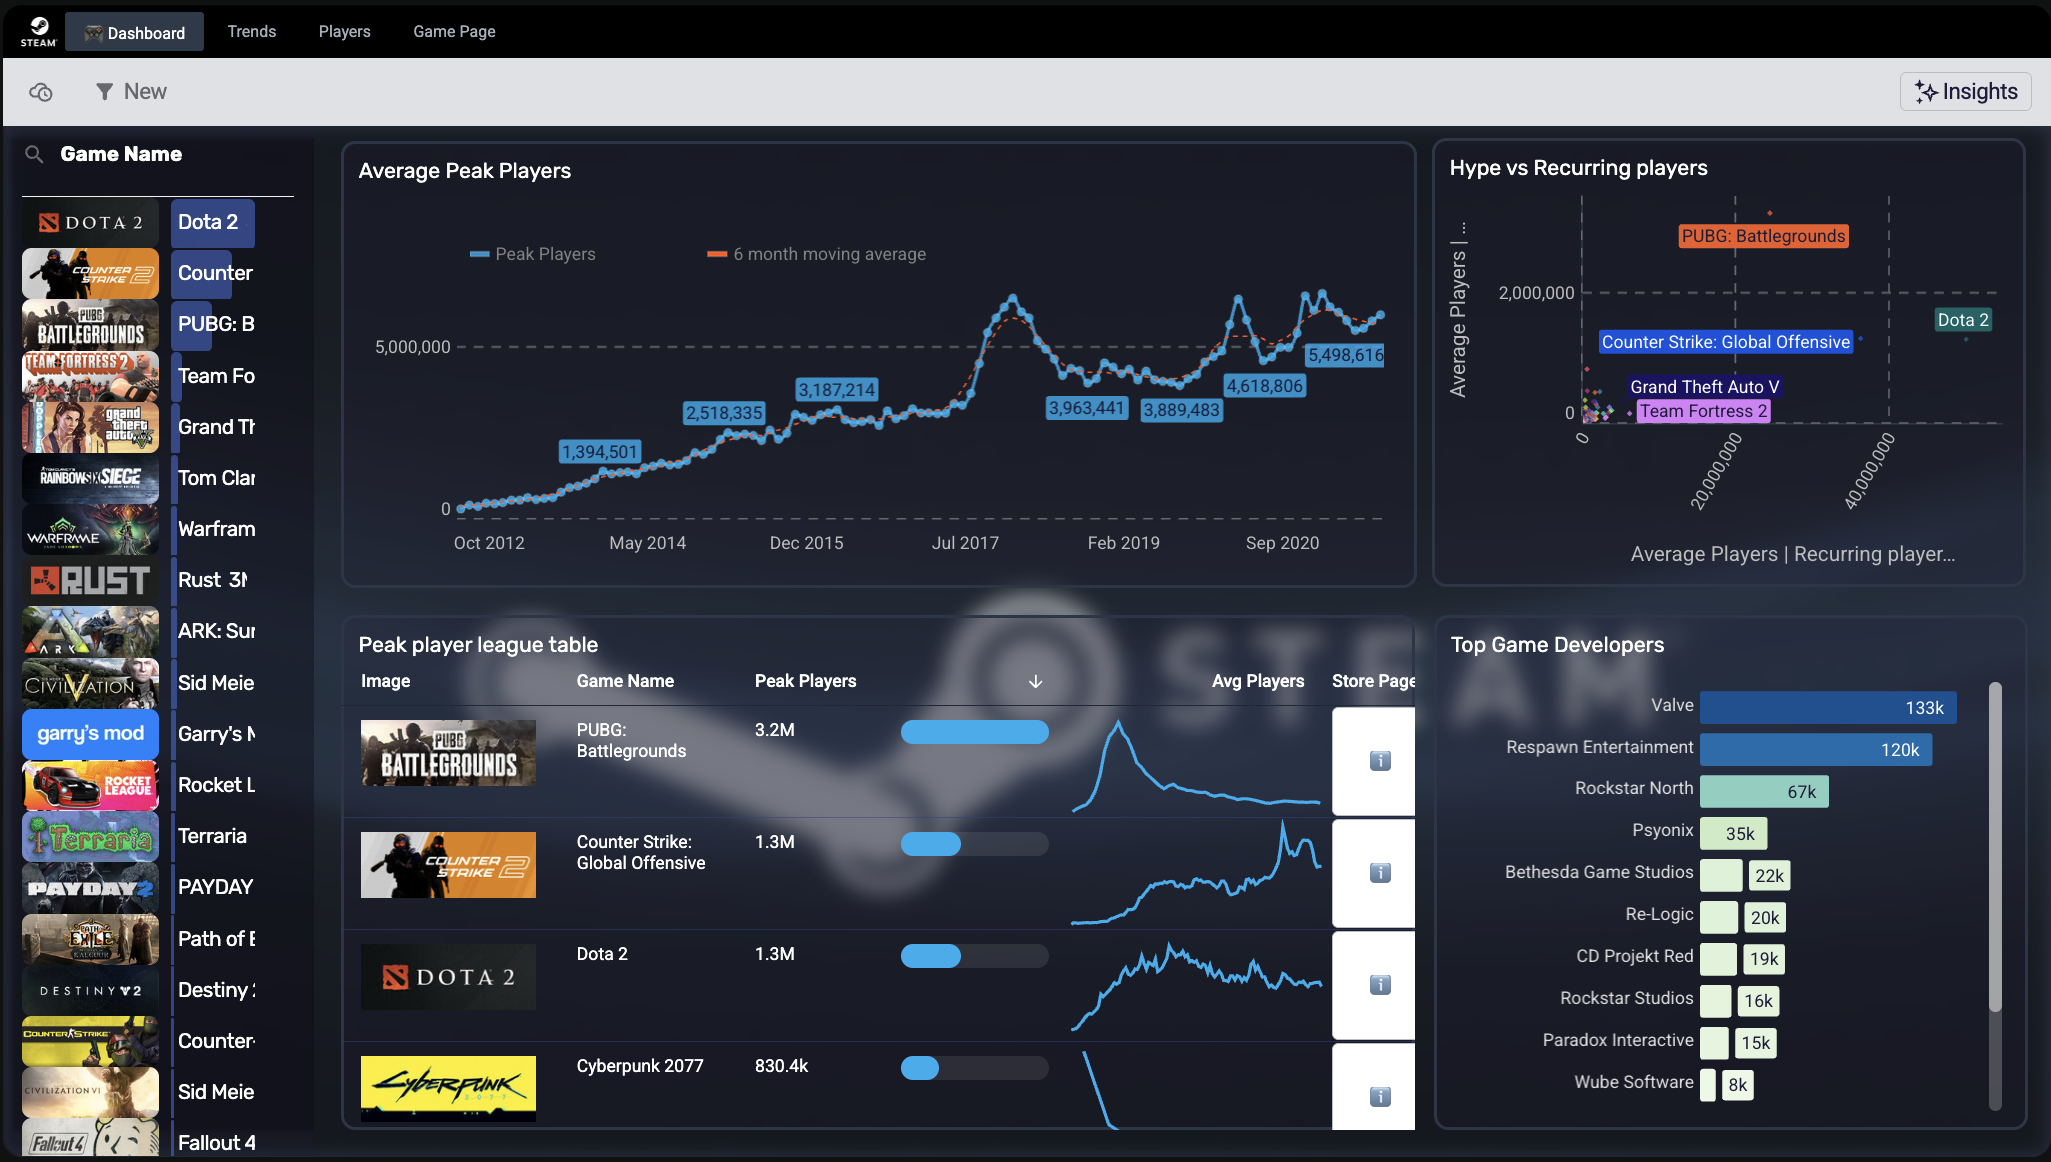
6. Big-data & real-time exploration apps
Because data apps query the warehouse live, they handle large volumes of data that would break an extract-based tool. These examples show interactive data exploration at serious scale, on live data.
- PepsiCo Sales Overview — 6 billion+ rows: Drill into sales performance across multiple dimensions on a massive dataset, with real-time updates from Snowflake and no extracts.
- 108M Rows of Logs & IoT Data (ClickHouse): Explore millions of rows of raw machine metrics — CPU, memory, network — with fast filtering on dense time-series data.
- Steam Games: Player Trends: A live-query app delivering immediate insight as the underlying data updates — real-time exploration, no refresh wait.
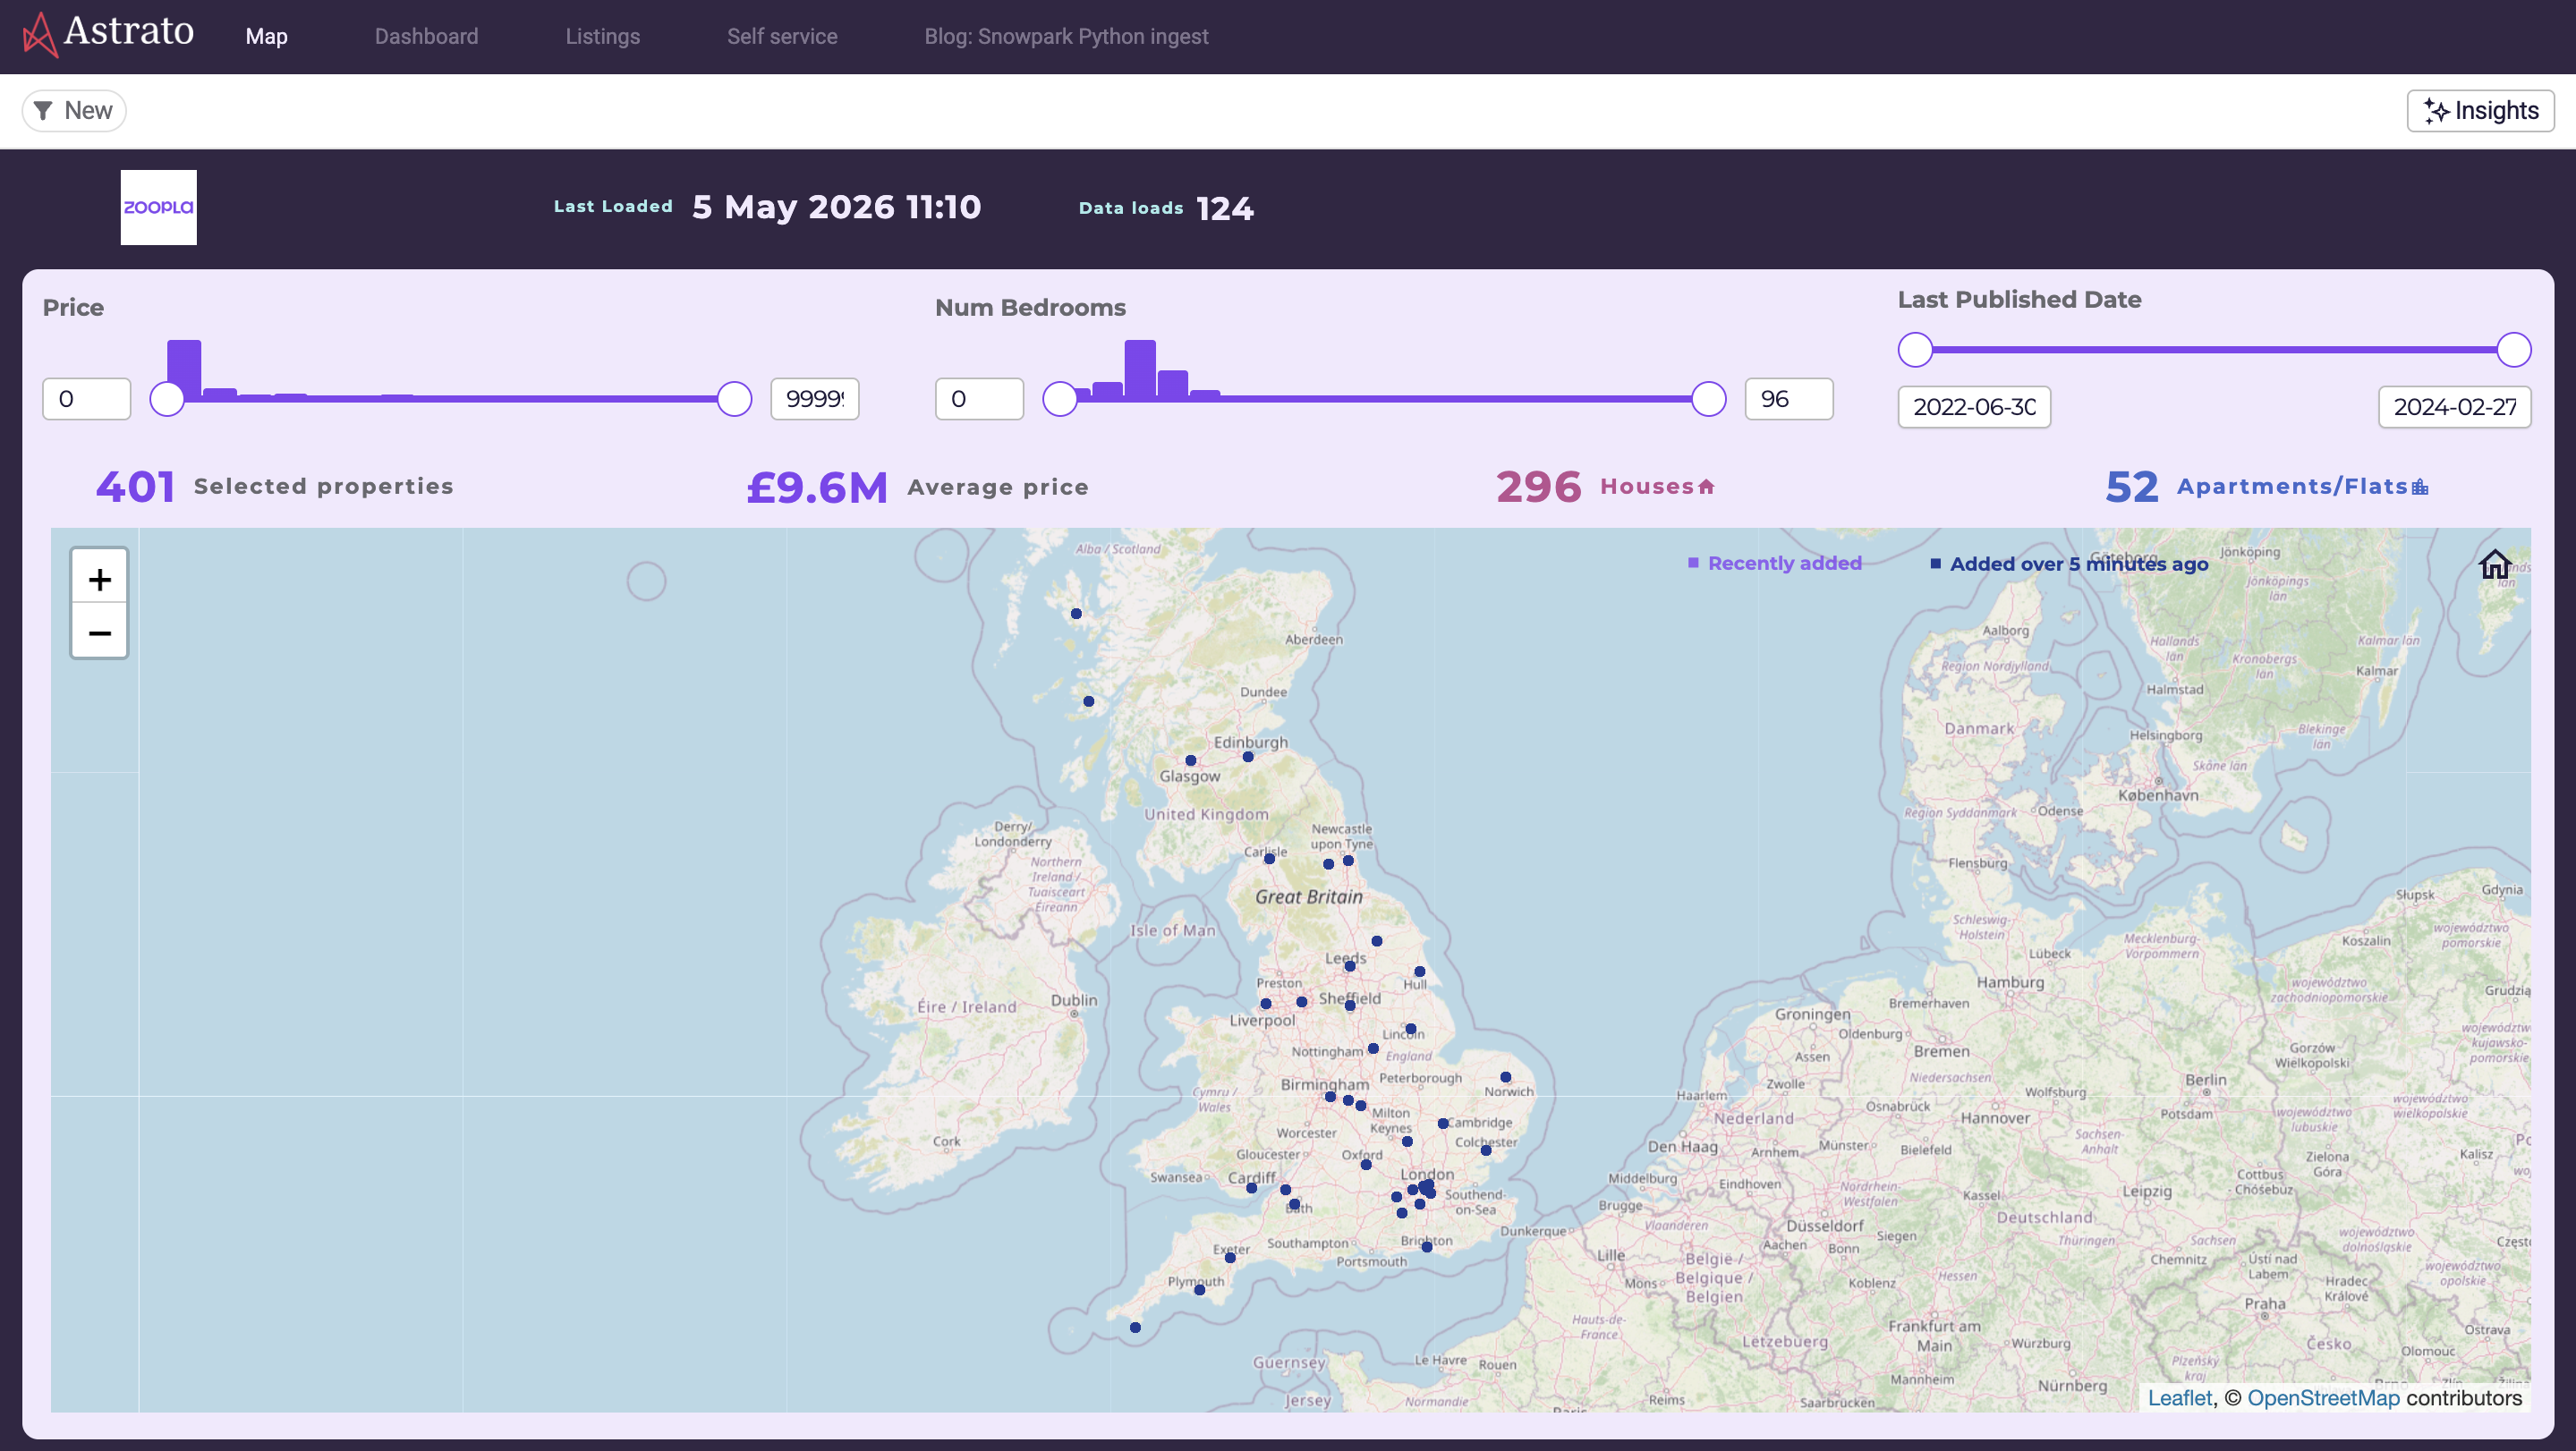
7. Data-ingest & admin data apps
A more technical but increasingly common type: apps that combine data from external data sources, pull new data into the warehouse on demand, or help teams manage their own platform.
- Data Ingest with Astrato & Snowflake (UK Property): Reads directly from the Zoopla API into Snowflake and visualizes it instantly — data on demand, ingestion and analysis in one app.
- Snowflake Usage & Performance Monitoring: Tracks active users, session lengths, and adoption trends so teams can optimize onboarding and resource allocation — a data app for running your data platform.
- Funnel.io Advertising Channel Template: Brings business-ready marketing data together from many platforms across the customer journey into one explorable app.
How to spot which type you need
A simple way to place your own use case: ask what the user needs to do after they see the data. If they need to run a process, it’s operational.
If they need to plan or report, it’s finance/planning. If they need to test a hypothetical, it’s predictive.
If they need to ask a question in plain language, it’s AI-powered. Most real apps blend two or three — a finance app with a forecast, a sales app with an AI summary — which is exactly why a single data app platform that does all of it beats stitching point tools together.
Key takeaways
- The clearest way to learn what data apps do is by example — each one lets a user act on data, not just view it.
- The main types: operational/workflow, finance/planning, predictive/what-if, sales/customer, AI-powered, big-data/real-time, and data-ingest/admin.
- What unites them: live query on the warehouse, interactivity that changes something, and writeback under governance.
- To place your own use case, ask what the user must DO after seeing the data — that points to the type.
- Most real data apps blend types, which is why one platform that does all of them beats stitching tools together.
Frequently asked questions
What are some examples of data apps?
Common examples include operational apps (issue trackers, logistics steering), finance and planning apps (P&L, paginated reporting), predictive what-if apps (churn modeling, forecasting, price estimation), sales and CRM apps, AI-powered apps that answer questions or summarize feedback, and big-data exploration apps running on billions of live rows. Each lets a user act on data, not just view it.
What are the main types of data apps?
Seven recur in practice: operational/workflow, finance/planning, predictive/what-if, sales/customer, AI-powered, big-data/real-time exploration, and data-ingest/admin. Most real apps combine two or three — for example, a finance app with a built-in forecast.
What is the difference between a data app and a dashboard?
A dashboard is read-only — you view and filter. A data app is read-and-write — you view, and also act: submit inputs, run a model, write a value back to the warehouse. In short, a dashboard shows data; a data app lets you do something with it.
Do data apps need a data warehouse?
The strongest ones run directly on a cloud data warehouse — Snowflake, BigQuery, Databricks — so they query live data and write actions back to the same governed source. That live connection is what lets a data app handle large volumes of data and stay current as users act.
Can business users build data apps without code?
Yes — modern data app platforms use drag-and-drop building and no-code actions, so business users can assemble forms, workflows, and even model inputs without SQL or a data scientist. Several examples above (churn modeling, advanced calculations) are explicitly no-code.
Where can I see interactive data app examples?
Astrato's demo gallery has dozens of live, interactive data apps grouped by category — finance, sales, operations, healthcare, and more — that you can open and click through yourself, then add to your own workspace.
Explore these data apps yourself
Every example above is live in the Astrato demo gallery — open, click through, and add any of them to your own workspace. Astrato is the warehouse-native BI platform for building interactive data apps on Snowflake, BigQuery, and Databricks, no code required.
Browse the gallery or book a demo to see how fast you can build your own.
Ready to experience next-gen analytics?
See how Astrato runs natively in your warehouse.