Your Dashboard Number Is Wrong. Here's How to Find Where It Broke.
A wrong number on the dashboard? Trace it back layer by layer — presentation, semantic, pipeline, source — so the next one takes minutes.

Last week a client told me they’d received a message saying: "the revenue number on the exec dashboard looks off, can someone check?" Four people spent the rest of the afternoon in a Slack thread trying to figure out whose problem it was.
That's the actual failure. Not that the number was wrong, numbers are wrong sometimes, pipelines are complicated but that nobody in the thread could say, with any confidence, which layer broke it. Was it the chart? The metric definition? A job that ran on a half-built table at 4am? Nobody knew, so everybody started guessing, and guessing is what turns a five-minute fix into an afternoon.
This is a walkthrough of how to trace a wrong number back to its origin, layer by layer, and what has to be true upstream so the next one takes minutes instead of an afternoon.
The trust boundary nobody owns
Most data organisations split ownership somewhere around the warehouse wall. The platform team owns the pipeline: ingestion, transformation, orchestration, the stuff that runs at 3am with no audience. The BI or analytics team owns the dashboard: the thing the VP actually looks at.
Both teams can be doing their jobs well and the number can still be wrong, because the handoff between them belongs to nobody. The pipeline team's definition of "done" is the table landing. The BI team's definition of "correct" is the chart rendering. Neither of those is the same as "the number is right," and the gap between them is exactly where trust quietly dies.
This isn't a tooling problem in the sense of needing a better dashboard. It's a governance gap, a boundary where lineage, ownership and definitions stop being anyone's explicit responsibility and start being tribal knowledge held by whoever's been there longest.
Start at the end, not the beginning
The instinct when a number looks wrong is to start guessing at the pipeline: rerun a job, check yesterday's load, ping the data engineer. That's usually the slow path, because you're searching a large space with no prioritisation.
The faster path runs backwards from the number itself. First, reproduce it. Then define "wrong" precisely, because the symptom tells you which layer to look at:
- Stale — the number hasn't moved when it should have. Look at freshness, not logic.
- Miscalculated — the number moves, but the math looks off. Look at the metric definition.
- Filtered — the number is plausible but doesn't match a related view. Look at the presentation layer.
- Double-counted — the number is too high, often by a suspiciously round multiple. Look for a join fan-out.
Precision here saves an afternoon. "The number is wrong" sends four people in four directions. "The number is 40% too high and moved yesterday" sends one person to the right layer.
Layer 1 — the presentation layer
Start here because it's the fastest to check and the easiest to rule out. Is the chart lying about data that's actually fine underneath?
Check the filters and date range first. the single most common cause of "wrong" numbers is a dashboard quietly filtering on the wrong period after a copy-paste edit. Then check aggregation: is this dashboard summing what another dashboard averages? Then check for join fan-out, where a one-to-many join silently multiplies rows and inflates a sum without anyone touching the underlying data.
The tell that it isn't a presentation-layer problem: the same number is wrong in two independent tools. If two dashboards built by different people, querying independently, both show the same wrong figure, the problem is upstream of both of them. That single check rules out an entire layer in under a minute.
Layer 2 — the semantic or model layer
If the presentation layer is clean, the next question is whether the definition itself is wrong, or was recently changed underneath you.
This is a dbt model problem more often than people expect: a metric's logic gets edited for a legitimate reason in one PR, and six weeks later nobody remembers that "active customer" now excludes trial accounts. Or a test has been failing quietly, and because it wasn't blocking, everyone learned to ignore the red icon next to it.
The question that matters here: "who changed this, and when" should be answerable in seconds. If it takes an afternoon of git blame and asking around the team, that's not a data problem, that's a tooling and process problem, and it's fixable independently of whatever's wrong with this particular number.
Layer 3 — the pipeline
This is where the least visibility and the most failure modes live, and it's usually where the real answer is hiding once the first two layers check out clean.
Partial loads. A job that ran before its upstream dependency finished. A dependency that technically "succeeded" but ran against a half-built table because nothing enforced the ordering. A silent retry that quietly reprocessed a partition twice. A schema change three hops upstream that didn't break anything loudly, just changed what a column meant.
This is exactly the layer orchestration and lineage exist for. At Orchestra, this is a problem we wanted to fix: making sure a job can't start until everything it depends on has actually finished and making sure that when something does go wrong, you can trace a number back to its source in a few clicks rather than an archaeological dig through log files and Slack history.
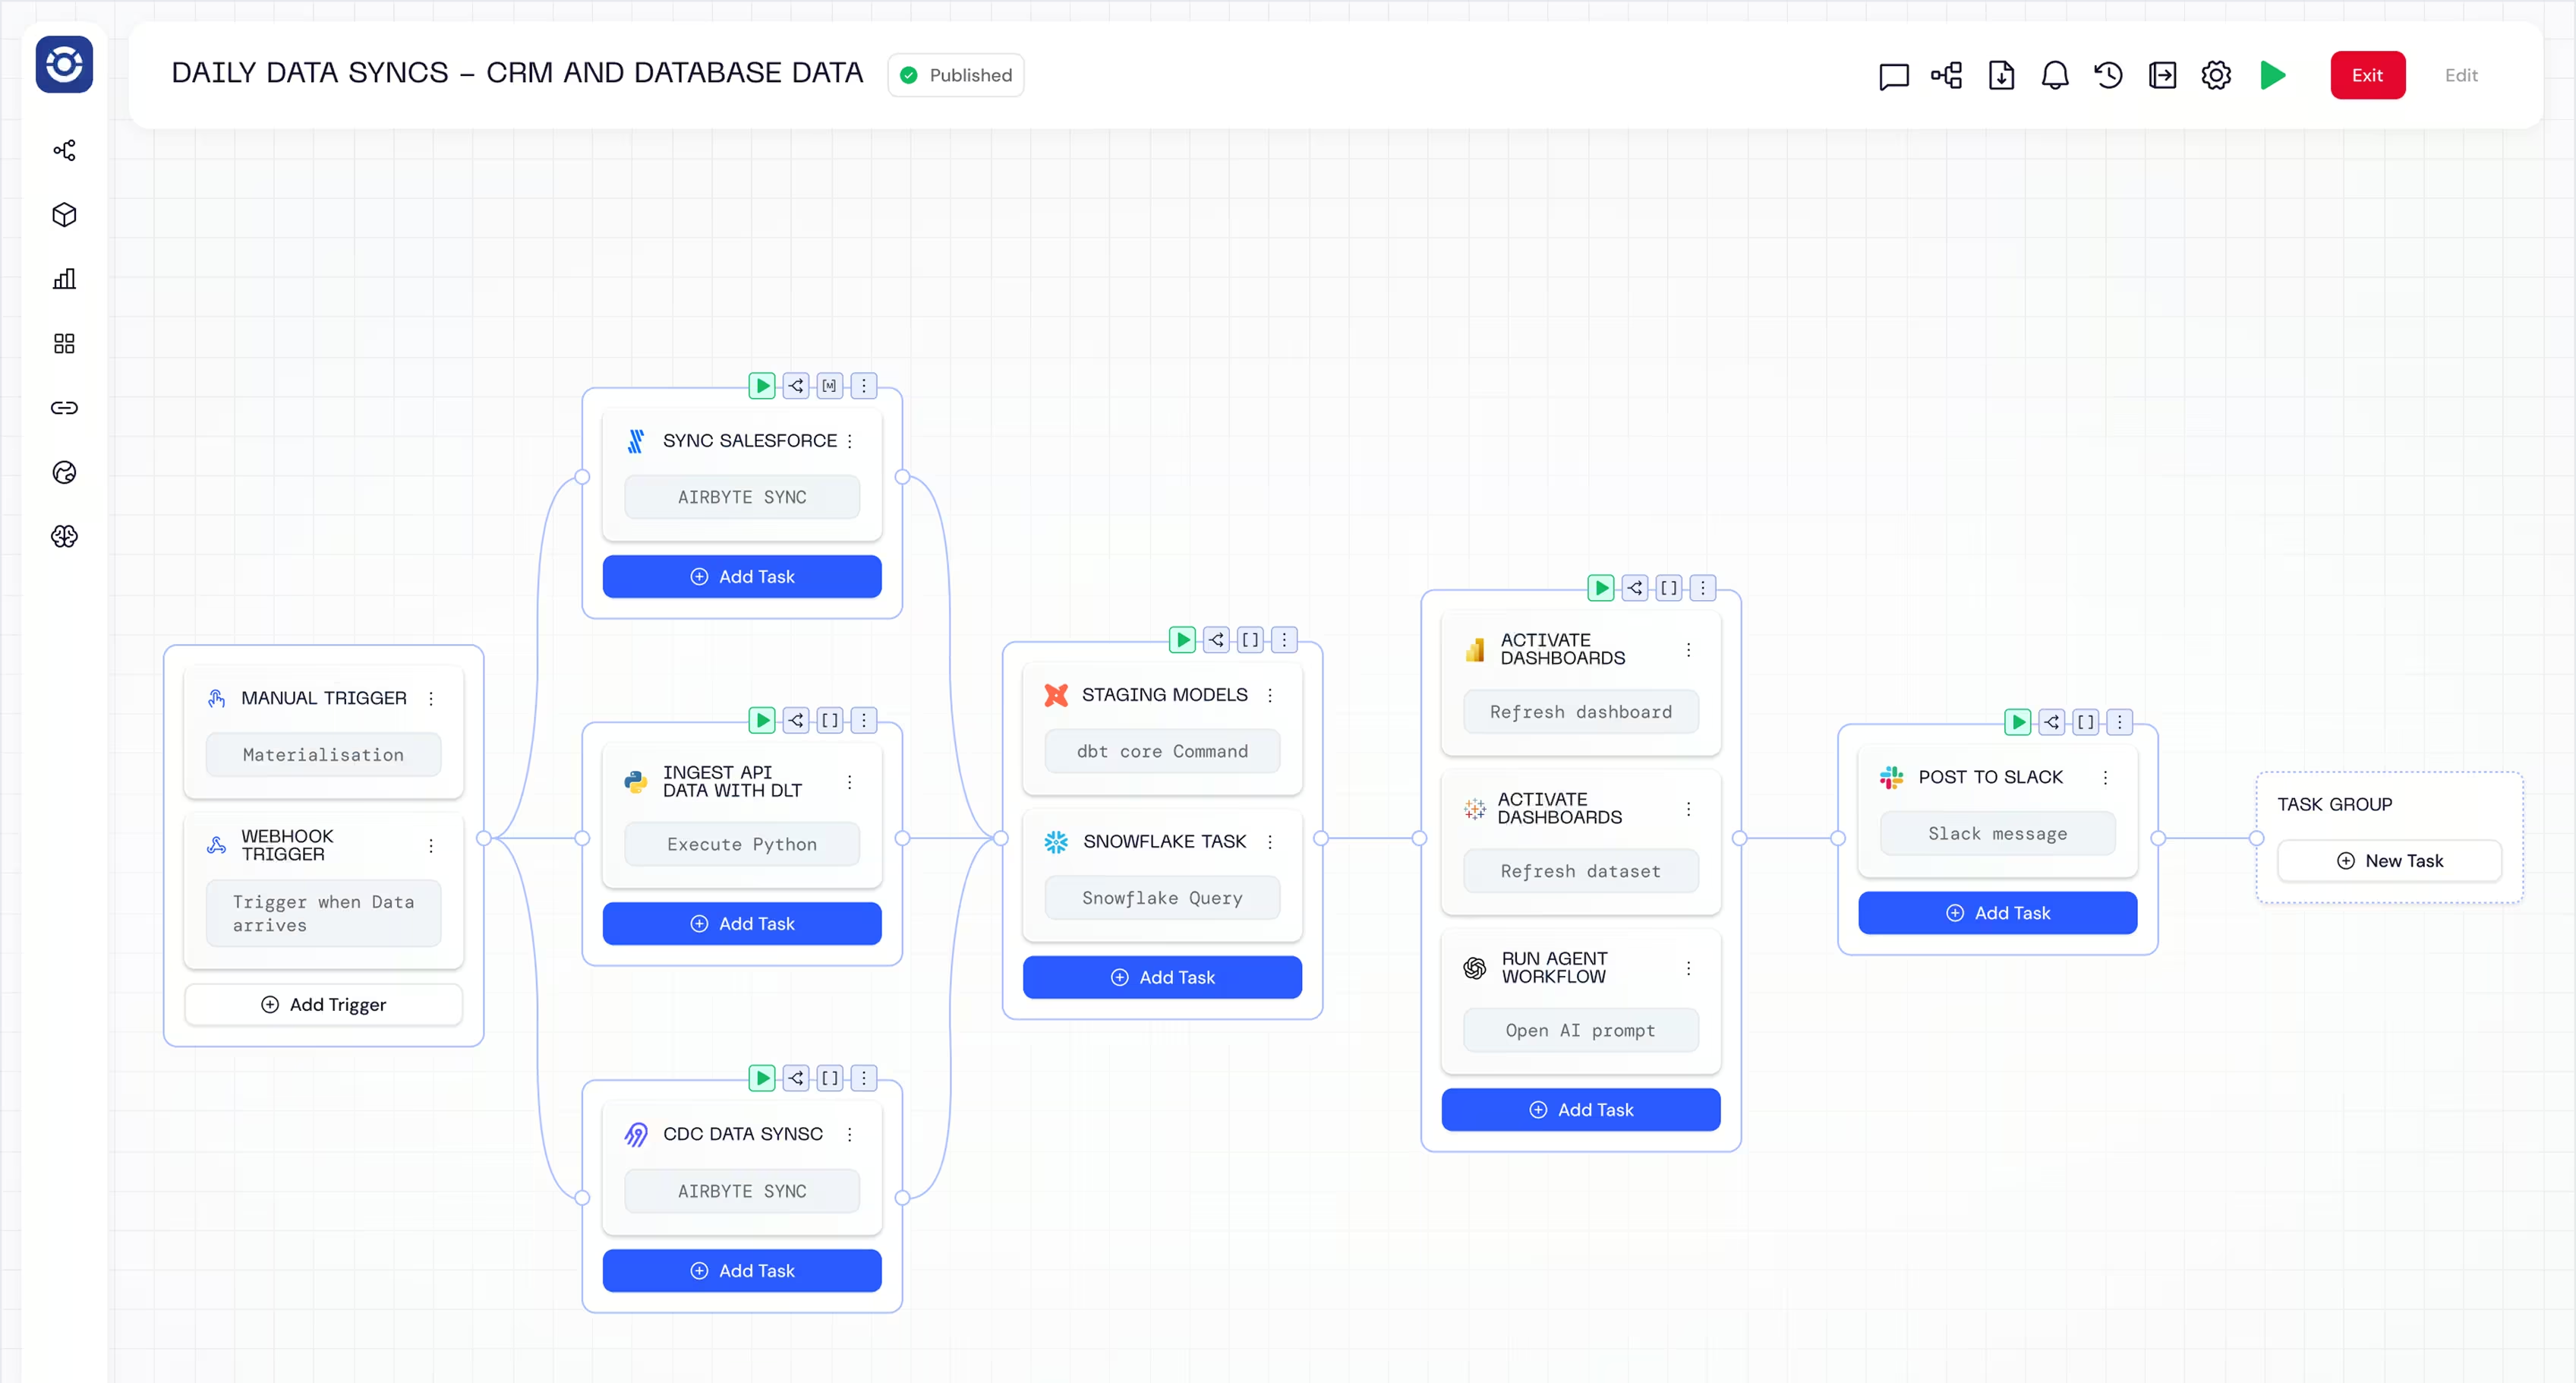
Concretely, that means: dependency-aware scheduling so nothing runs on an incomplete upstream table, column-level lineage so you can click from "this cell in this dashboard" back to "this specific dbt model and this specific run," and alerting that tells you about a broken pipeline before a human notices the downstream symptom.
The pattern worth internalising: if nothing downstream can start until everything upstream is verified complete, an entire category of "wrong number" incidents simply stops happening.
At Orchestra our mission is to make data people's lives easier. That starts with making stuff like this simpler.
Layer 4 — the source
The layer nobody controls, which is exactly why it needs the most instrumentation, not the least.
A vendor changes an API response without telling you. Someone repurposes a CRM field for a new use case that has nothing to do with what it originally tracked. A person edits a spreadsheet that three pipelines quietly depend on. None of this is negligence, it's just what happens when your data has sources outside your organisation's control.
The defence here isn't prevention, because you can't prevent what you don't control. It's early warning: freshness SLAs that tell you the moment a source stops updating on schedule, and quality gates that catch a malformed or out-of-range value before it's consumed downstream, rather than three weeks later when a confused executive asks about it. Orchestra's role in this layer is making sure those gates actually block bad data from propagating, rather than just logging a warning that nobody reads until after the damage is done.
How to make the next one take five minutes
The point of all of this isn't to get faster at the Slack forensics. It's to make the forensics unnecessary. What that takes, in practice:
Ready to experience next-gen analytics?
See how Astrato runs natively in your warehouse.