Variance Analysis: Types, Formulas & How to Automate the Workflow
Variance analysis explained: the types, the formulas, and a worked example — plus why the commentary is the real work, and how finance teams automate it.

Variance analysis compares what you expected to what actually happened — and explains the gap. This guide covers the types and formulas (with a worked example), then the part most articles skip: the commentary workflow, why it’s still the hardest manual job in finance, and how teams automate it.
The number is red. Everyone in the room can see it: actuals came in below budget. That part — spotting the variance — took a spreadsheet and a glance. Then someone asks the only question that matters: “why?” — and the room goes quiet, because answering it is real work.
That gap is the whole story of variance analysis. Calculating a variance is easy and getting easier; explaining the root cause and deciding the corrective action is where finance actually earns its keep. This guide does both halves: first the textbook — what variance analysis is, the types of variances, the formulas, and a worked example — then the workflow half, where the commentary lives and where most teams are still doing it by hand.
TL;DR
Variance analysis is the process of comparing actual results to a budget, forecast, or standard, and explaining the difference.
Variances are favorable or unfavorable, and split mainly into price (rate) and volume (quantity) effects — applied across cost categories like material, labor, and overhead.
The calculation is the easy part. The commentary — root cause plus corrective action — is the real work, and it’s still mostly manual. Automating that workflow (live data, governed writeback, AI-drafted first-pass commentary) is where the time is won.
What is variance analysis?
Variance analysis is the process of comparing actual financial results to an expected benchmark — a budget, a forecast, or a standard cost — and quantifying and explaining the difference. The variance is simply the gap:
Variance = Actual result − Expected (budget / forecast / standard)
A variance is favorable when it improves profit (revenue above plan, or cost below plan) and unfavorable when it hurts profit (revenue below plan, or cost above plan). Note that “favorable” isn’t automatically “good” — spending far below budget can mean under-investment, not thrift — which is exactly why the number alone never tells the story. It needs the commentary.
Why variance analysis matters
Variance analysis turns a pile of actuals into a management tool. Done well, it supports better decisions in a few specific ways:
- Cost control. It flags where actual cost diverged from plan, so overspend is caught early rather than at year-end.
- Performance insight. It separates effects — did profit move because of price, volume, or efficiency? — so leaders understand what actually drove financial performance.
- Corrective action. A variance with a known root cause points to a decision: renegotiate a supplier, adjust pricing, fix a process. Analysis without action is just reporting.
- Accountability. Tying variances to owners and explanations creates a record of why results landed where they did — useful for the next forecast and for audit.
Types of variance analysis
Most variances decompose into two fundamental effects, then apply across cost and revenue categories. Understanding the families is what makes a variance explainable rather than just visible.
Price (rate) vs. volume (quantity)
Nearly every variance splits into these two. A price variance (also called a rate variance) isolates the effect of paying or charging a different price than planned. A volume or quantity variance isolates the effect of a different number of units than planned. Separating them answers “did the gap come from price, or from quantity?” — a question a single total can’t.
By cost category
- Material variance. Splits into a material price variance (cost per unit of material) and a material quantity (usage) variance (how much material was used).
- Labor variance. Splits into a labor rate variance (cost per labor hour) and a labor efficiency variance (hours used vs. standard hours for the output).
- Overhead variance. Variable overhead splits into spending and efficiency variances; fixed overhead into a budget (spending) variance and a fixed overhead volume variance.
Sales and other variances
On the revenue side, a sales price variance and a sales volume variance decompose why sales differed from plan. A flexible budget variance compares actuals to a budget flexed to the actual level of activity, isolating performance from the effect of volume alone. The efficiency variance, broadly, measures the difference between the inputs you should have used for the output achieved and the inputs you actually used.
Variance analysis formulas (with a worked example)
The two foundational formulas — price and quantity — are the ones to know, because every category variance above is a version of them:
Price variance = (Actual price − Standard price) × Actual quantity
Quantity variance = (Actual quantity − Standard quantity) × Standard price
Labor follows the identical shape, with rate in place of price and hours in place of quantity:
Labor efficiency variance = (Actual hours − Standard hours) × Standard rate
A quick worked example on the revenue side, to show how the pieces reconcile. Suppose you budgeted 1,000 units at $10 (= $10,000) and actually sold 900 units at $11 (= $9,900):
Sales price variance = ($11 − $10) × 900 units = +$900 (favorable)
Sales volume variance = (900 − 1,000) × $10 = −$1,000 (unfavorable)
— exactly the $9,900 vs. $10,000 gap. That’s the point of decomposing: the headline was a $100 miss, but underneath, a price gain nearly offset a real volume problem. The total hid the story; the variances revealed it. (Conventions vary slightly by costing method, so treat these as the standard core, not the only formulation.)
The variance analysis process, step by step
However you calculate them, the variance analysis process follows the same arc:
- Calculate the variances. Compare actuals to budget, forecast, or standard across the relevant categories.
- Identify what’s significant. Filter for variances large enough to matter — by threshold or percentage — so attention goes where it counts.
- Find the root cause. For each significant variance, determine why — price, volume, timing, a one-off, or an accounting error. This is the analytical heart of the work.
- Write the commentary. Explain the cause in plain language for the people who’ll act on it — the narrative that turns numbers into a decision.
- Decide the corrective action. Translate the explanation into a concrete next step, and assign it an owner.
Notice where the effort actually sits in that process. Steps 1 and 2 — calculate and filter — are arithmetic; software does them instantly. Steps 3 through 5 — root cause, commentary, corrective action — are where a senior analyst spends a day every cycle. The variance is visible the moment the actuals land. The explanation is the scarce, expensive part.
And here’s the disconnect: most finance teams have automated exactly the half that was already easy. A dashboard shows budget vs. actuals in red and green beautifully — and then the analyst exports it, opens a spreadsheet to investigate, and writes the commentary in a Word document that lives nowhere near the numbers. The commentary workflow is still manual, disconnected, and re-done from scratch every month. (It’s the same pattern behind spreadsheet sprawl, pointed at narrative instead of models.)
How to automate the variance and commentary workflow
Automating variance analysis doesn’t mean a better-looking dashboard — it means closing the loop from variance to explanation to action in one governed place. The pattern:
- Calculate continuously on live data. Variances compute against the warehouse as actuals land, so the “what” is ready the moment you need it — no export, no month-end batch.
- Drill to root cause in place. A dashboard shows the variance but can’t help you investigate it; a data app lets you drill from the variance into the transactions behind it without leaving the surface. (That read-vs-act gap is the whole difference between a dashboard and a data app.)
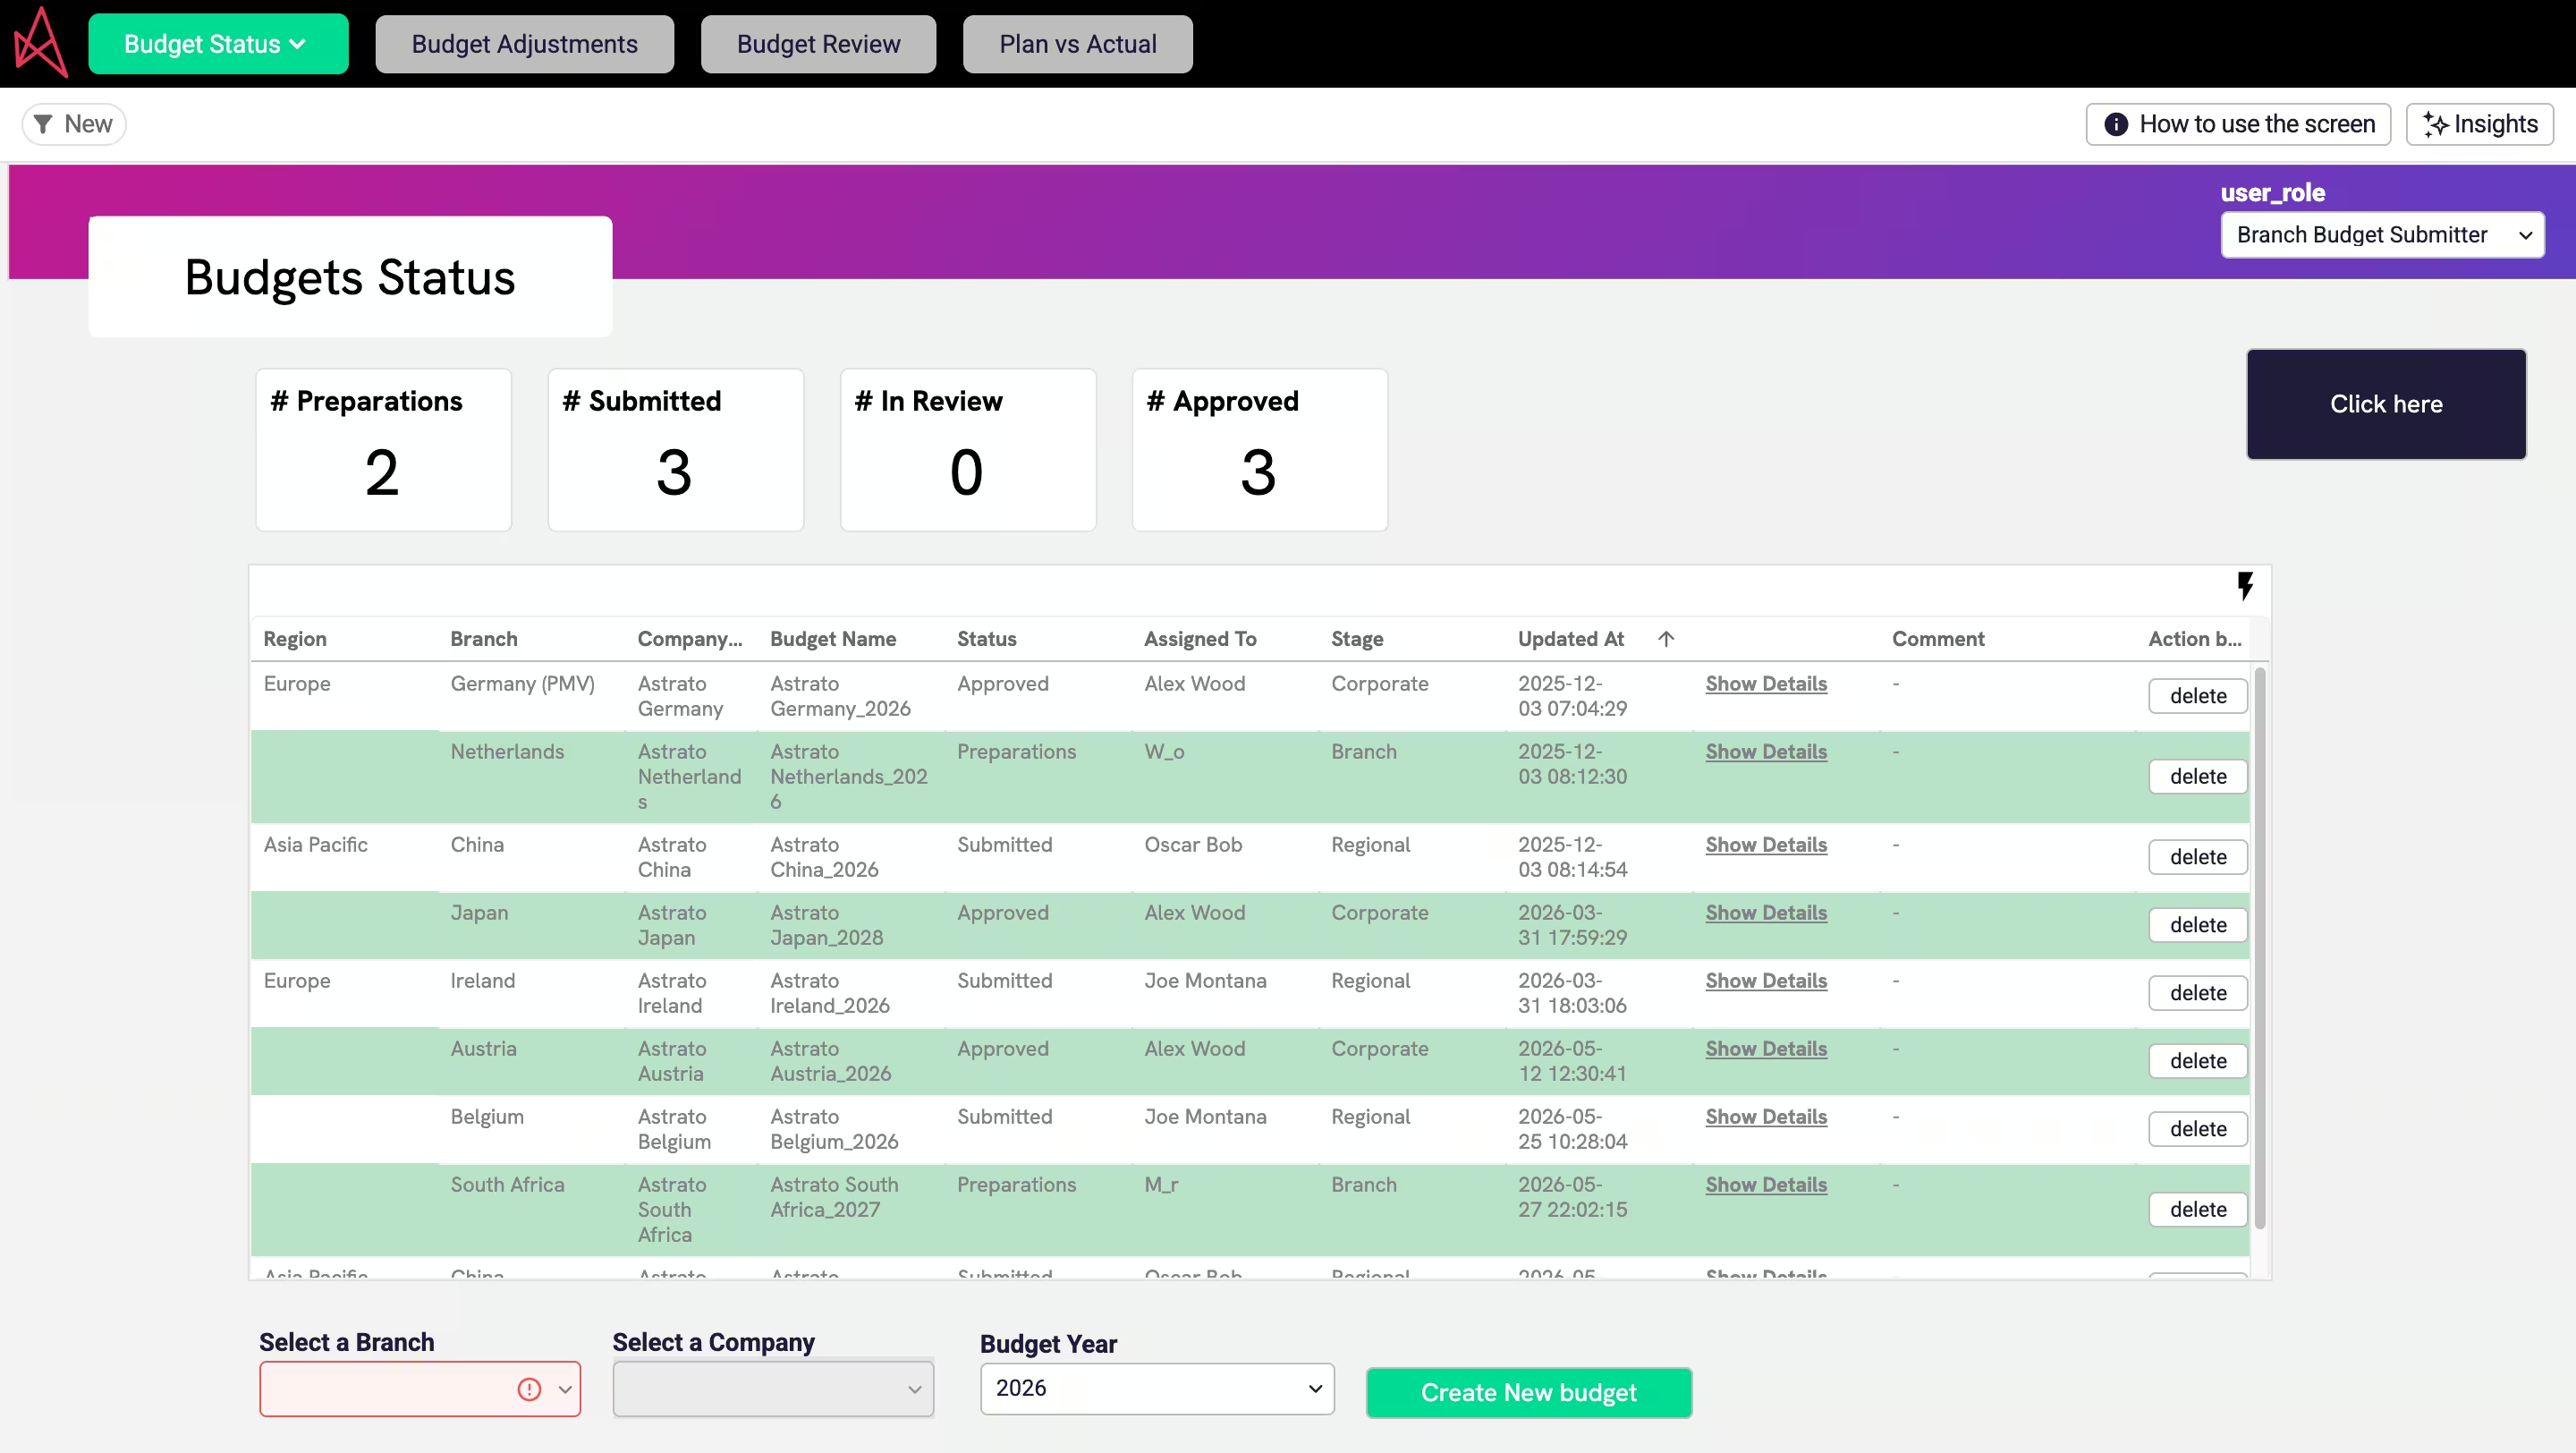
- Capture commentary where the number lives. Instead of a separate Word doc, the explanation and the corrective action are written back next to the variance via writeback — so the narrative is attached to the number, governed and searchable, not lost in an inbox.
- Let AI draft the first pass. This is the strongest near-term use of AI in finance: generative AI drafts the first-pass commentary — “margin fell because input prices rose 4% while volume held” — for the analyst to verify and refine, turning a blank page into an edit. The catch is non-negotiable: AI commentary is only trustworthy when it runs on governed numbers, which is why the semantic layer matters as much as the model. On spreadsheet sprawl, AI just writes confident, wrong explanations faster.
Done this way, variance analysis stops being a monthly archaeology project and becomes part of the live finance workflow — the same governed approach behind a faster month-end close and the rest of a team’s finance analytics workflows.
Best practices for effective variance analysis
- Set materiality thresholds. Investigate variances that matter; don’t drown the team explaining noise.
- Decompose before you explain. Always split price from volume — a flat total often hides offsetting moves, as the worked example showed.
- Tie every explanation to an action. A root cause with no corrective action is reporting, not analysis.
- Keep the commentary with the numbers. Narrative stored apart from the data drifts out of date and can’t be audited; keep them together and governed.
- Standardize the cycle. Same categories, same thresholds, same owners every period makes variances comparable over time.
Frequently asked questions
What is variance analysis?
It's the process of comparing actual financial results to an expected benchmark — a budget, forecast, or standard cost — then quantifying and explaining the difference. The variance is Actual minus Expected; the analysis is understanding why the gap exists and what to do about it.
What are the main types of variance analysis?
Most variances split into two fundamental effects — price (rate) and volume (quantity) — applied across categories: material (price and usage), labor (rate and efficiency), overhead (spending and volume), and sales (price and volume). A flexible-budget variance isolates performance from the effect of activity level.
What is the variance analysis formula?
The two core formulas are: Price variance = (Actual price − Standard price) × Actual quantity; and Quantity variance = (Actual quantity − Standard quantity) × Standard price. Labor uses the same shape with rate and hours. Every category variance is a version of these two.
What's the difference between a favorable and unfavorable variance?
A favorable variance improves profit — revenue above plan or cost below plan. An unfavorable variance hurts profit — revenue below plan or cost above plan. Favorable isn't automatically good, though: spending far below budget can signal under-investment, which is why the commentary matters more than the sign.
Can variance analysis be automated?
The calculation can be fully automated — variances compute against live data the moment actuals land. The harder, more valuable part, the commentary, can be accelerated too: generative AI can draft a first-pass explanation for an analyst to verify, provided it runs on governed numbers rather than scattered spreadsheets.
Can AI write variance commentary?
AI can draft the first pass — a plain-language explanation of what moved and by how much — which an analyst then verifies and refines. It's one of the most practical uses of AI in finance. The essential condition is governed data: AI grounded in a semantic layer is trustworthy; AI on spreadsheet sprawl produces confident, wrong commentary.
Turn variance analysis into a workflow, not a monthly scramble
Astrato is the warehouse-native BI platform finance teams use to run variance analysis end to end — live budget-vs-actuals on the warehouse, drill-to-root-cause in place, commentary and corrective actions written back next to the numbers, and AI-drafted first-pass narrative grounded in a governed semantic layer. Explore the finance demo apps or book a demo to see the variance-to-action loop run in one place.
Ready to experience next-gen analytics?
See how Astrato runs natively in your warehouse.