Finance Analytics Workflows: How Teams Operationalize Data
Finance analytics workflows turn reporting, budgeting, and forecasting from manual spreadsheets into automated processes. Real examples, use cases, and best practices.

A finance analytics workflow is the path from raw financial data to a decision — and in most finance teams, most of that path still runs on spreadsheets and email. This guide covers what these workflows are, the use cases worth automating first, real examples from finance teams who did it, and how to modernize without losing control.
Ask any finance team how the monthly close actually works and you’ll hear the same story: numbers exported from a system, rebuilt in a spreadsheet, reconciled over email, version-controlled by filename, and finally pasted into a board pack. The financial analysis is rarely the hard part. The workflow around it is.
That workflow is where finance loses its time — and where manual errors creep in. A finance analytics workflow is the end-to-end process that turns financial data into a decision:
- pulling from data sources
- preparing it
- analyzing it
- reporting it
- acting on it
This guide is about moving those workflows off spreadsheets and onto something governed and automated — with real examples from finance teams who’ve done exactly that.
TL;DR
A finance analytics workflow is the repeatable process that turns financial data into a decision — reporting, budgeting, forecasting, close, and the analysis around them.
In most teams these workflows are manual: export, rebuild in a spreadsheet, reconcile, repeat. That’s slow, error-prone, and impossible to audit cleanly.
Modernizing them means financial workflow automation on governed, real-time data — so finance can act inside the numbers, not just report on them. The payoff is real: one team cut monthly management accounts from 4–5 person-weeks to a single click.
What is a finance analytics workflow?
A finance analytics workflow is the structured sequence a finance team follows to move from raw financial data to a financial decision. It spans collecting data from multiple sources (the ERP, the CRM, the bank feed), preparing and reconciling it, running the financial analysis, producing the report, and — in a modern setup — acting on the result. (It’s the finance-specific version of the broader data analytics workflow.)
The distinction that matters: a financial workflow isn’t just analysis, it’s analysis plus the actions around it — the approval, the adjustment, the submission, the sign-off. That’s why finance is the function where the gap between “looking at the number” and “doing something about it” hurts most.
A financial analyst doesn’t just want to see the variance; they want to adjust the forecast where it appears. Finance leaders don’t want a stale report; they want real-time numbers they can act on.
Why most finance workflows are still manual (and why that’s expensive)
Five years ago, finance teams asked for dashboards to fix the spreadsheet problem. They got dashboards — and the spreadsheets stayed. Why? Because a dashboard shows numbers, and finance runs on actions. You can’t approve a budget, remap a dimension, or commit a forecast from a read-only chart, so the real work leaked back into Excel.
The cost of that is easy to underestimate. Manual data handling means manual errors — a broken formula, a wrong paste, a stale tab. Reconciliation by email means no clean audit trail. And financial analysts who should be doing strategic analysis spend their days copying exports instead.
The spreadsheet was never the format problem; it was the system-of-record problem. The numbers people act on live somewhere the rest of the stack can’t see or govern.
Not every workflow is worth rebuilding at once. These are the finance use cases with the highest payoff — the ones where automation removes the most manual effort and risk.
Financial reporting and the close
The monthly close is the canonical candidate: high-frequency, high-stakes, and drowning in manual processes. Automating financial reporting — management accounts, board packs, statutory reports — on live data means a hierarchy change propagates everywhere at once, instead of rippling across hundreds of tabs.
Budgeting and forecasting
Budgeting is a workflow, not a document: inputs collected, validated, approved, consolidated. Done as a financial app, the forecast updates as actuals land, and predictive inputs let planners model a scenario against live numbers rather than rebuilding a workbook.
Variance analysis and commentary
Spotting the variance is easy; explaining and acting on it is the work. A modern workflow lets an analyst adjust the forecast where the variance appears and capture the commentary in the same place — increasingly with generative AI drafting the first-pass summary.
Master data and reconciliation
Consolidating financial data from multiple sources — especially after acquisitions — is a workflow finance owns and IT can’t easily help with. Letting finance map and write back the agreed standard turns a multi-quarter project into an ongoing, governed process.
The clearest case for modernizing is what happens when teams actually do it. Three finance teams, three workflows, three different shapes of the same win.
- GlobalData — the close, from weeks to a click. Around 250 accountants spent four to five person-weeks a month rebuilding management accounts in spreadsheets from CSV exports. Rebuilt as a governed workflow on the warehouse, a hierarchy change now propagates in about 15 minutes — and the board still gets the same template. The financial reporting didn’t change; the workflow around it did. Read the full story.
- PeerMusic — budgeting across 40 entities in six weeks. A global music publisher moved budgeting across 40 entities into a single governed workflow — inputs validated and approvals routed in place, instead of chased across linked workbooks. The budget stopped being a document and became a process.
- Ceres Pharma — master data after 14 acquisitions. After 14 acquisitions, the same product appeared under several codes across systems. Rather than a multi-year master-data programme, finance experts map each product to one corporate code and write it back themselves — a reconciliation workflow finance runs, not waits on. Read the full story.
None of these is a story about better charts. Each is a financial workflow that used to live in spreadsheets, rebuilt so finance can act inside it.
What a finance analytics workflow looks like as an app
Abstract until you see one. These are live, interactive finance data apps you can open in the Astrato demo gallery — each one a finance workflow, not a static report:
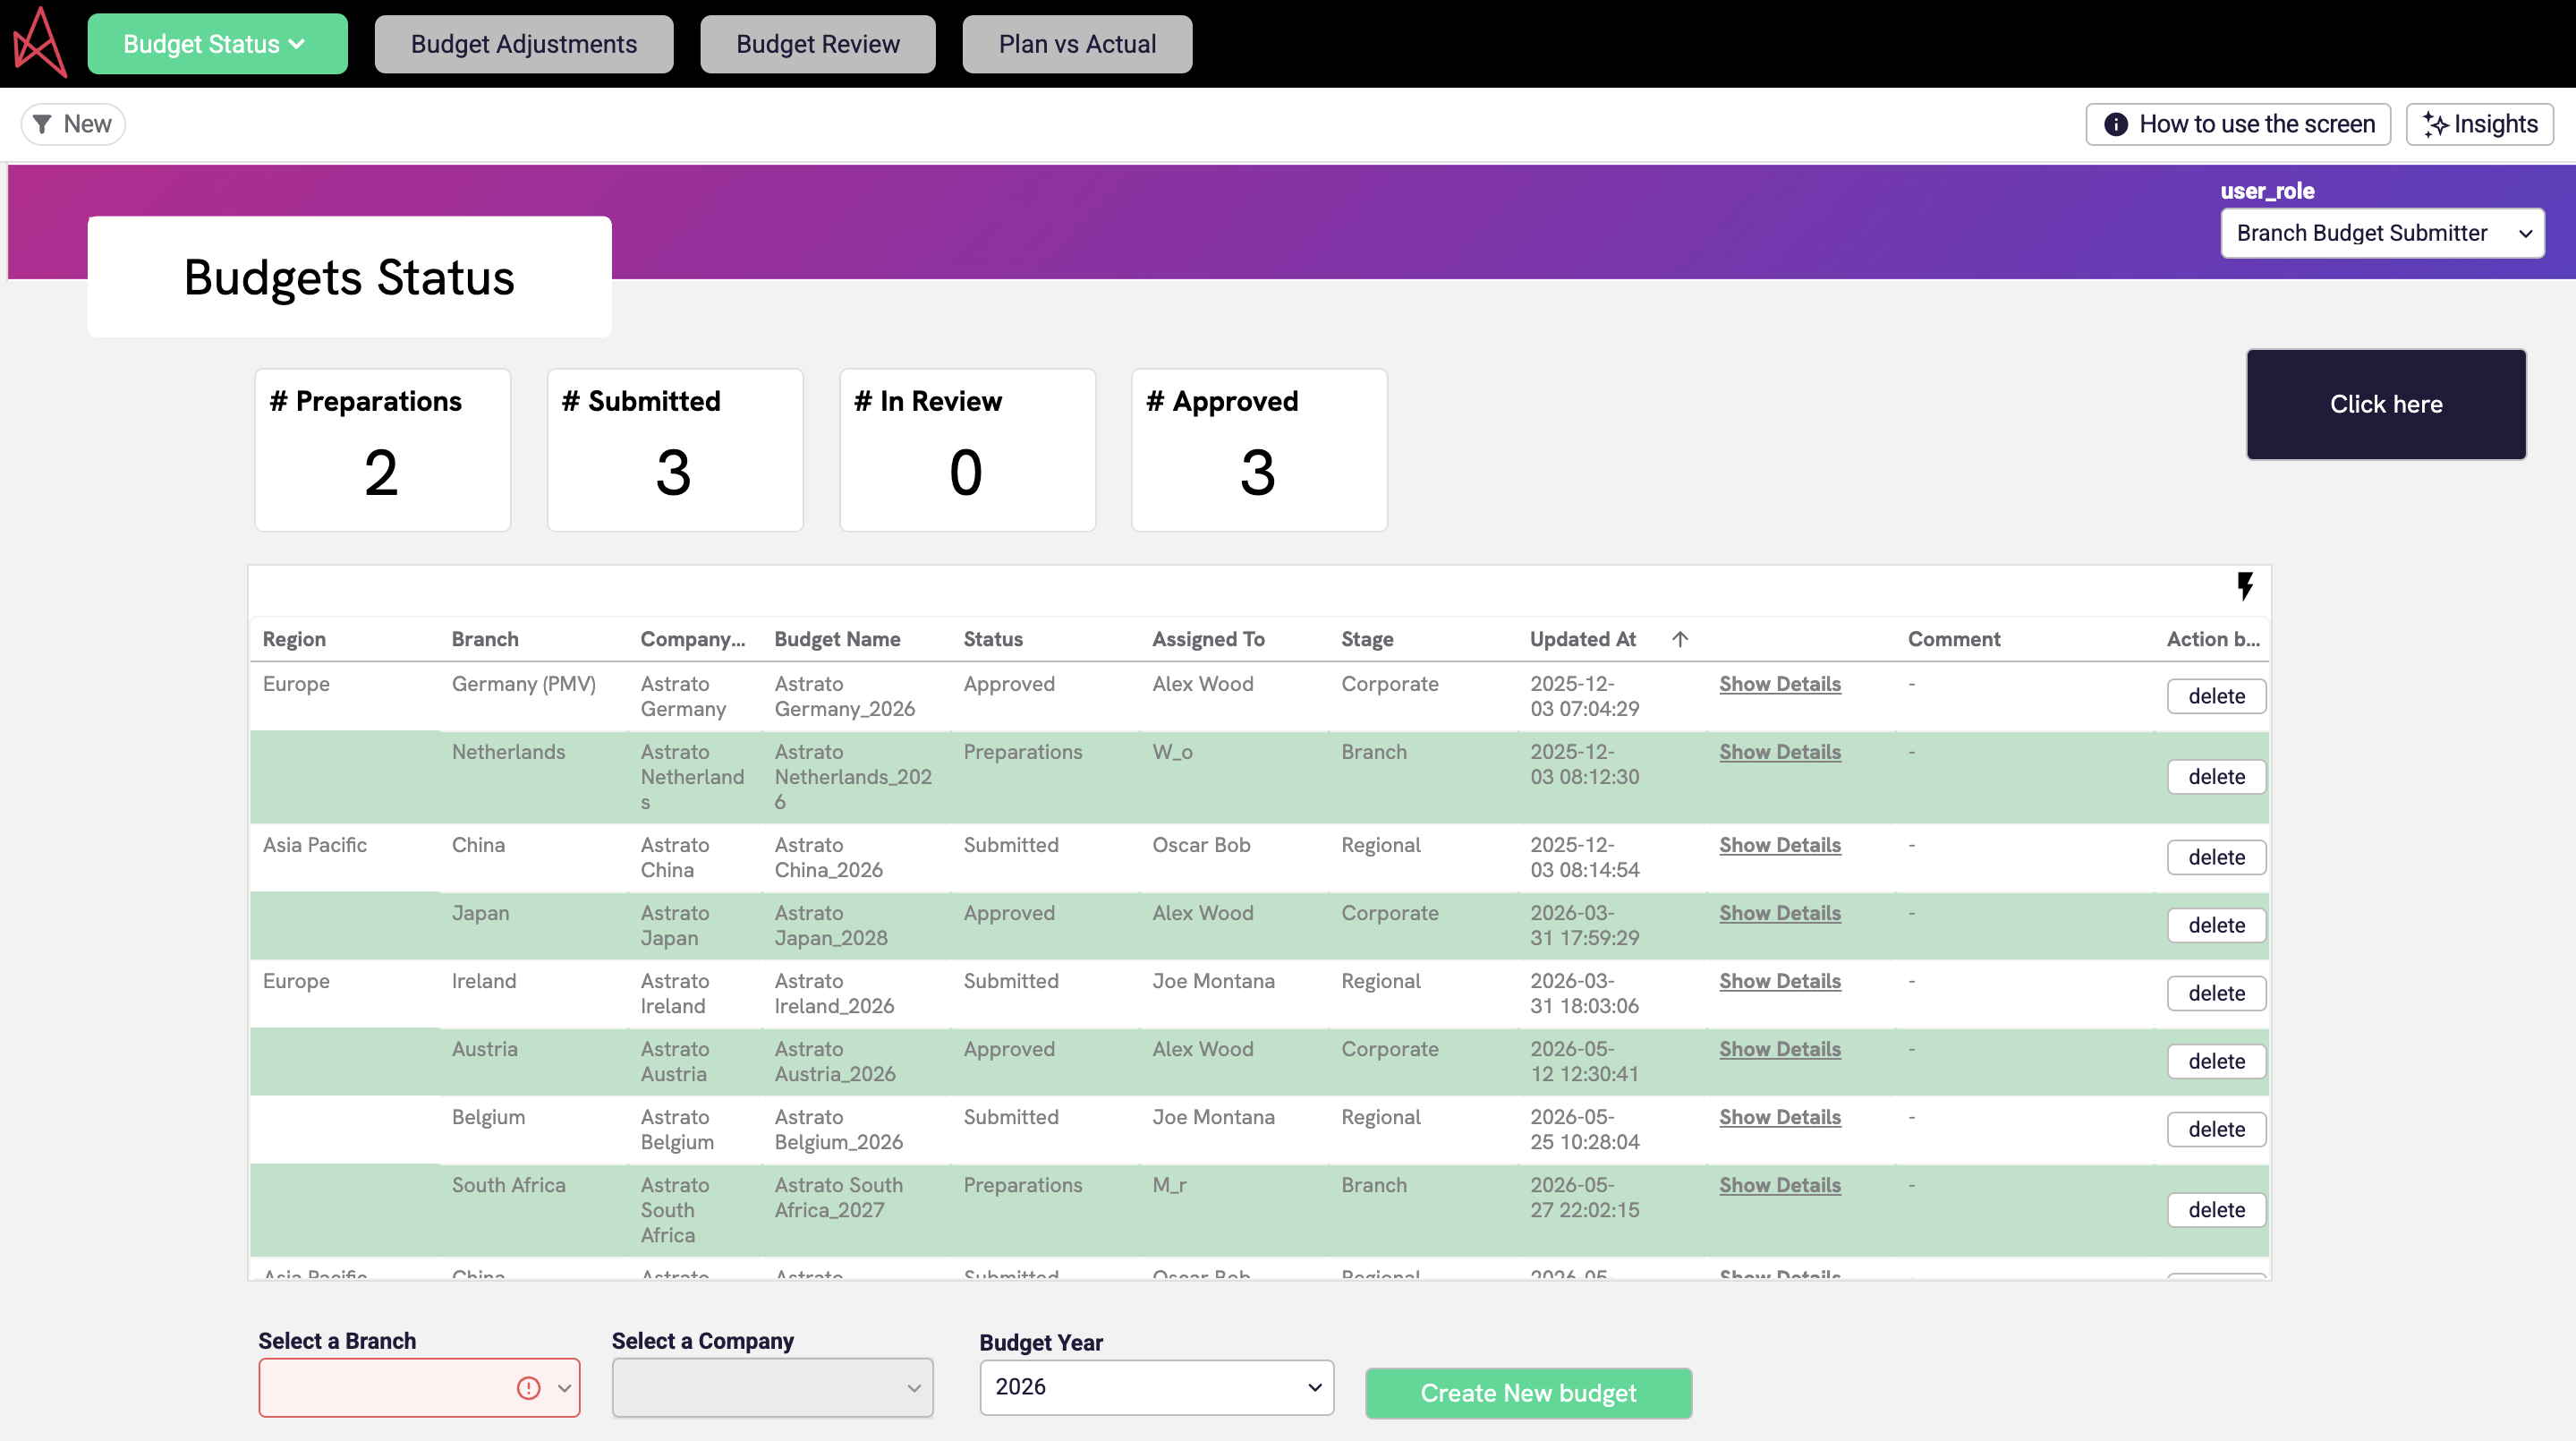
- Budgeting: Track budgets against actuals in real time, monitor utilisation with KPI views, and break down by company, category, and period — built for finance teams moving beyond spreadsheets into interactive, self-service planning.
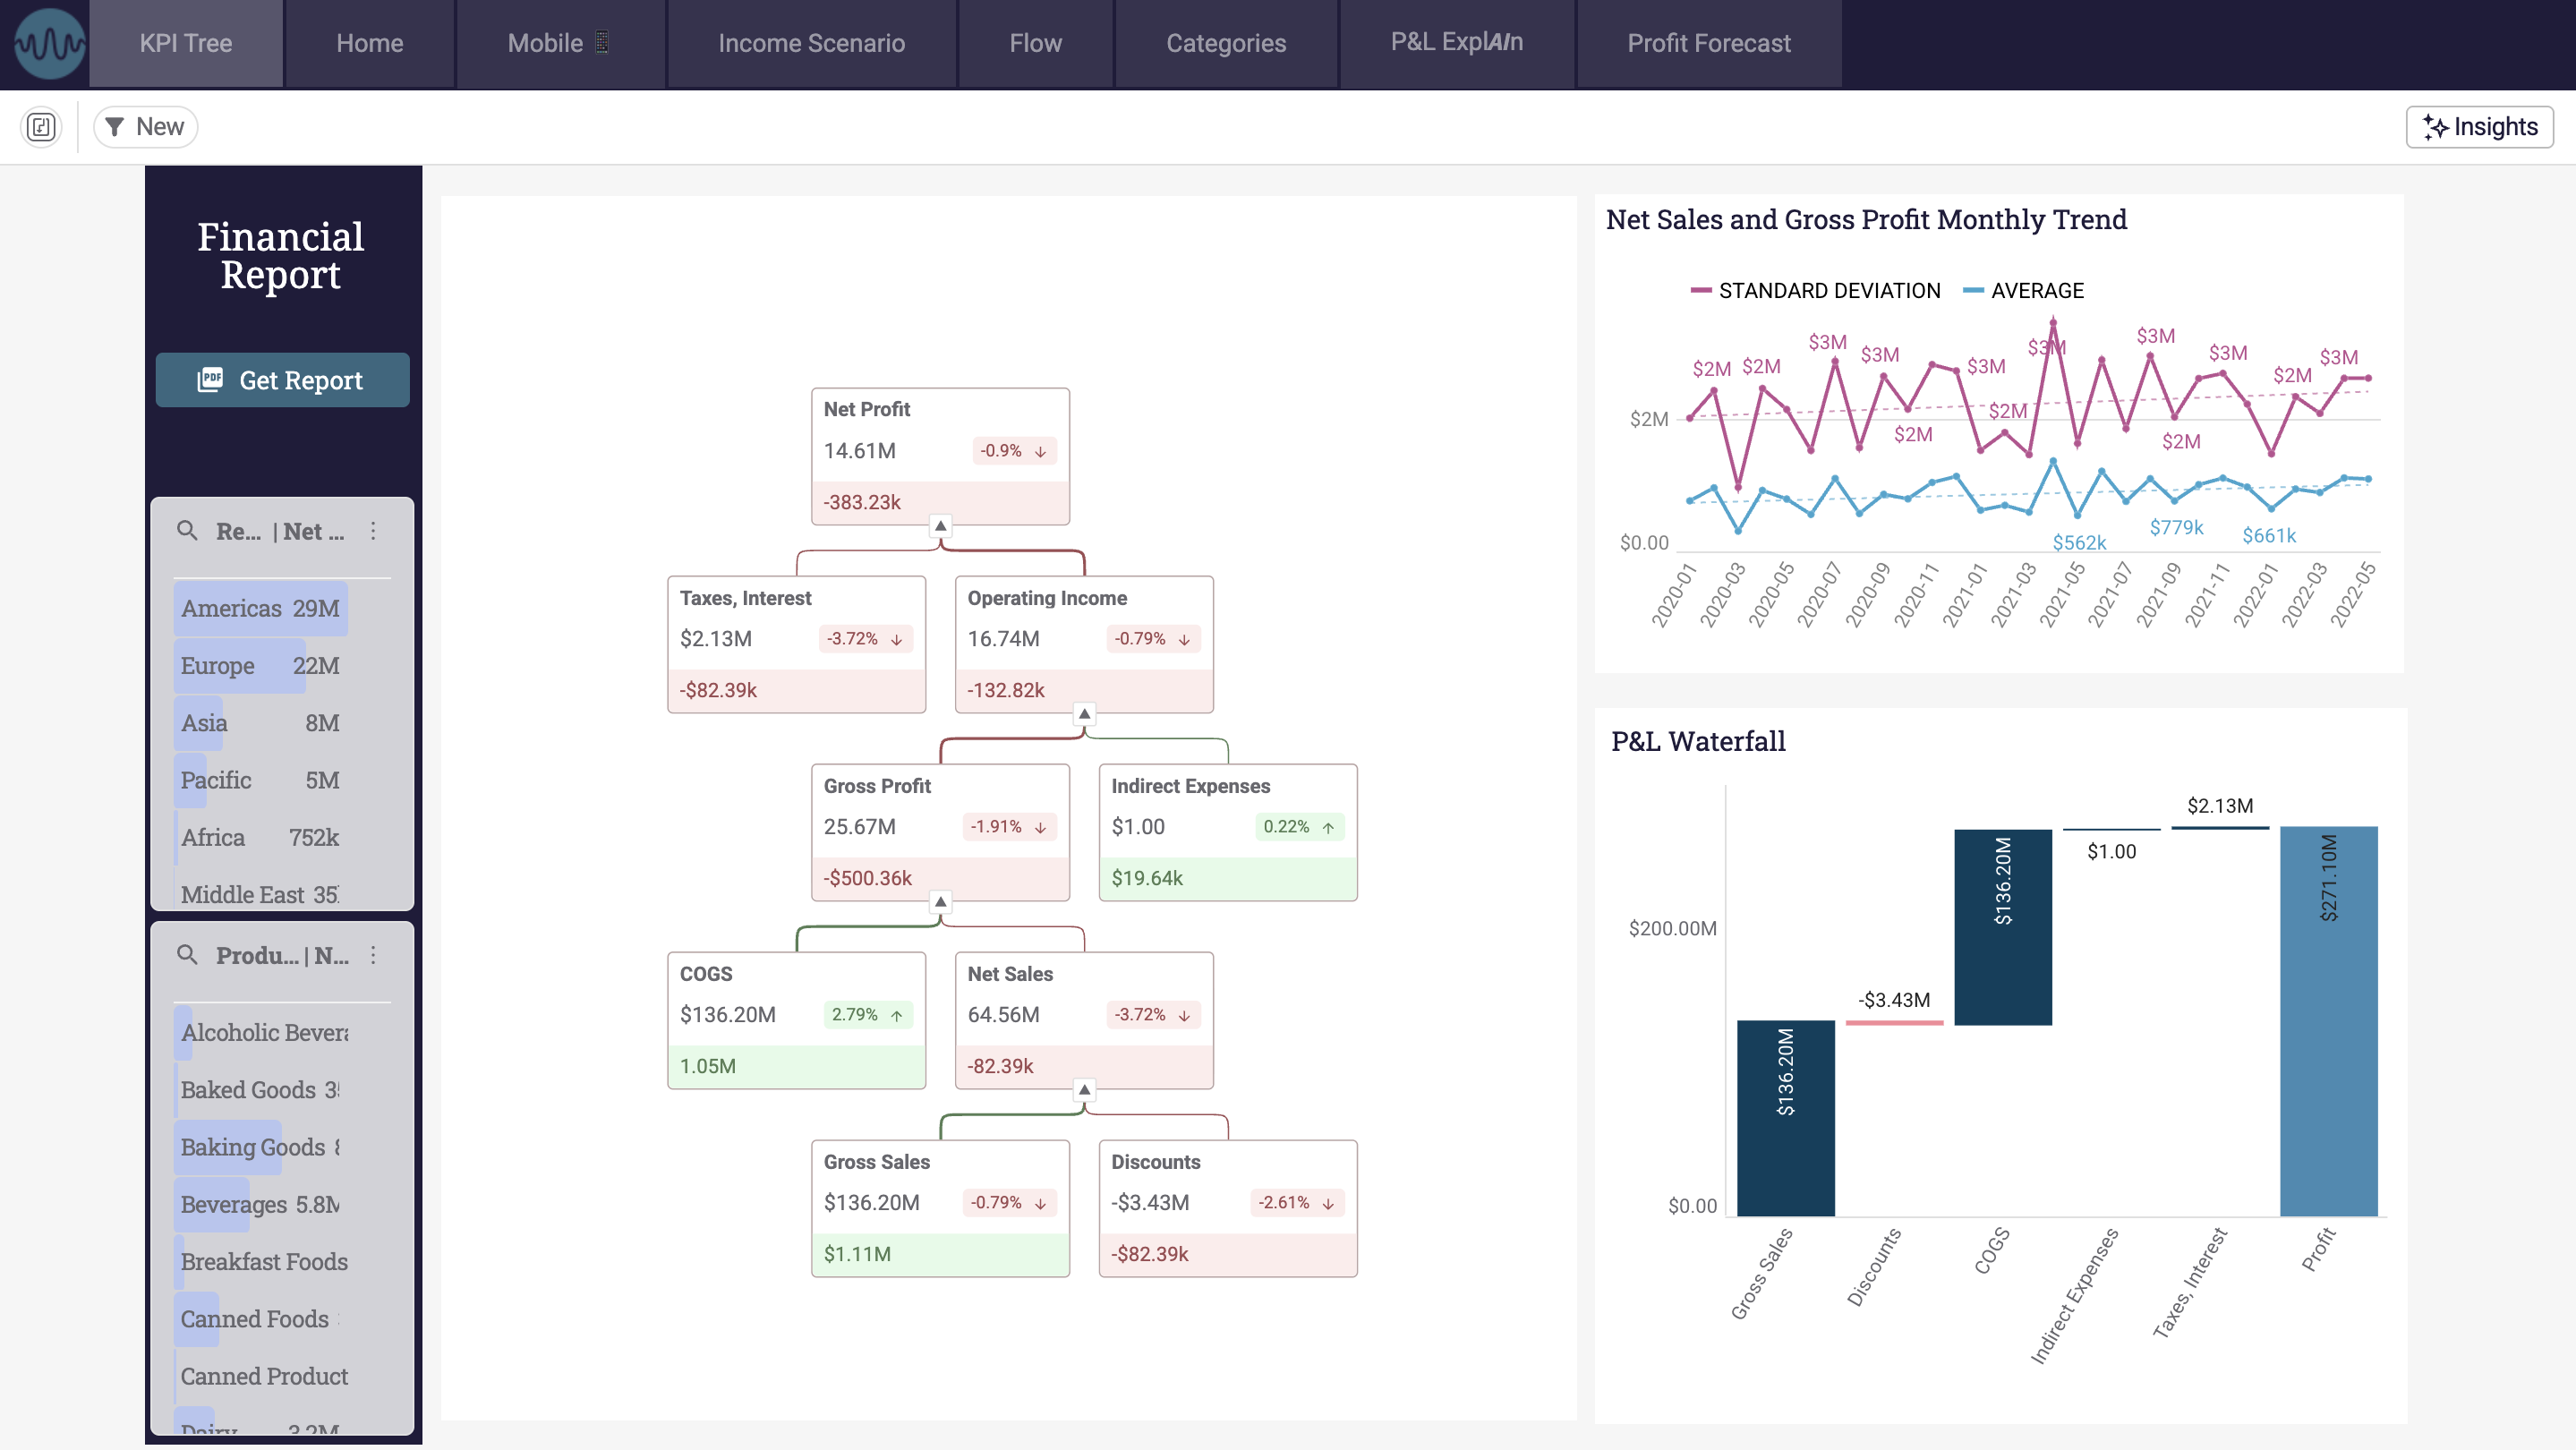
- Financial Profit & Loss: Makes complex financial statements accessible to business users — intuitive P&L analysis on governed, cloud-native data.
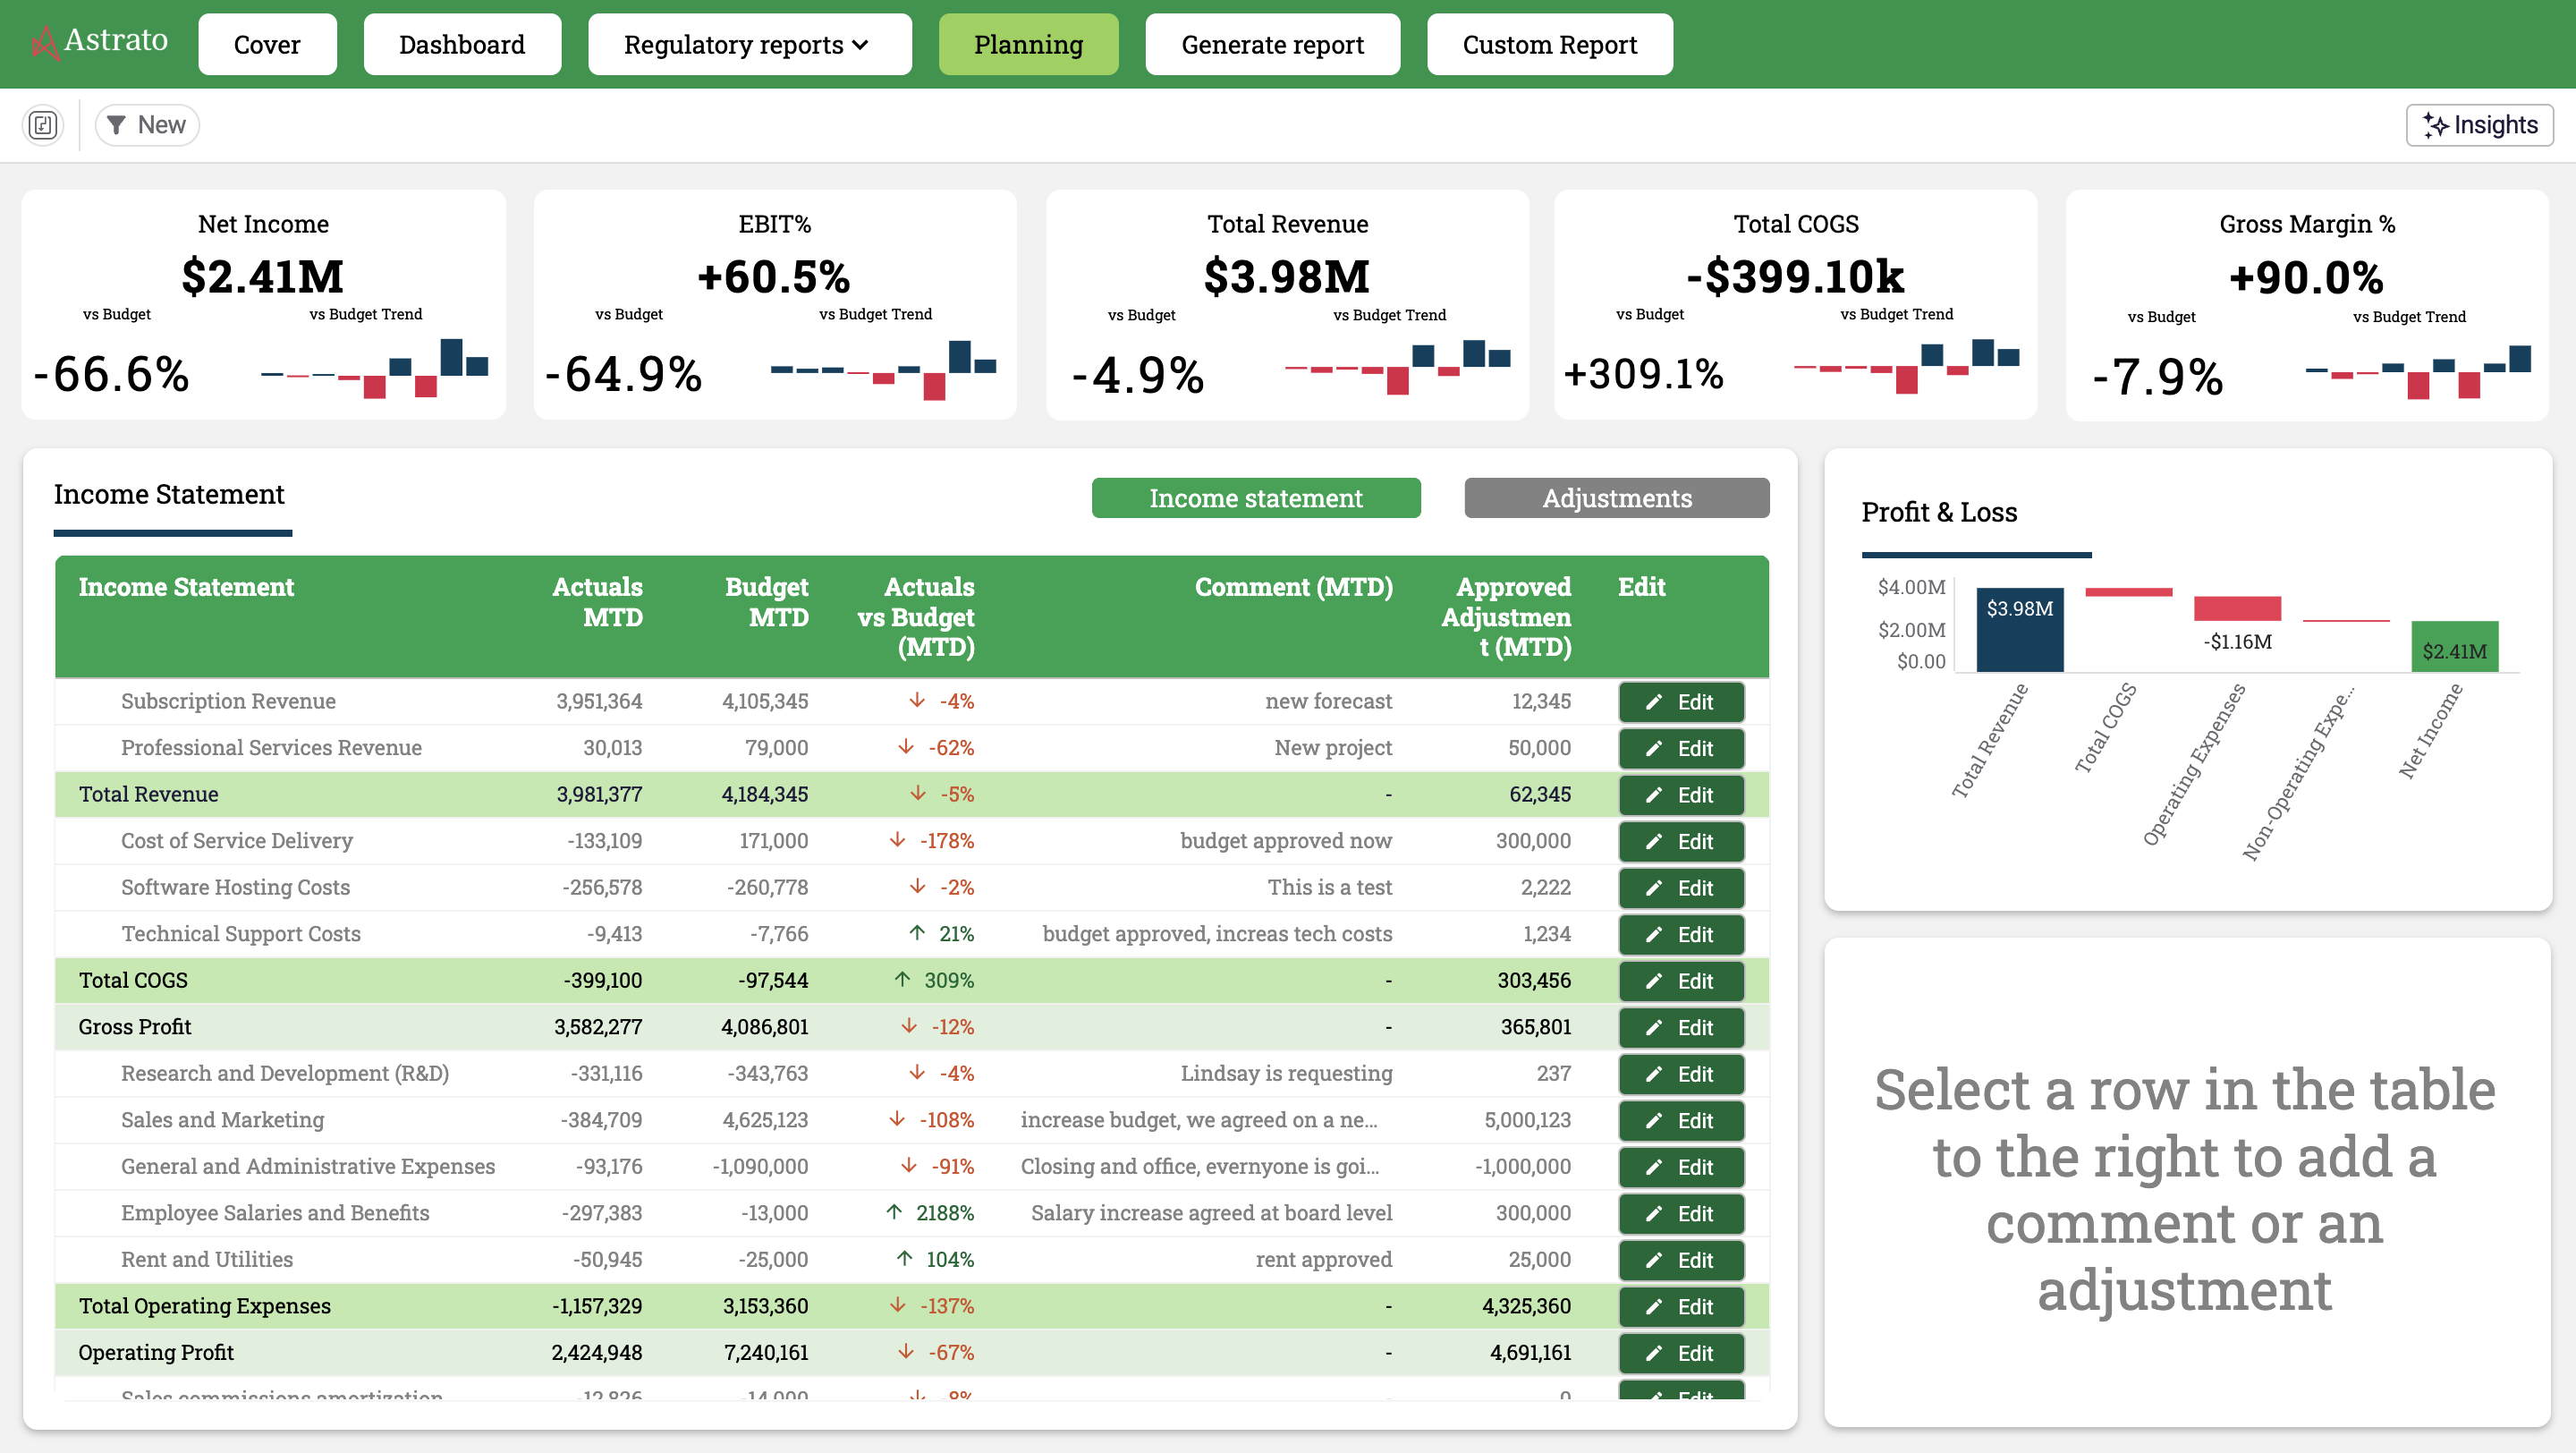
- Finance Planning (PDF & Excel reporting): Create, schedule, and distribute paginated reports and exports, with AI summaries turning complex data into actionable insight — the reporting workflow, operationalized.
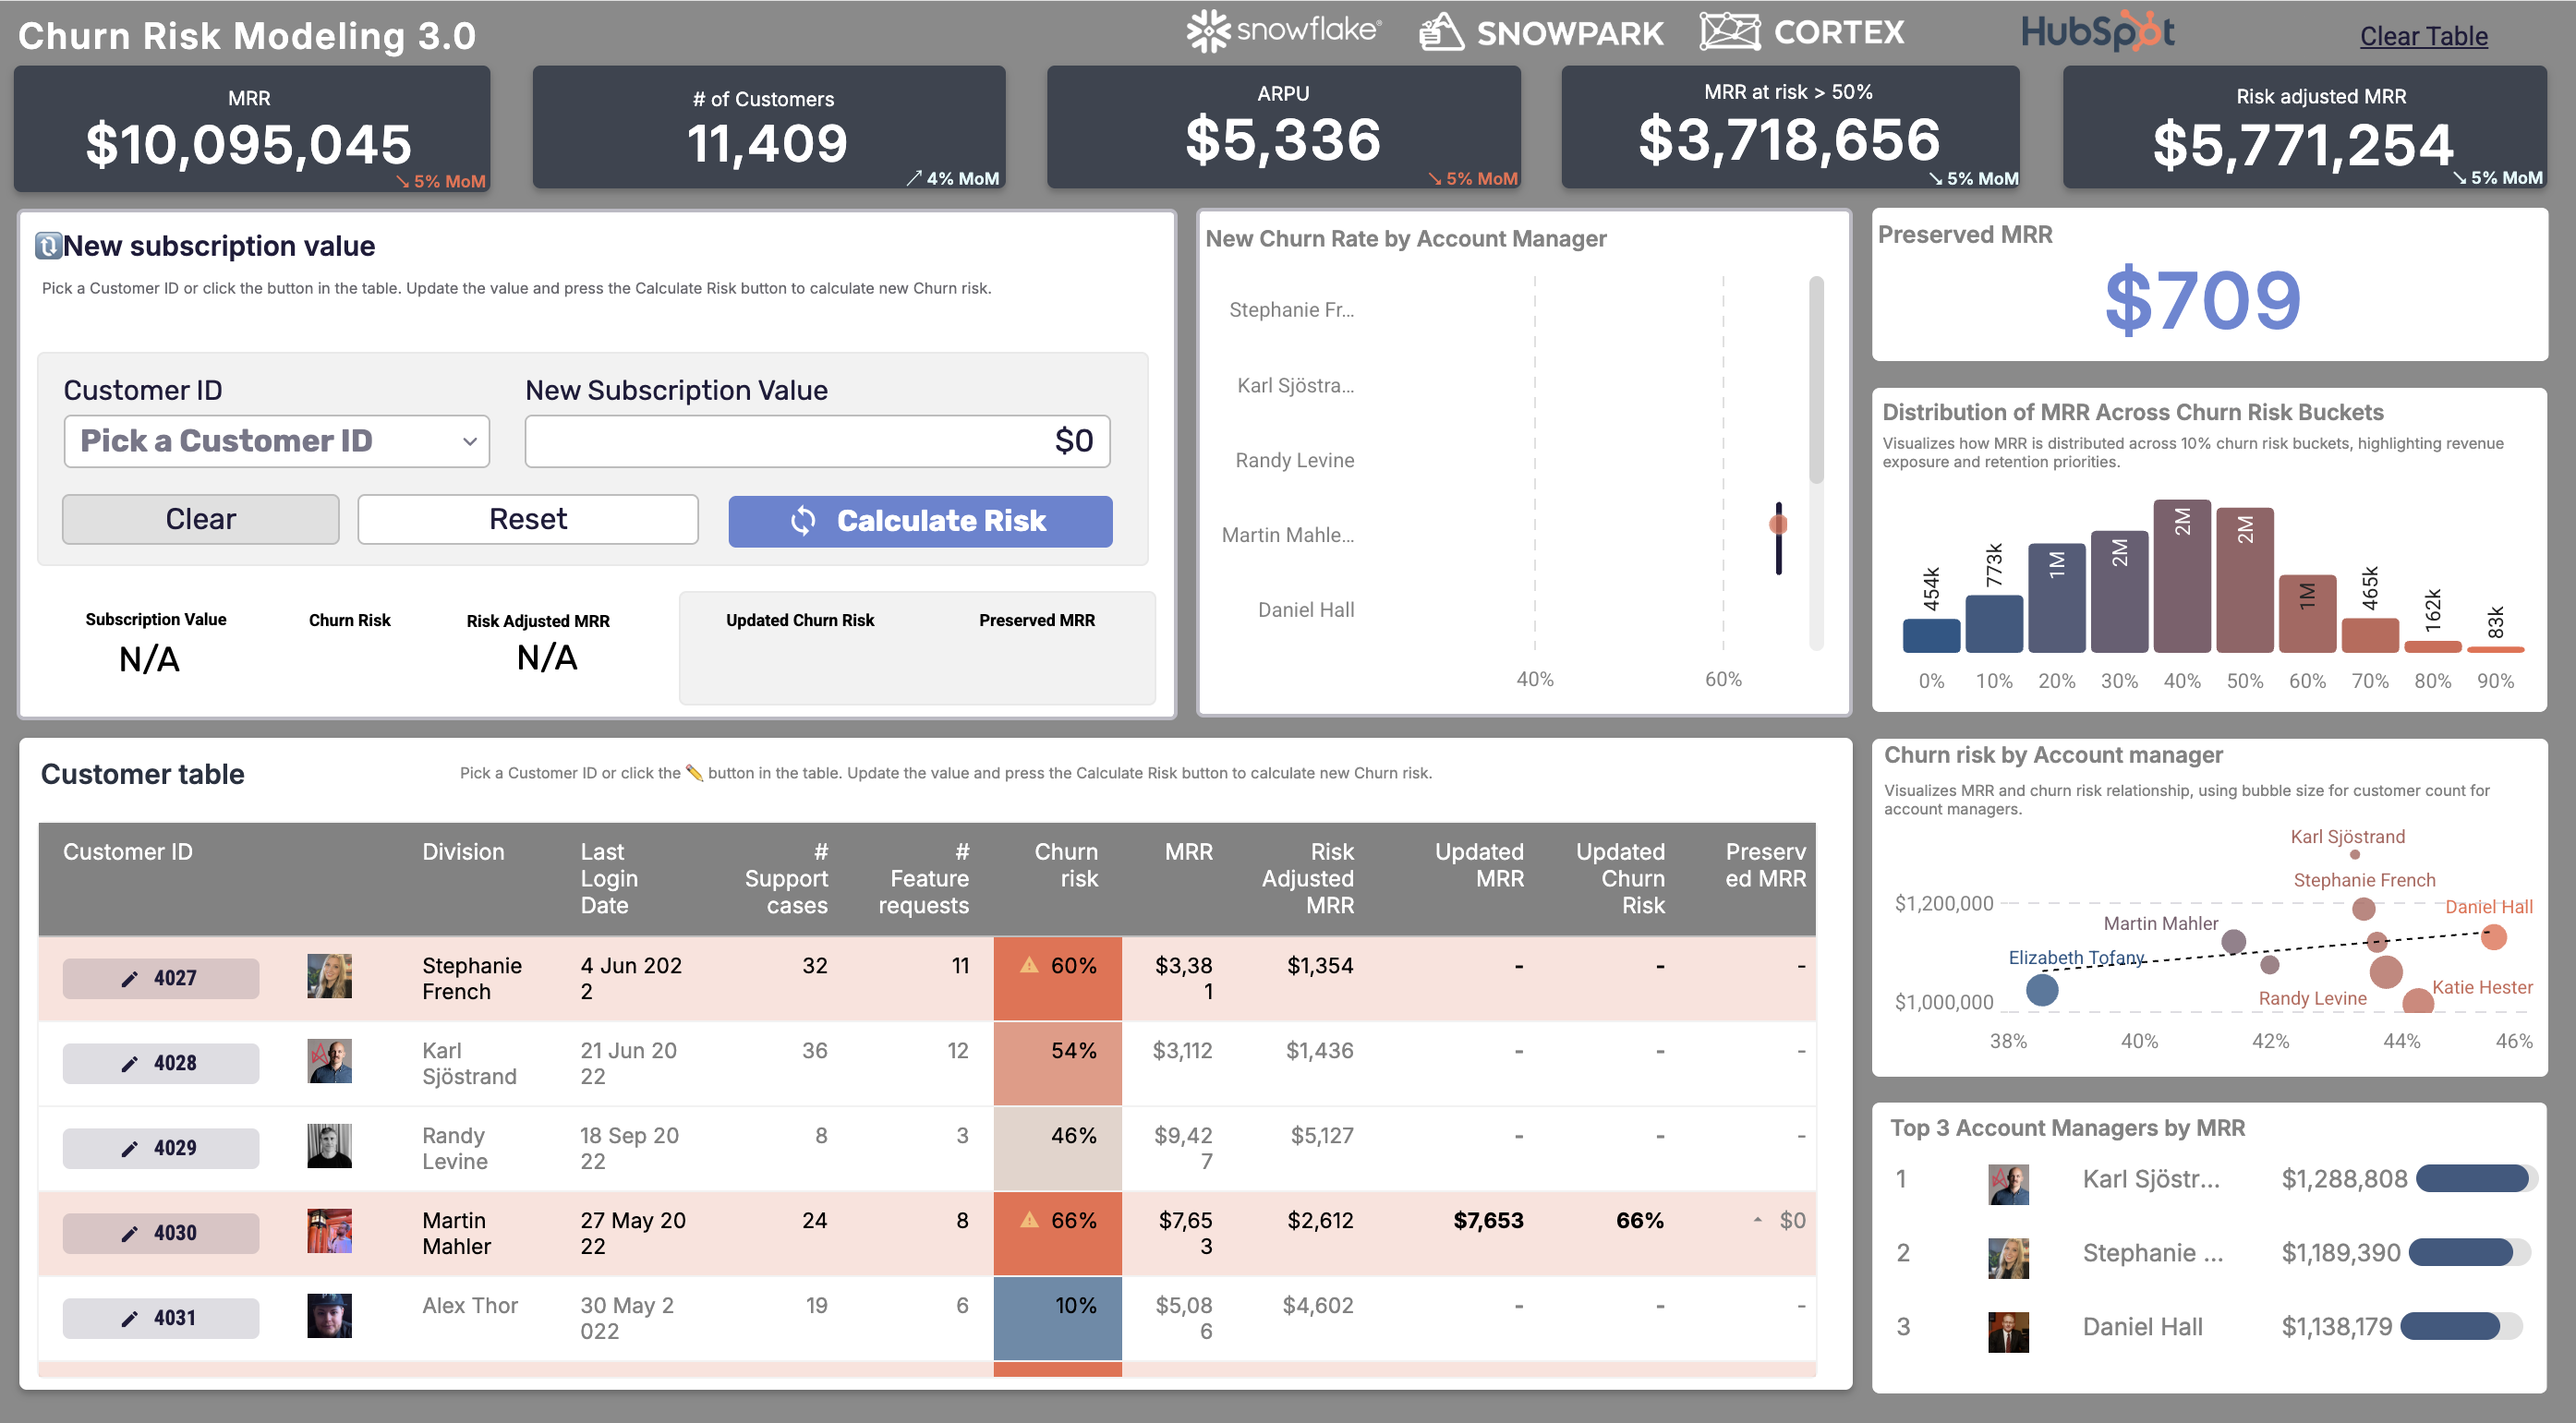
- Price Modeling & Churn Risk: Adjust a customer’s recurring revenue and model the churn-risk impact instantly — no-code predictive modeling without a data scientist’s time.
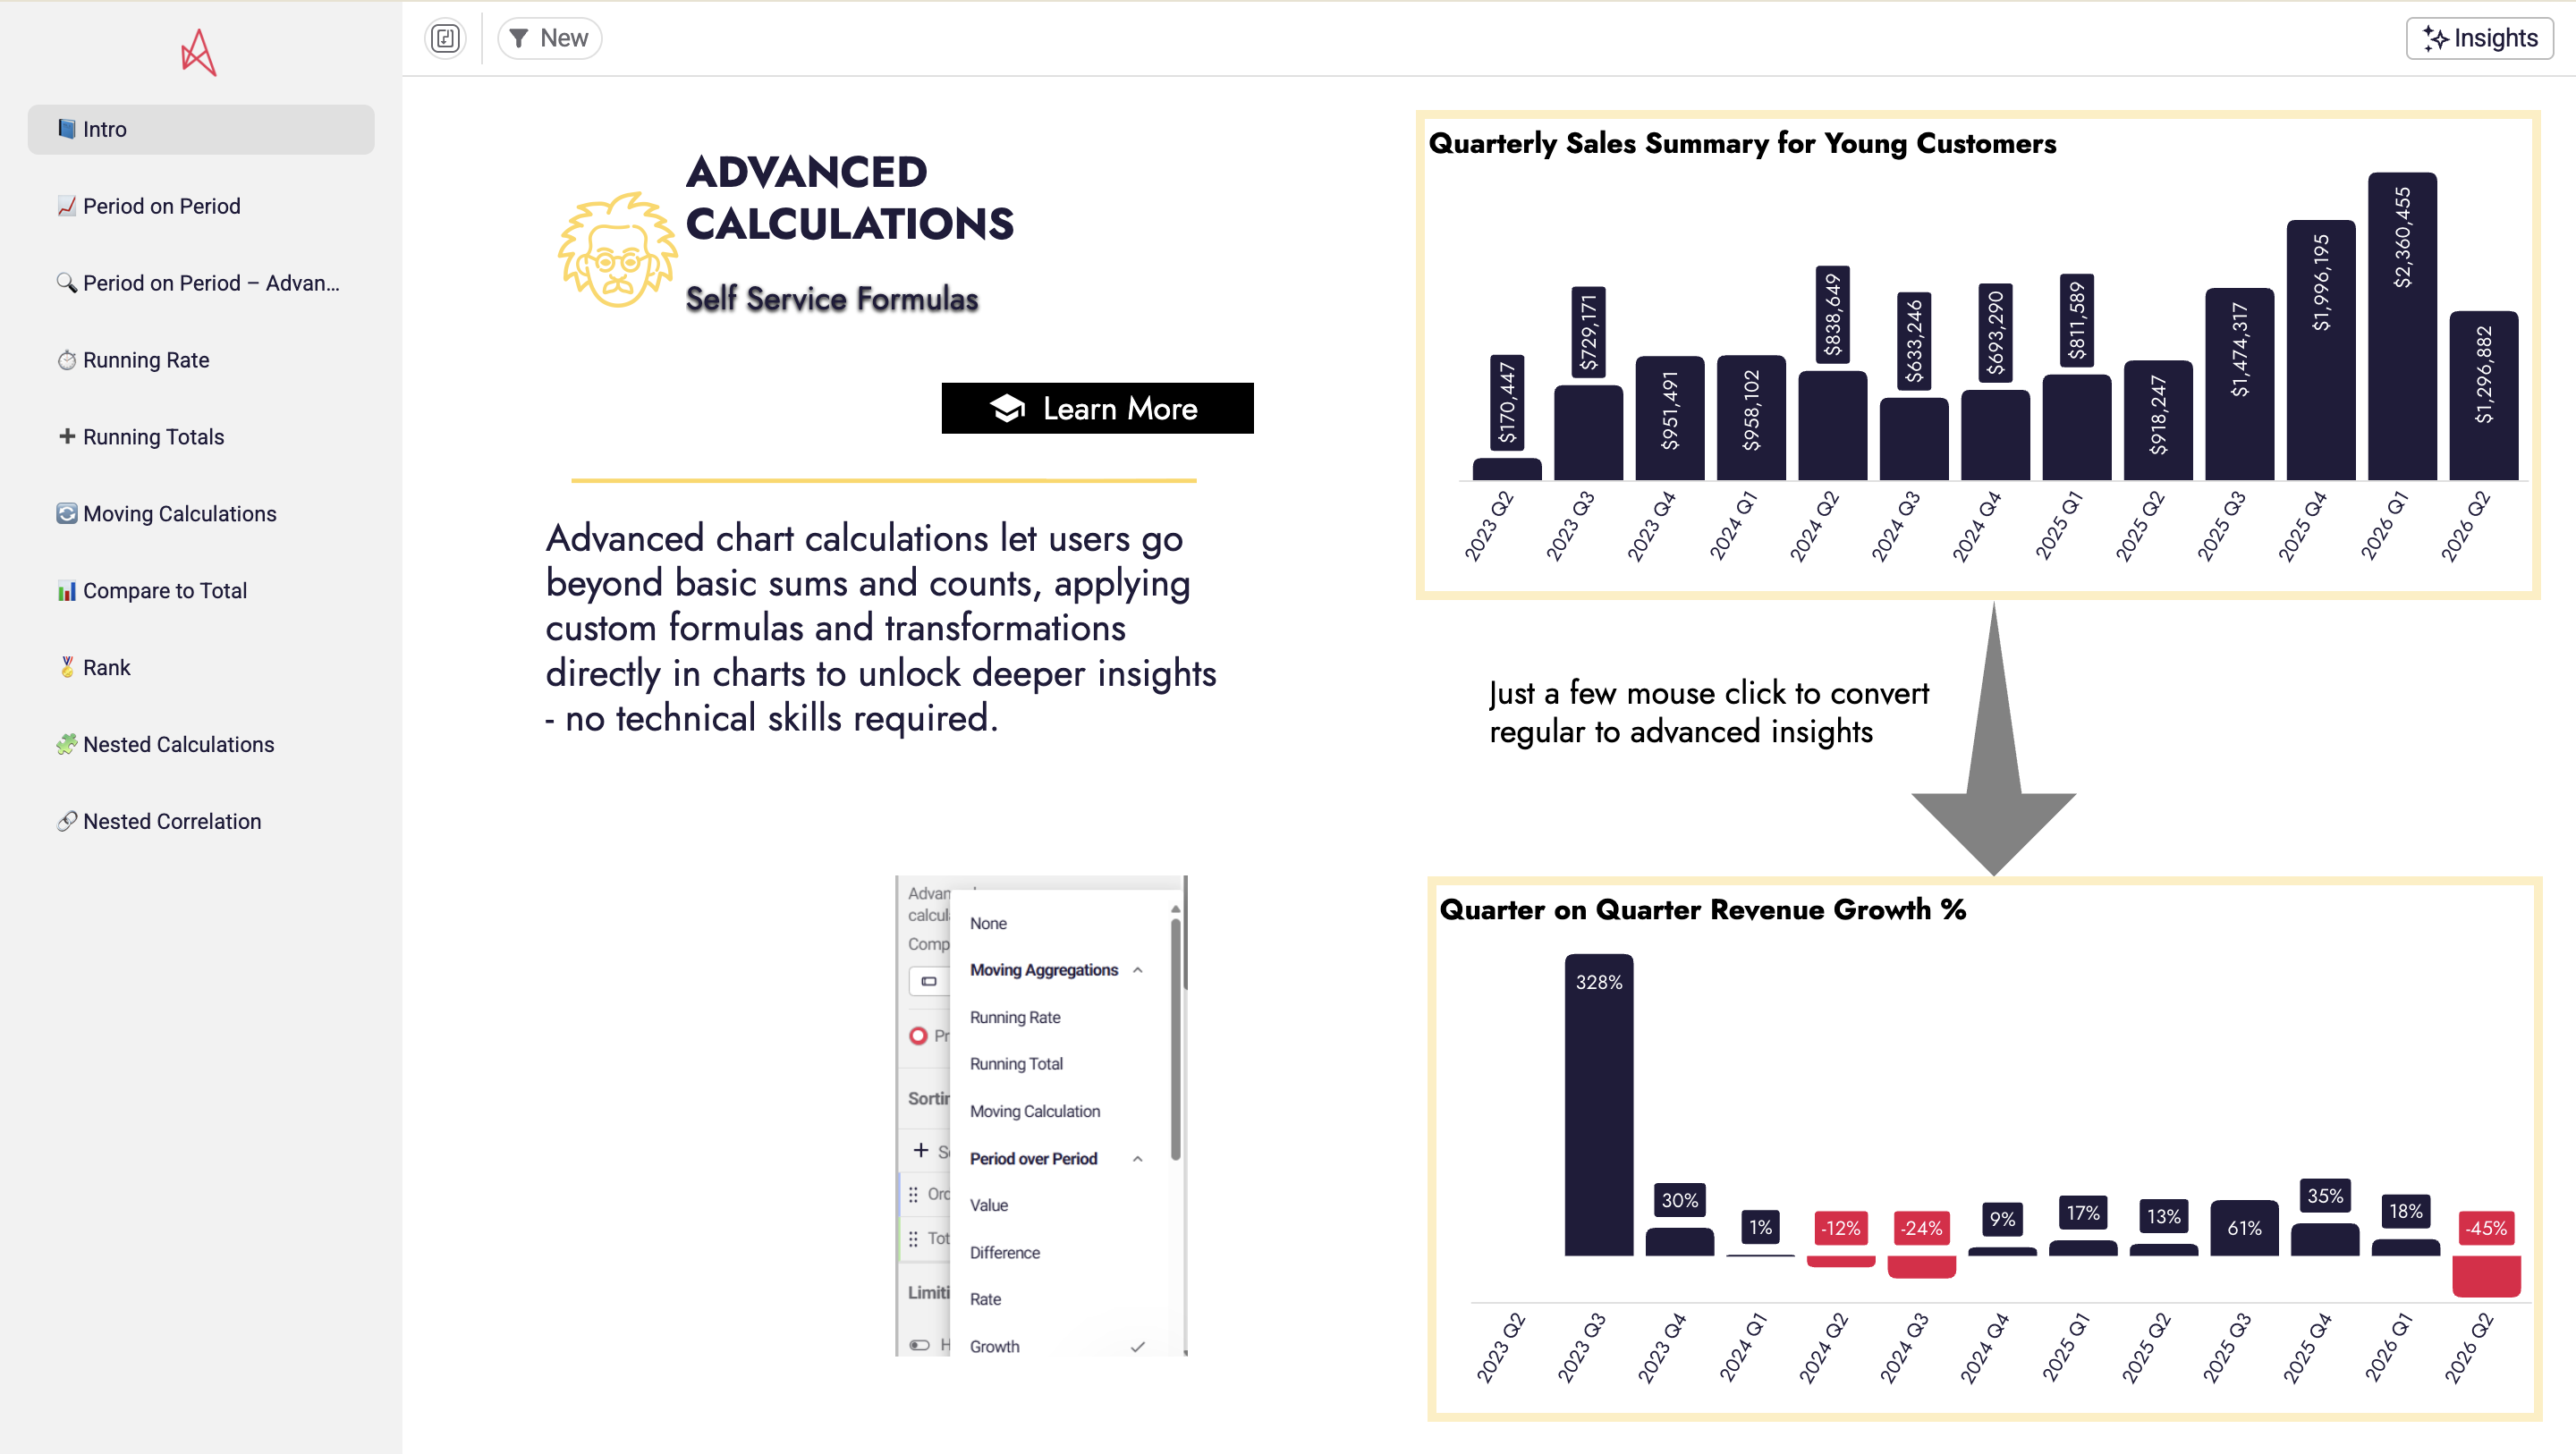
- Advanced Calculations: Build running totals, period-over-period comparisons, and inline % changes with no SQL — the kind of financial modeling finance usually exports to a spreadsheet to do.
AI and the future of finance workflows
The next shift in finance analytics workflows is AI in finance — not as a bolt-on chatbot, but woven into the workflow. Generative AI drafts the variance commentary; AI agents answer “why did margin move?” against governed numbers; AI summaries turn a dense report into a readable narrative.
The crucial caveat: AI in finance is only trustworthy when it runs on governed definitions — which is why the semantic layer matters as much as the model. Pointed at a clean, governed workflow, AI accelerates finance; pointed at spreadsheet sprawl, it just produces confident nonsense faster.
Best practices for modernizing finance workflows
- Start with the workflow that’s secretly a system of record. If the close or the budget runs on a workbook that gets emailed around, that’s your first candidate.
- Keep the warehouse as the single source of truth. Run analysis and writeback on governed data so there are no divergent copies to reconcile — and the audit trail is automatic.
- Preserve the output finance depends on. Modernizing the workflow shouldn’t mean losing the branded Excel, PPT, or PDF the board expects — generate it from the same governed process.
- Automate the repetitive, free up the strategic. The goal of finance workflow automation isn’t fewer people; it’s financial analysts spending time on strategic analysis instead of copying exports.
- Govern who can write, not just who can read. Once the workflow includes actions, role-based permissions and an audit trail are non-negotiable.
Frequently asked questions
What is a finance analytics workflow?
It's the repeatable process a finance team uses to turn raw financial data into a decision — collecting data from multiple sources, preparing and reconciling it, analyzing it, reporting it, and acting on the result. It's the finance-specific version of a data analytics workflow, with the added emphasis on action: approvals, adjustments, and sign-offs.
What finance workflows can be automated?
The highest-value candidates are the monthly close and financial reporting, budgeting and forecasting, variance analysis and commentary, and master-data reconciliation. These are high-frequency, manual, and error-prone — so financial workflow automation removes the most effort and risk.
What is financial workflow automation?
Replacing manual, spreadsheet-and-email finance processes with governed, automated ones that run on live data. Instead of exporting numbers and rebuilding them by hand, the workflow validates inputs, routes approvals, and writes results back to the warehouse — with an automatic audit trail.
How does AI fit into finance analytics workflows?
AI can draft variance commentary, summarize reports, and answer finance questions in plain language. The catch: it's only trustworthy when it runs on governed definitions and real-time data. AI on top of spreadsheet sprawl produces confident errors; AI on a governed workflow genuinely accelerates finance.
Do finance teams need to give up Excel?
Not the output — just the manual process behind it. A modern workflow can still generate the branded Excel, PowerPoint, or PDF the board expects, but it generates them from a single governed source rather than from hand-built workbooks, so the numbers are consistent and auditable.
What's the ROI of modernizing finance workflows?
It shows up as reclaimed time and reduced risk. One example: GlobalData's ~250 accountants cut monthly management accounts from four to five person-weeks to effectively a single click — freeing analysts for strategic work and removing a major source of manual error.
Operationalize your finance workflows
Astrato is the warehouse-native BI platform finance teams use to turn reporting, budgeting, and forecasting into governed, real-time workflows — running directly on Snowflake, BigQuery, and Databricks, with writeback, no-code actions, and branded Excel/PPT/PDF output.
Explore the finance demo apps or book a demo to see your close, budget, or forecast as a workflow your team can act inside.
Ready to experience next-gen analytics?
See how Astrato runs natively in your warehouse.

.avif)