How We Made the P&L Readable to People Who Aren't Accountants
Turn a P&L statement only accountants can read into a self-service dashboard anyone can navigate — governed line-item definitions, live warehouse data, drill from summary to transaction.

A profit-and-loss statement holds the answers leadership and ops need — and hides them behind rows of GL codes only finance can navigate. This is how you turn it into a dashboard anyone can read, on live warehouse data, without losing the rigour underneath.
Ask a simple question of most companies’ P&L — why did operating costs jump in EMEA last month? — and watch what happens. The statement lives in a spreadsheet or a static export, structured as dozens of general-ledger lines and subtotals that only the finance team can confidently read. So the question becomes a ticket. Finance re-pulls, re-formats, and sends back a number, and by the time it lands the conversation has moved on.
The P&L isn’t the problem. The fact that only a handful of people can read it is.
The Financial P&L app in the Astrato gallery turns a complex statement into an intuitive dashboard that finance, leadership and operations can all navigate — on live warehouse data, with the line-item definitions governed so everyone reads the same P&L. Here’s what it does, how it’s built, and why the governance underneath is what makes it safe to open up.
Where the P&L gets stuck
A profit-and-loss statement is one of the most-referenced documents in the company and one of the least accessible. That gap is where the friction lives.
- Only accountants can read it. Raw GL codes, subtotals and a hierarchy that isn’t obvious mean leadership and ops can’t self-serve — they depend on finance to interpret it.
- Every question is a ticket. “What’s behind that number?” goes back to the finance team, who re-pull and re-format the same data by hand, again.
- It’s a snapshot. The P&L in the board deck was exported at a point in time. It’s already stale when it’s discussed, and nobody can drill past what’s on the slide.
- Definitions quietly drift. “Gross margin” in the board pack and “gross margin” in the ops review were each built by hand — so they don’t always mean the same thing, and nobody notices until they disagree.
None of this is a numbers problem. It’s an access-and-consistency problem: the statement lives somewhere only finance can reach, defined in ways that aren’t shared.
See it work
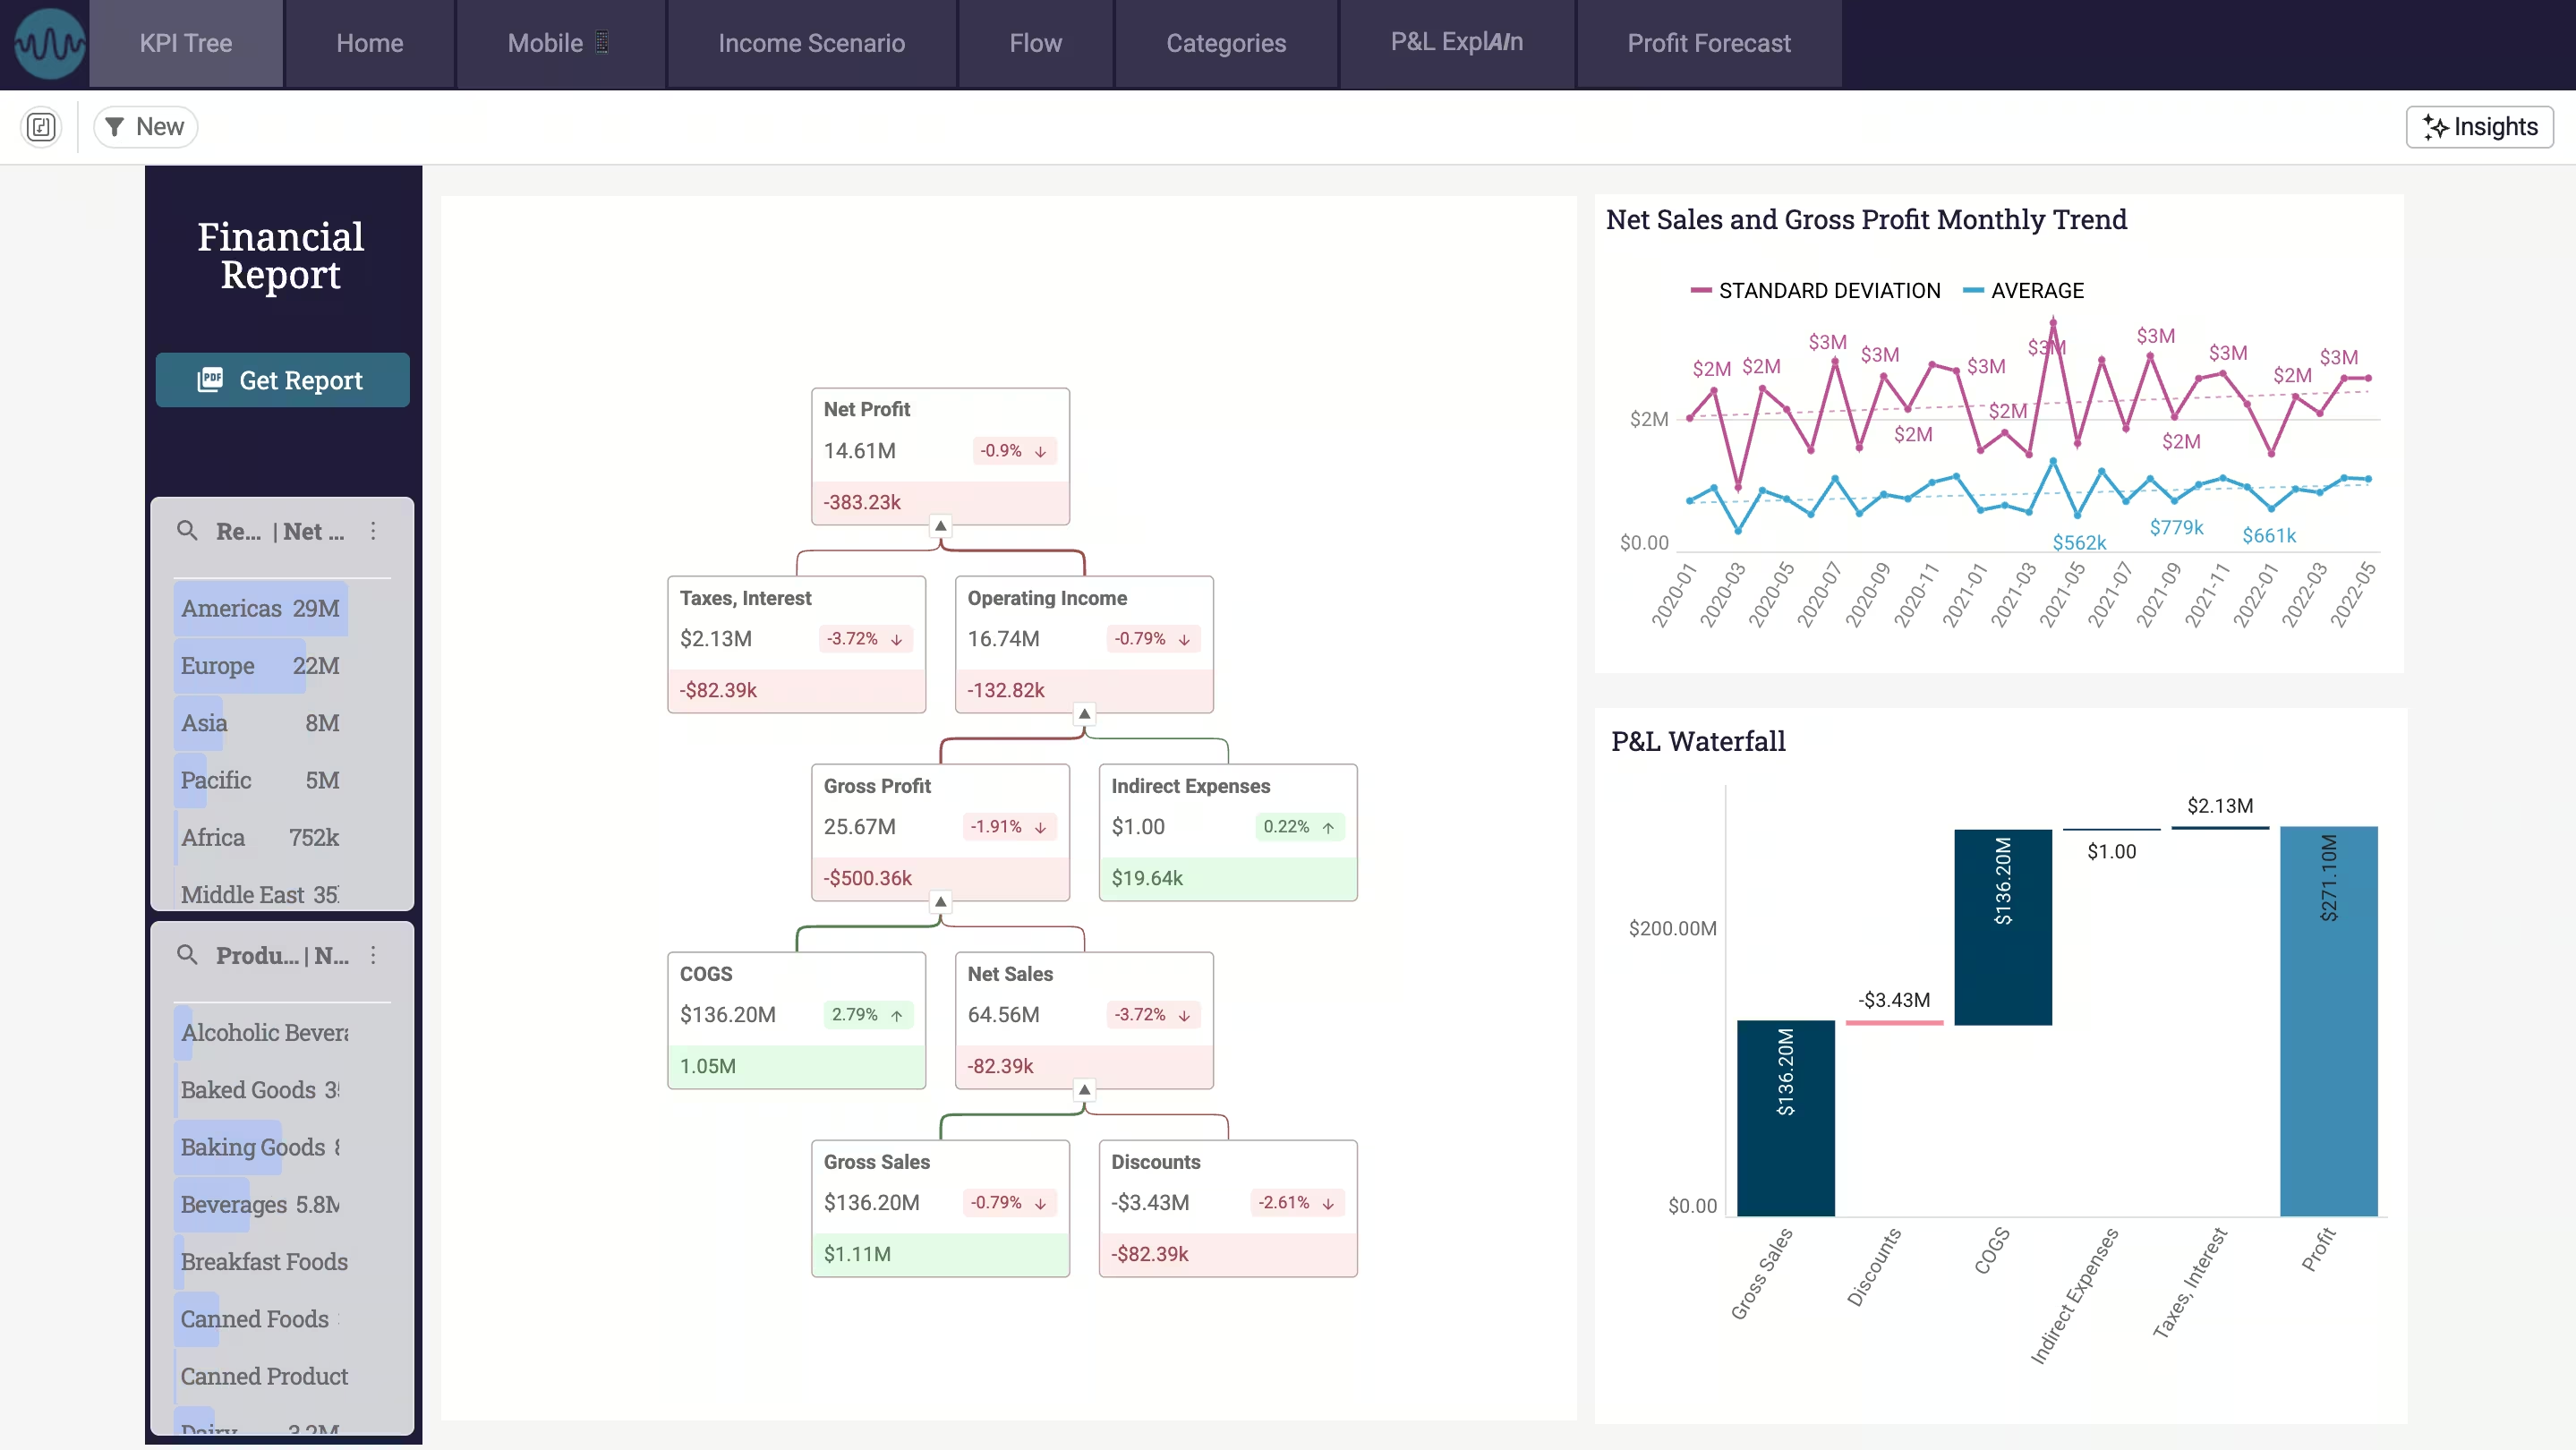
A full profit-and-loss statement, laid out the way finance thinks about it but readable by anyone: revenue, cost of goods, gross margin, operating expenses, the lot. Click a line to see the categories and transactions behind it, filter by entity or period, and answer “why did this move?” without filing a request. The complex statement becomes something the whole business can actually use.
How it’s built
Five steps, on the data you already have:
- Connect to live warehouse data. Point Astrato at your general ledger and financial data in Snowflake, BigQuery or Databricks. The statement reads live, so the P&L on screen is the P&L as it stands, not last month’s export.
- Model the statement in the Semantic Layer Editor. Define the P&L structure once — line items, subtotals and hierarchy — and rename raw GL codes to business-friendly names so a non-accountant can follow it. Define “gross margin” and “EBITDA” here, and every view inherits the same definition.
- Build the statement and visualizations. Lay out the P&L with drilldowns from each summary line to the categories and transactions beneath it, so the answer to “why?” is one click away, not one ticket away.
- Add the finance calculations. Self-service formulas handle margin percentages, period-over-period movement and variance to prior year — defined in the app, consistent everywhere.
- Govern who sees what. Access carries over from the warehouse, so an entity or regional lead sees their own P&L and no one else’s — without you building a separate permission scheme per view.
What changes when the P&L is a self-service data app
Put the statement on live warehouse data with governed definitions and it stops being finance’s private document and becomes something the whole business can read — without losing the rigour.
- Anyone can read it. Business-friendly names and a clear hierarchy replace raw GL codes, so leadership and ops navigate the P&L themselves.
- The “why” is self-serve. Drill from a summary line to the transactions behind it, instead of routing every question through finance.
- Always current. It’s a live query on the warehouse, not a snapshot pasted into a deck.
- One definition of every line. Margin, opex and EBITDA are defined once in the semantic layer, so the board pack and the ops review can’t quietly disagree.
- Finance stops being the bottleneck. The team answers fewer “can you re-pull this” requests and spends the time on the analysis only they can do.
Why it holds up
Opening the P&L to more people only works if the numbers stay trustworthy, and that’s the point of doing it this way. Every line traces to a definition set once in the semantic layer, so a wider audience doesn’t mean more versions of “margin” — it means one. The data never leaves the warehouse, so there’s no exported copy to secure or go stale, and access is inherited from the warehouse rather than rebuilt per dashboard. It’s the same governed-foundation idea Ceres Pharma leaned on to unify master data across 14 acquisitions: consistency comes from the layer underneath, not from everyone agreeing to format their spreadsheet the same way.
Make it yours
Open the Financial P&L app in your workspace, point it at your own ledger, and give the whole business a P&L it can read. It’s the “read” half of a governed finance surface — pair it with the Budget-vs-Actuals app, where the same governed data becomes something finance can act on, not just review.
Key takeaways
- A P&L only creates value when more than finance can read it — the barrier is access, not the numbers.
- Defining line items once in the semantic layer means the board pack and the ops review read the same P&L.
- Drilldowns turn “why did this move?” from a ticket into a click.
- Running it live on the warehouse keeps the statement current and the governance inherited, not rebuilt.
Ready to experience next-gen analytics?
See how Astrato runs natively in your warehouse.