How We Put 108 Million Rows of Logs on Screen Without an Extract
Query 108 million rows of machine telemetry live on ClickHouse — no extract, no sampling, no pre-aggregation. Filter, compare, and spot anomalies on raw time-series data.

Most BI tools don’t analyse your big operational data. They analyse a smaller, older copy of it. This is what it looks like to filter, compare and hunt anomalies across 108 million rows of raw machine telemetry, queried live — nothing extracted, nothing sampled.
Point a traditional BI tool at a few hundred million rows of machine logs and watch what it does. It doesn’t query them. It extracts a slice, samples it down, or pre-aggregates it into summaries — and then shows you that smaller, older copy. It has to, because the tool was built to cache data, not to query it where it lives. So the telemetry you actually analyse is never quite the telemetry you have.
For operational data, that’s exactly backwards. The whole value of machine logs is in the raw resolution — the spike, the anomaly, the one machine behaving differently — and that’s the first thing an extract throws away.
The 108M Rows of Logs & IoT app in the Astrato gallery does the opposite. It queries 108 million rows of machine metrics live on ClickHouse — no extract, no sampling. Here’s what it does, how it’s built, and why querying at the source is what makes analysis at this scale trustworthy.
Where BI breaks at scale
High-volume operational data is where the extract-and-cache model of traditional BI quietly falls apart.
- You analyse a copy, not the data. The tool extracts a subset into its own engine. Everything you see is one step removed from the source, and one refresh behind it.
- Sampling hides the thing you’re looking for. Downsample dense time-series to make it fit, and the rare event — the spike, the outlier machine — is the first casualty. Anomalies live in the rows you dropped.
- Pre-aggregation averages away the signal. Roll logs up to hourly summaries and a 30-second CPU spike disappears into a calm-looking average.
- The copy is always stale. By the time the extract refreshes, the machines have generated millions more rows. You’re debugging the recent past, not the present.
None of this is a chart problem. It’s an architecture problem: the tool copies your data out to analyse it, and at this volume the copy is worse than useless.
See it work
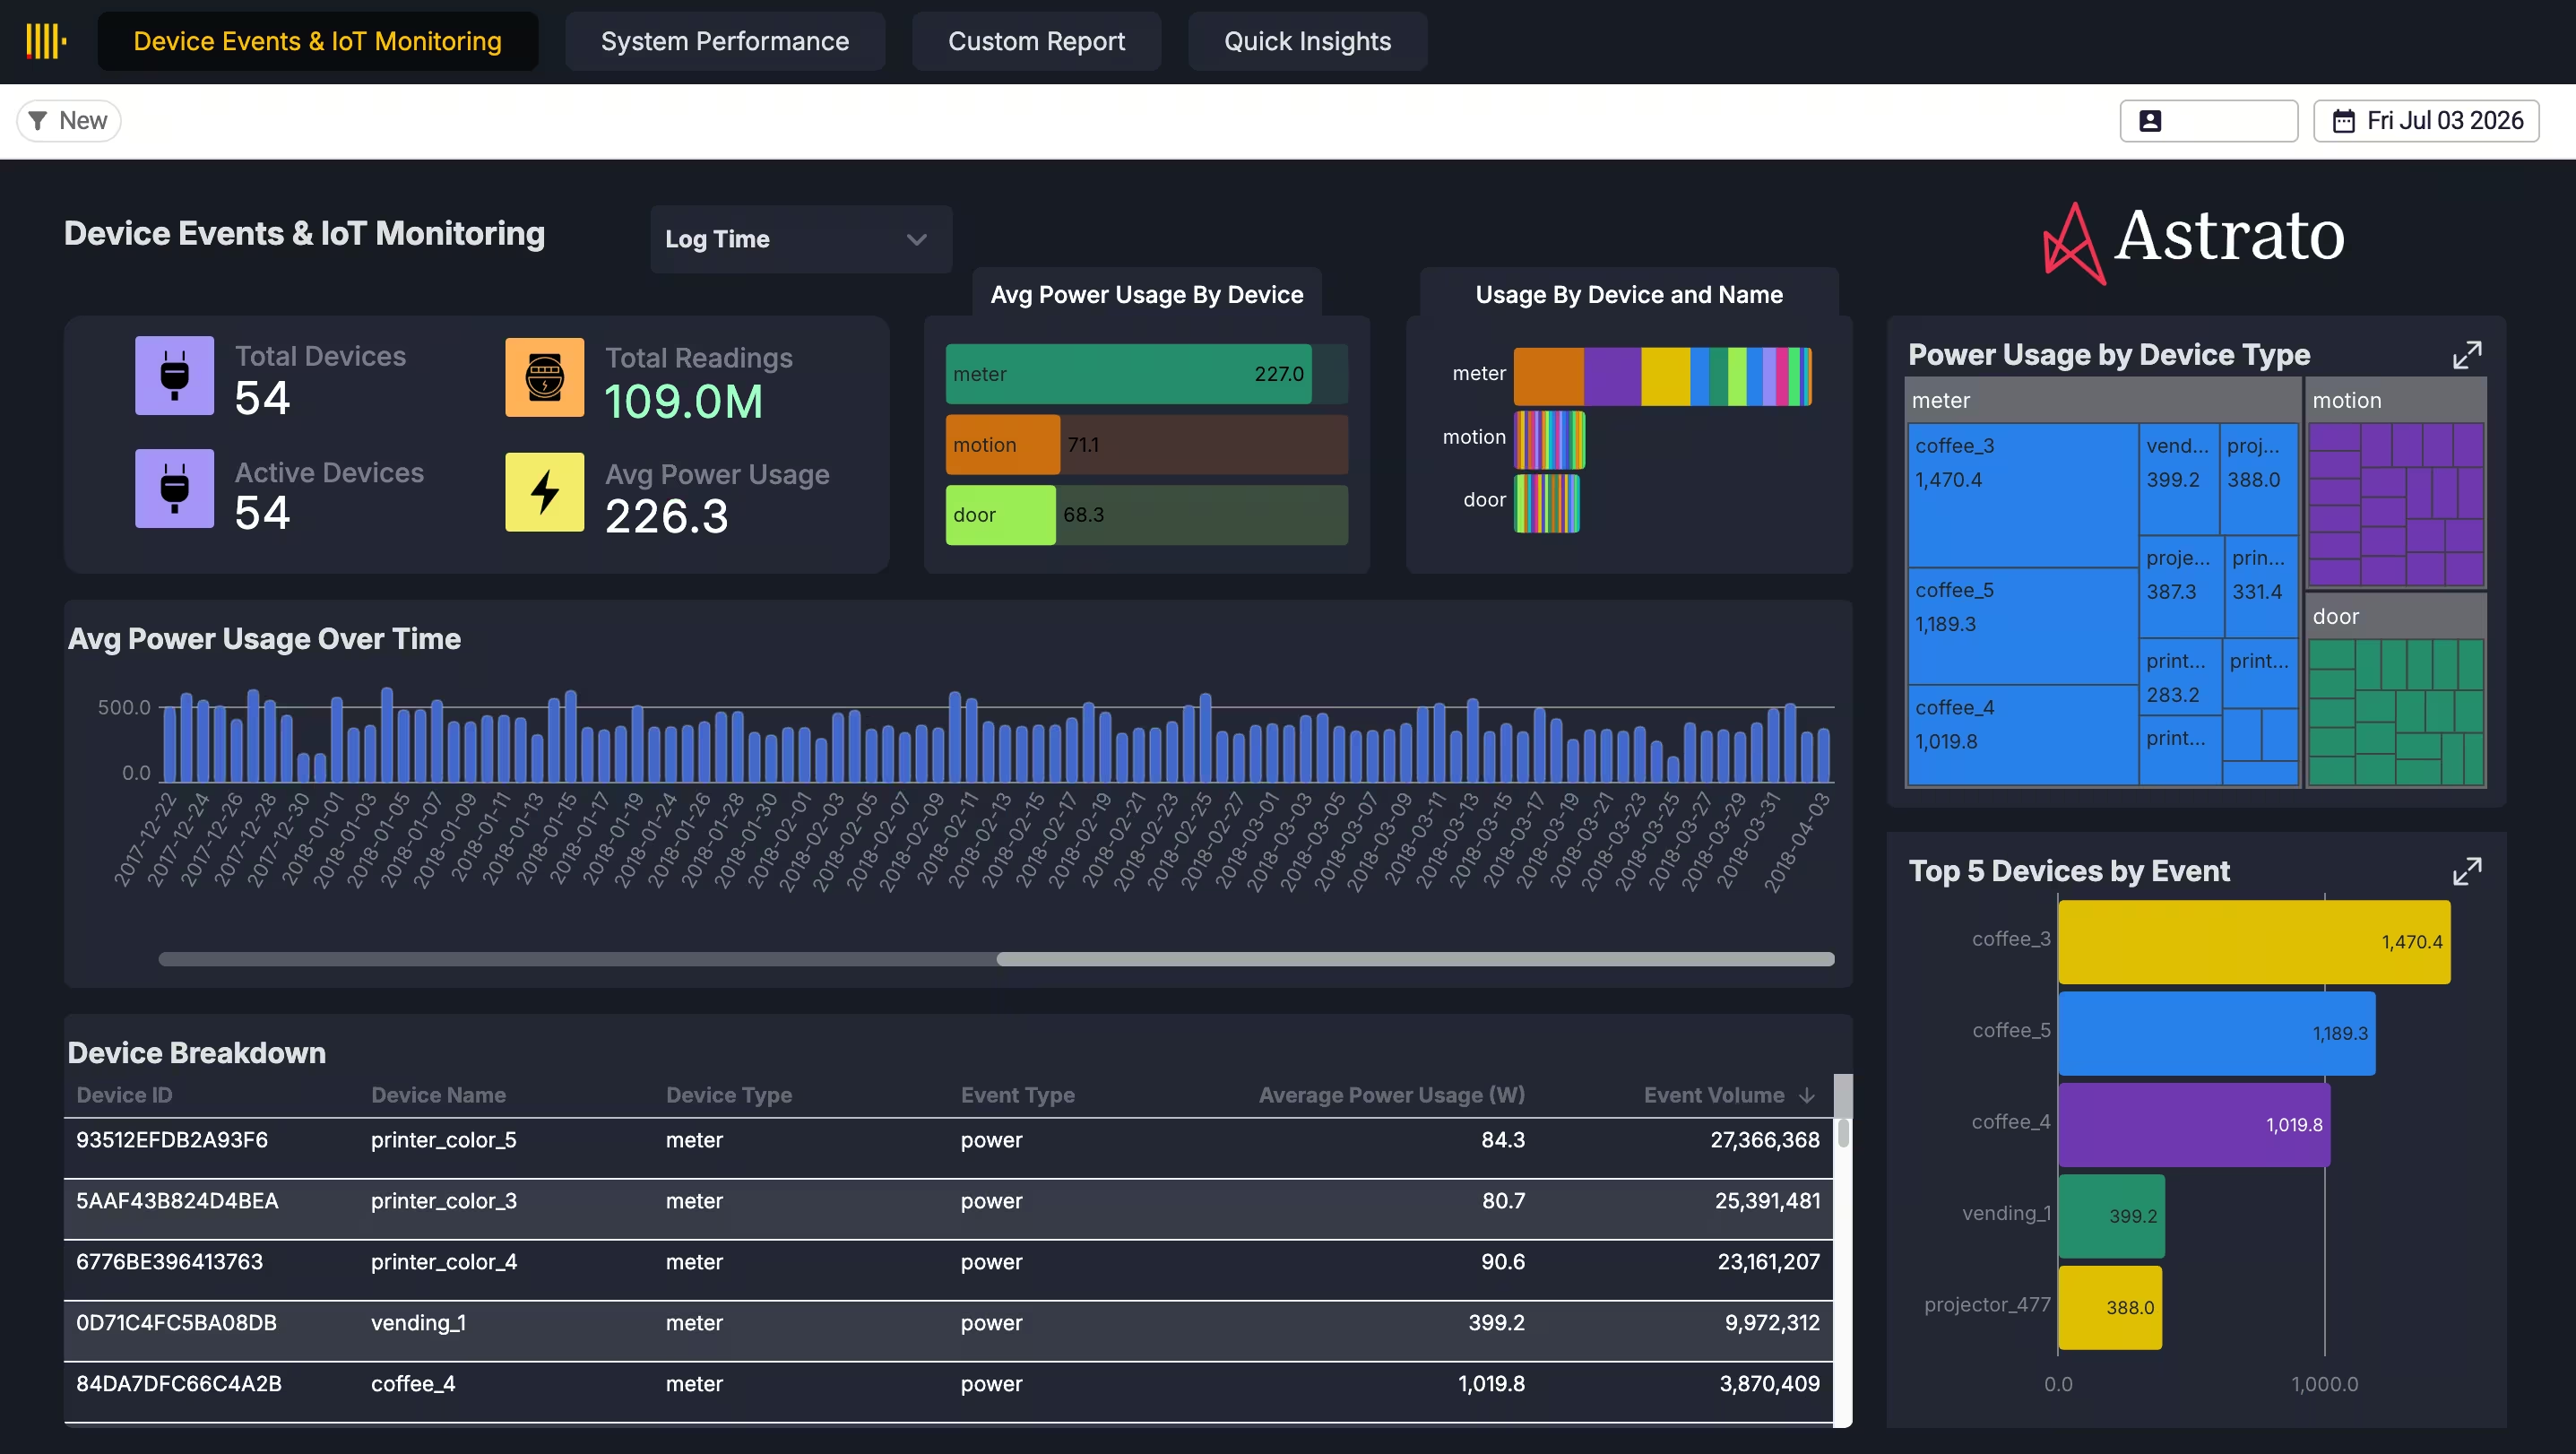
Millions of rows of raw machine metrics — CPU (idle, system, user), memory, disk, load averages, network bytes in and out — across machine groups, built straight from the raw ClickHouse MergeTree tables. Filter to a group, zoom into a window, compare machines, and watch a spike resolve at full resolution. You’re interacting with 108 million rows as if they were a handful, because you’re querying them where they live rather than waiting on a copy.
How it’s built
Four steps, no extract layer:
- Connect live to ClickHouse. Point Astrato at the raw MergeTree tables. Queries run against ClickHouse directly — there’s no extract step and no copy of the data inside the BI tool.
- Model the metrics in the Semantic Layer Editor. Define the dimensions and measures once — machine group, machine, CPU states, memory, disk, load averages, network throughput — so every view reads the same telemetry the same way.
- Build the time-series views. Trends over time, resource spikes, group comparisons and anomaly hunting, all driven by live queries that push the filtering and aggregation down to ClickHouse instead of pulling rows into the browser.
- Let pushdown do the heavy lifting. Because the compute happens in ClickHouse, interaction stays smooth at 108 million rows — you’re filtering a database, not a spreadsheet the tool tried to load.
What changes when you query at the source
Query the data where it lives and the compromises of extract-based BI simply don’t apply.
- You analyse all of it. Every row is in play — no sample, no subset. The anomaly you’re hunting is still in the data.
- Full resolution, so anomalies survive. Raw rows mean a short spike shows up as a spike, not as a rounding error in an hourly average.
- It’s current. A live query reflects the latest rows the machines wrote, not last night’s extract.
- No copy to build, secure, or refresh. There’s no second store of your telemetry sitting in the BI layer going stale and widening your attack surface.
- It scales past this. The same pushdown approach runs interactive dashboards on billions of rows — the gallery has a live 6-billion-row example — without changing how you build.
Why it holds up
Analysis at this scale is only trustworthy if you’re looking at the real data, and that’s the whole point of querying at the source. Astrato is warehouse-native: it pushes queries down to ClickHouse and reads the raw MergeTree tables directly, so there’s no extract engine holding a smaller, older copy of your telemetry. The metrics you filter on are defined once in the semantic layer, so every view counts CPU or load the same way. And because nothing is copied out, the number on screen is the number in the database — 108 million rows, live, with nothing lost between the source and the chart.
Make it yours
Open the 108M Rows app in your workspace, point it at your own ClickHouse logs, and explore your telemetry at full resolution without an extract. It’s the warehouse-native foundation the rest of the platform sits on — the same live-query engine that lets a data app write back also lets you interrogate 108 million rows without copying one of them.
Key takeaways
- Extract-based BI analyses a smaller, older copy of your data — at operational scale, that copy hides the anomalies you need.
- Querying ClickHouse live means all 108M rows are in play, at full resolution, always current.
- Pushdown keeps interaction smooth at scale because ClickHouse does the compute, not the browser.
- No extract means no second copy to secure or refresh — the chart shows the database, not a stale snapshot.
Ready to experience next-gen analytics?
See how Astrato runs natively in your warehouse.