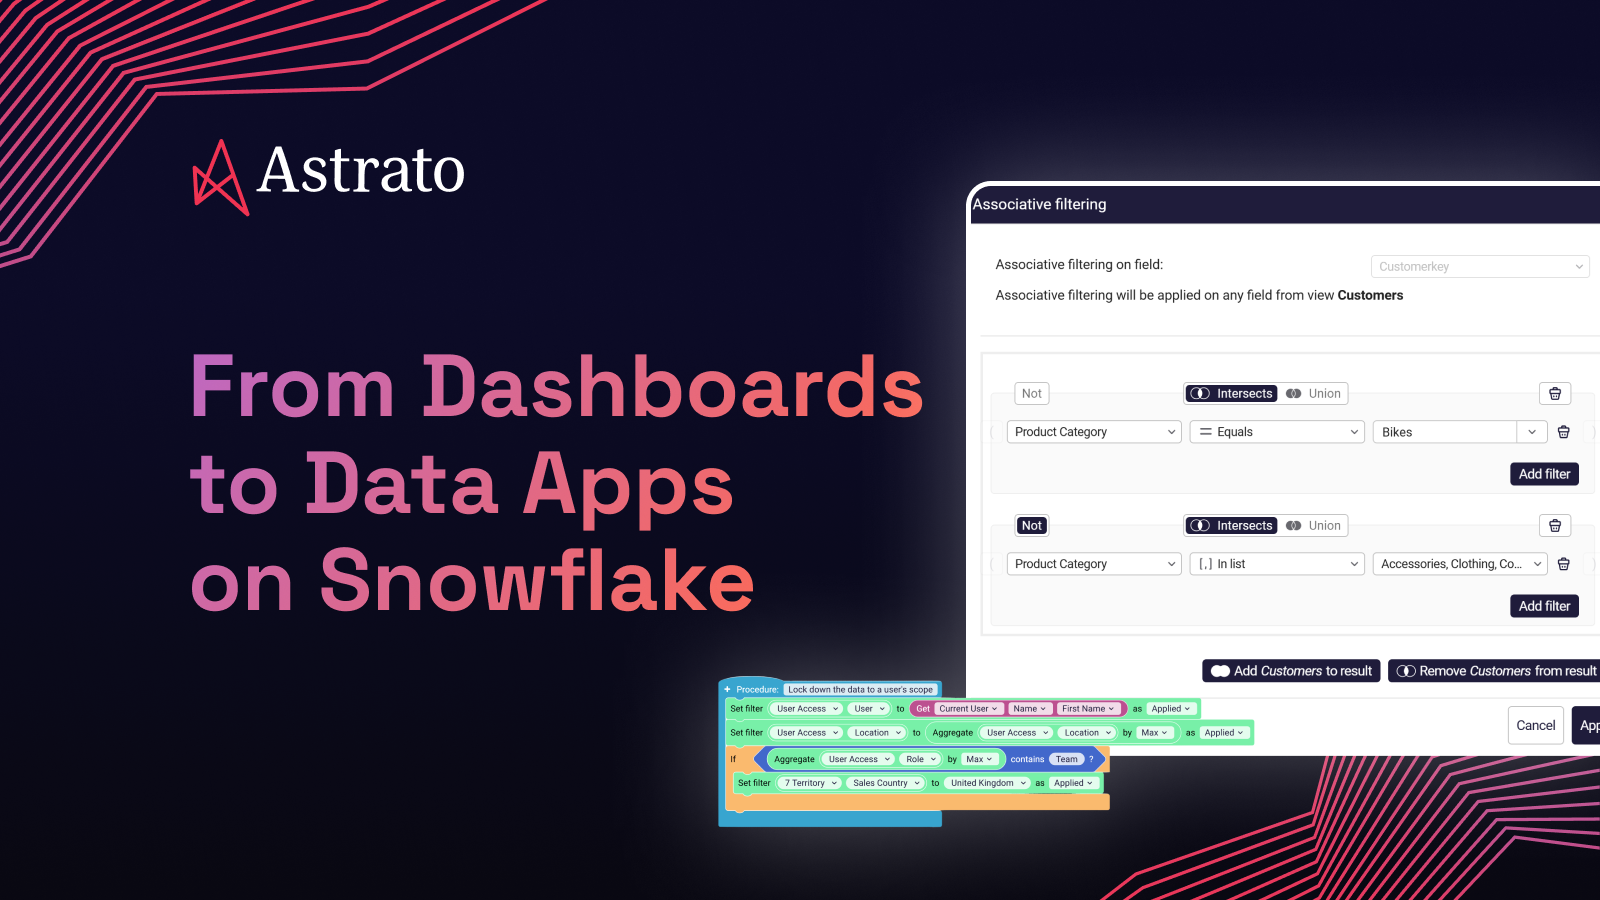
From Dashboards to Data Apps on Snowflake
Dashboards show you what's happening. Data apps let you act on it without switching tools. What that means for your BI stack — and how to know you're ready.

The dashboard has run its course as the dominant analytics artifact. The next-generation tool is the data app — and the migration you just finished is what makes it possible.
The dashboard is having a quiet identity crisis.
For fifteen years it's been the default artifact of analytics. The thing the BI team builds, the thing executives open in the morning, the thing that lives at the end of every data pipeline. Dashboards run our businesses. They're not going anywhere.
But there's a wall everyone has hit. You see the number, you understand the situation, you know what should happen next — and then you switch tools. Email the regional manager. Open the inventory system. Update the budget spreadsheet. File the ticket. Whatever it is, the dashboard hands you off to another piece of software for the actual decision, and somewhere in that handoff the insight goes cold.
That handoff is what's quietly breaking. Not because dashboards are bad — they're great at being dashboards — but because the world wants the next thing. The interface where you don't just see the data, you act on it. Where the analysis and the action live in the same place. Where the BI tool stops being a window and starts being a workspace.
That thing is the data app. And the Snowflake migration most teams just finished — including the warehouse-native BI layer on top of it — is what finally makes data apps real at scale.
This piece is about what the data app actually is, why it needed the migration to be possible, and what changes for the team that decides to build them. Forward-looking, but grounded — no buzzword soup, just the specific thing the category is.
TL;DR
Dashboards show you what's happening. Data apps let you do something about it. The data app is the next-generation analytics artifact — an interface that combines reading and writing, analysis and action, in a single governed surface. It needs warehouse-resident state, warehouse-native security, and live query under transactional integrity. That's why it needed Snowflake (and a warehouse-native BI layer) to exist at scale. For teams who finished the migration, the data app is what the modernization actually unlocks. For teams still running legacy BI, the gap is structural and widening.
What a dashboard does, and what it can't do
Let's give the dashboard its due first. It's been a remarkable run.
The dashboard solved a real problem. Before it, analytics meant printed reports, monthly reviews, and the painful gap between when something happened and when anyone in management noticed. The dashboard collapsed that into something always-on — current state, available to anyone, refreshable on demand. It made organizations less blind. That's a big deal.
What dashboards are great at: situational awareness. The morning "how are we doing" scan. Trend monitoring. Anomaly detection. Conversation-starting in meetings. Any time the right action is look, the dashboard is the tool.
What dashboards aren't built for: anything past looking. The moment you want to change something based on what you see, the dashboard's job is done and someone else's tool takes over. You see that inventory is misallocated across regions — now go file the transfer request in the ERP. You see that a customer's discount expired — now go update it in the billing system. You see that a marketing budget allocation isn't working — now go email the regional teams to reallocate.
Three things break in that handoff:
- The context is lost. The analyst who saw the pattern doesn't write the system-of-record action; the operations person who writes the action doesn't have the analytical context.
- The time gap kills the urgency. What was a real-time decision in the dashboard becomes a 24-hour ticket cycle in the operational tool.
- The action isn't governed by the analysis. Anyone could fire the same action without the analytical context. The "why" doesn't travel with the "what."
This isn't a flaw in any specific dashboard tool. It's a category limit. The dashboard was designed for a world where reading and acting were separate jobs done in separate systems. That world made sense when warehouses were too slow to participate in operational workflows. It doesn't make sense anymore.
What a data app is, specifically
A data app is, in one sentence, a dashboard plus action. Reading plus writing. Analysis plus the place where the analysis becomes a decision. Same surface, same context, same governance.
Let me get concrete, because this is where the category usually gets vague.
Inventory rebalancing
A regional ops manager opens a dashboard showing stock levels across warehouses. The dashboard identifies imbalances — too much SKU A in the Northeast, too little in the Southeast. In a traditional setup, the next step is opening a separate system and filing transfer requests. In a data app, the same surface includes a form: "approve these proposed transfers." The manager reviews, edits if needed, hits submit, and the transfers post directly back to the warehouse tables that the ERP reads. One workflow, one place, full audit trail.
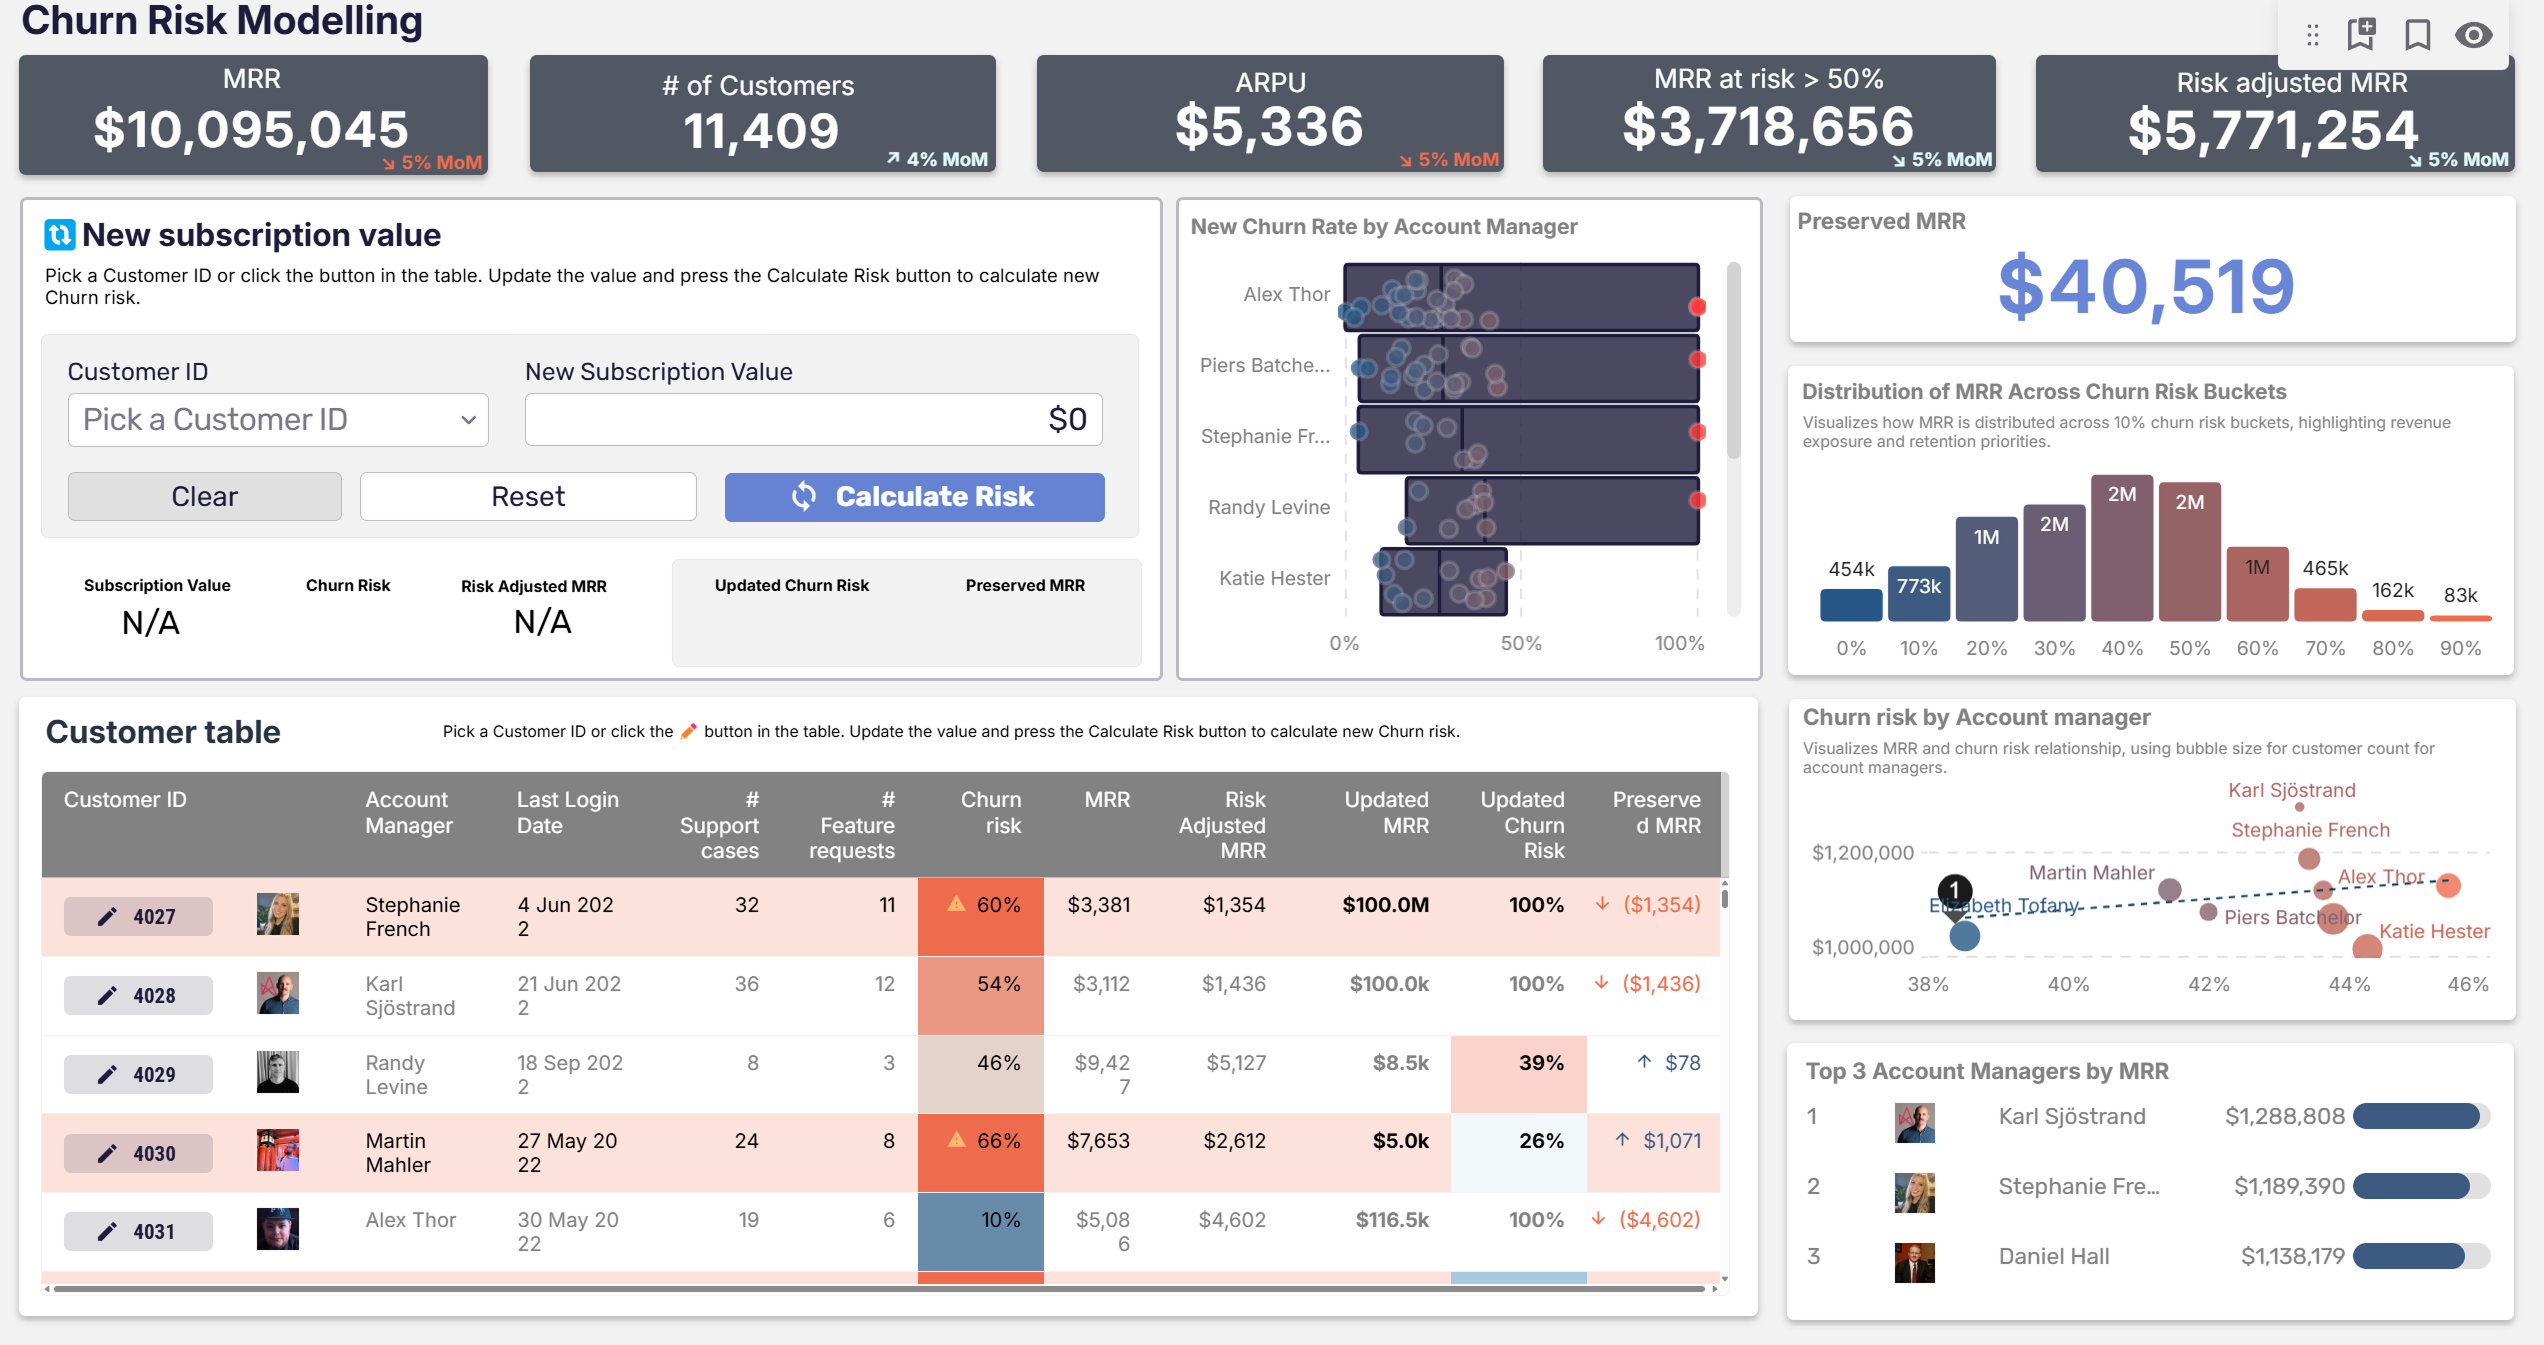
Pricing approval
A pricing analyst sees that a customer segment's margins have drifted out of target. The data app shows the impact of three possible price changes — modeled live against the actual transaction history. The analyst picks one, the approval routes through the analyst's manager, and on approval the new prices write back into the pricing tables. The decision and the action live in the same place. The model that supported the decision is the same model that records why it was made.
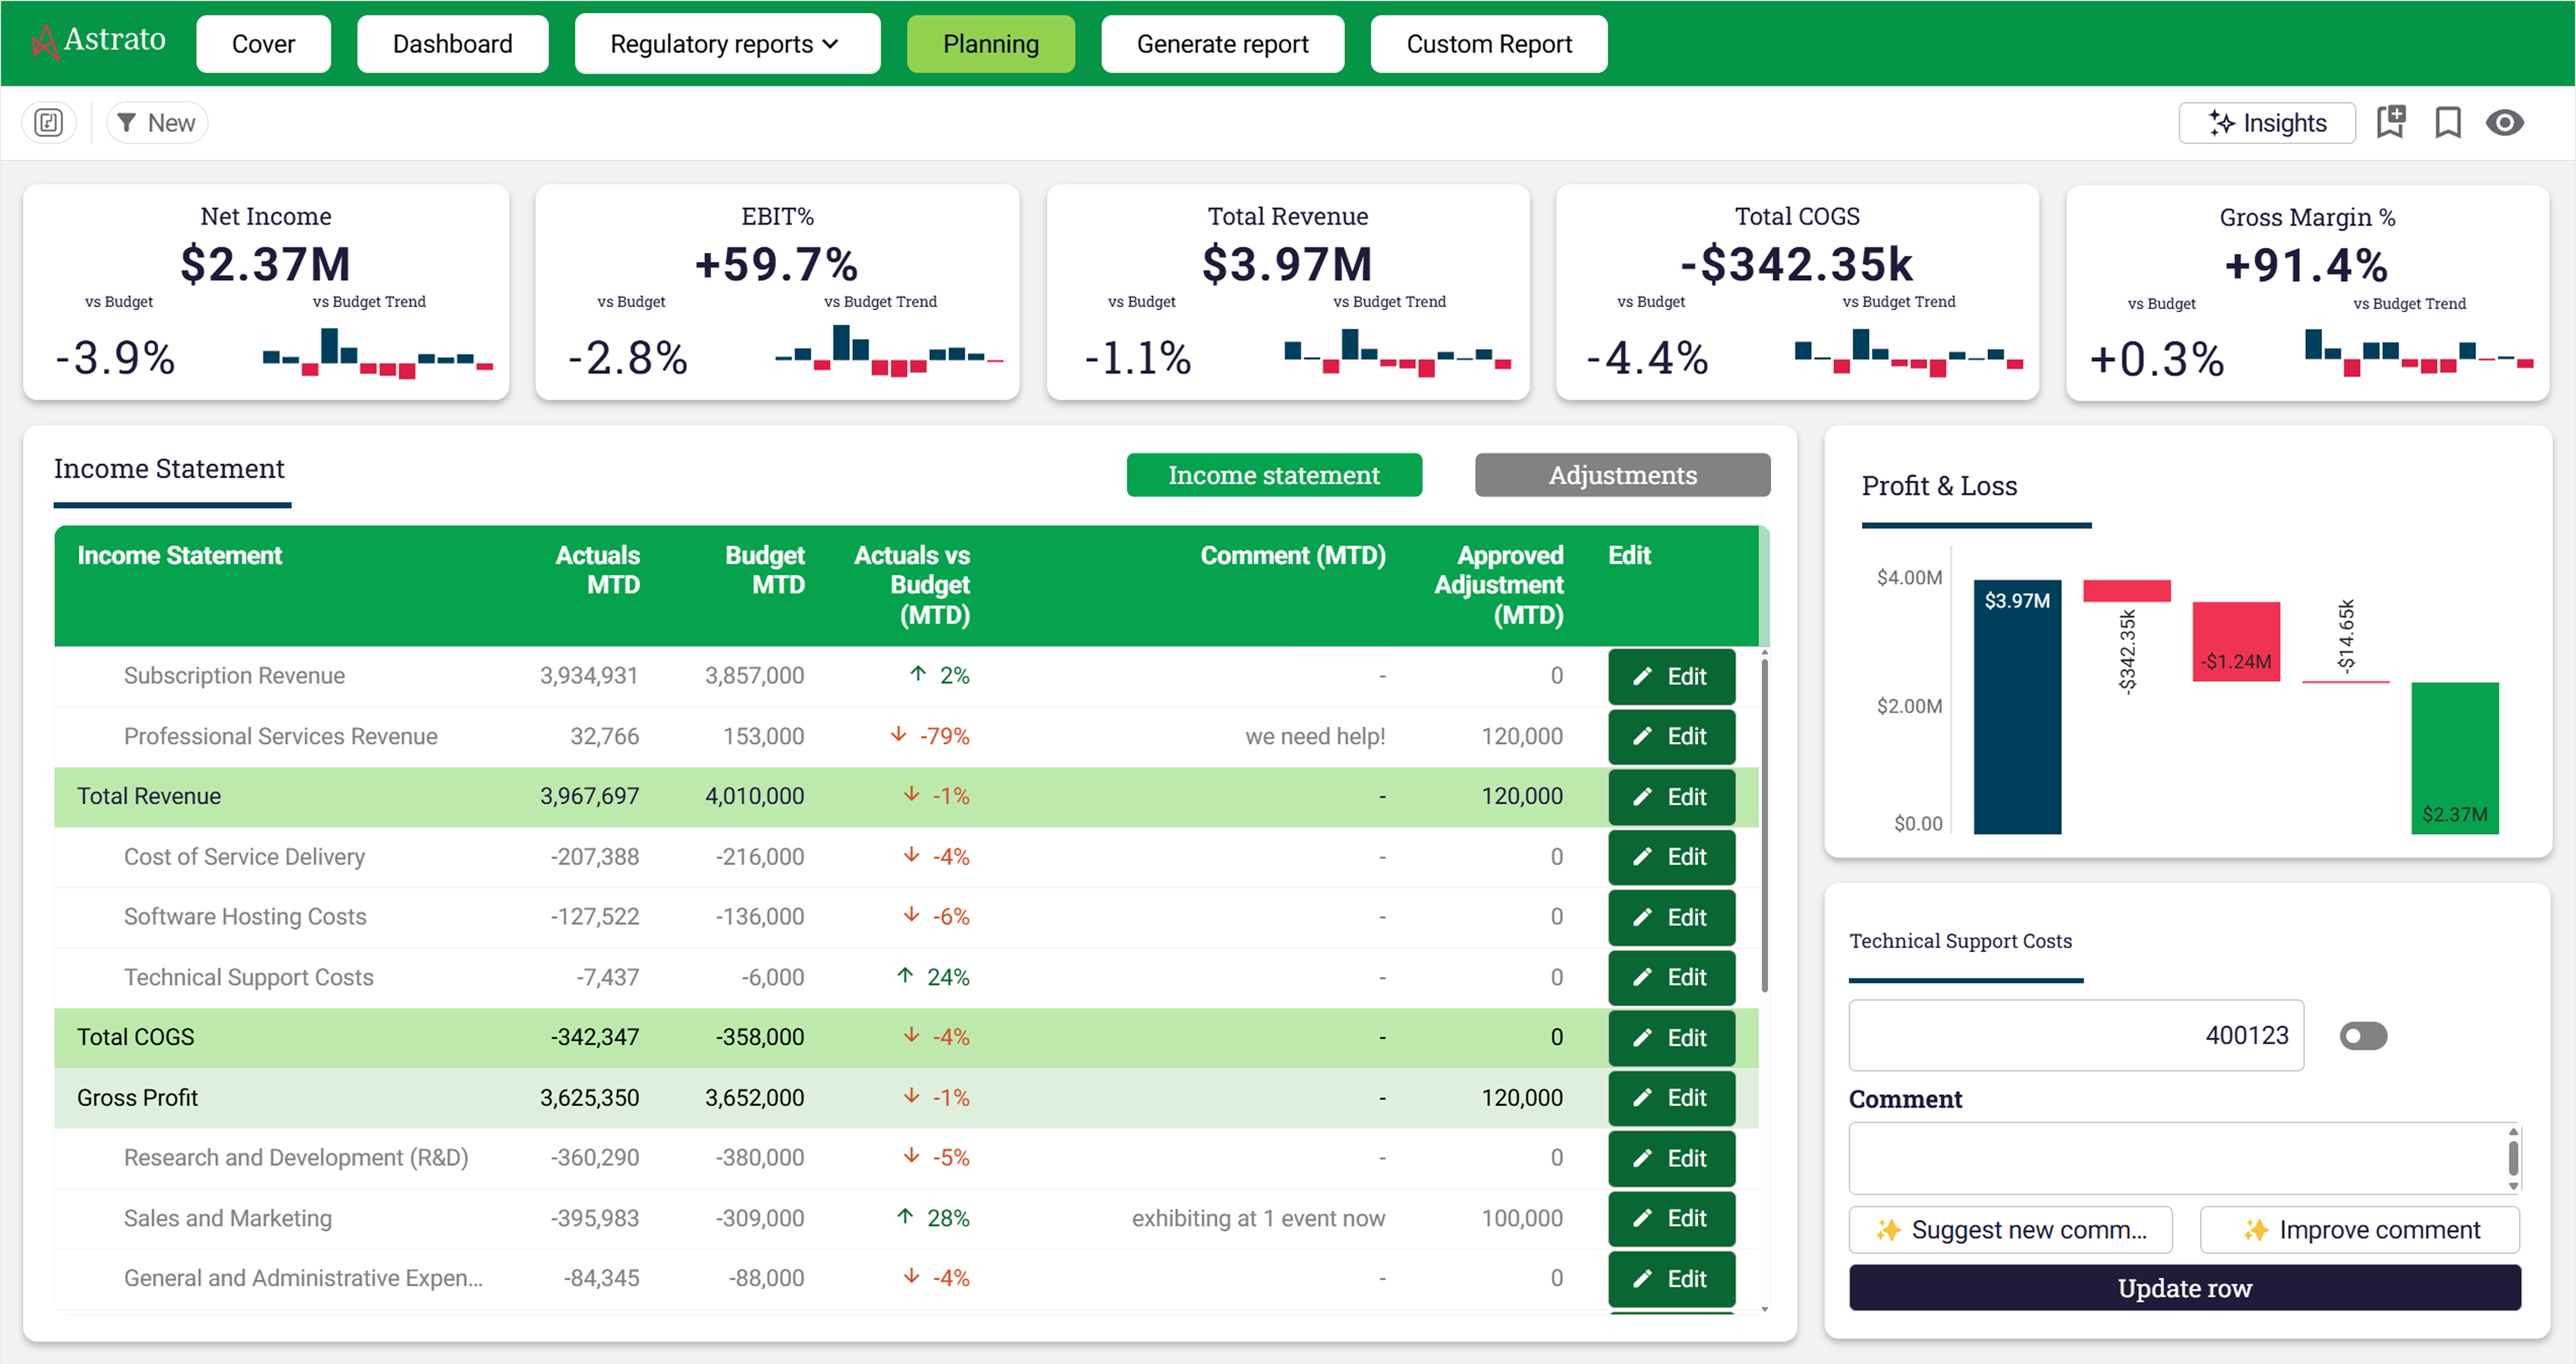
Budget allocation
A field marketing leader opens a dashboard showing campaign performance by region. The dashboard surfaces an unbalanced allocation — three regions over-spent, two regions under-spent. The data app includes a budget allocator: drag the sliders to rebalance, see the projected impact, hit submit. The new allocations write to the finance system through a governed write path. No spreadsheet stage. No re-keying.
These aren't hypothetical patterns. Switch RCM — the behavioral healthcare RCM company who migrated from Qlik to Astrato on Snowflake — runs workflows like this in production for customer-facing operational analytics. Their use case is dense with operational decisions that have to happen on current data, with governance that has to survive a healthcare audit. The data app isn't a marketing pitch for them; it's the working description of what their team actually built.
Three things distinguish this from a dashboard with a form bolted on:
- The action is governed by the warehouse's security model, not a parallel BI-tool security layer.
- The state lives in the warehouse, not in the BI tool's separate database — so every other system that reads the warehouse sees the change.
- The analytics that supported the decision and the data that records it are the same data, in the same place, under the same governance.
That's the category. Not "dashboards with AI." Not "embedded analytics." Specifically: analytical surfaces that can act on the data they show, with the action governed by the same architecture as the analysis.
Why this needed Snowflake (and warehouse-native BI)
The reason data apps weren't a real category five years ago isn't that nobody thought of them. People thought of them constantly. The infrastructure couldn't deliver.
Data apps require four things in combination:
- A place where state can live that's both transactional and analytical. You need to be able to write back, read live, and run analytics on the same store without two parallel databases drifting apart.
- Security that the BI layer can inherit rather than reimplement. When the data app writes a budget allocation, the access control on who can approve which budget has to live with the data, not in the BI tool's parallel security model.
- Live query under transactional integrity. A dashboard built on extracts can't be the surface for an action — the data it's showing isn't the data the action will write against. You need live read and live write under the same architecture.
- A BI tool that treats writing as a first-class capability, not as a feature bolted onto a read-only tool through an extension.
Snowflake is what made the first three plausible. Cloud warehouses with proper transactional capabilities, columnar performance for analytical reads, and governance that the BI layer can inherit. The architectural shift covered in Qlik vs. Snowflake Architecture is the precondition — the warehouse-owns-the-data model is what lets data apps exist.
The fourth piece — a BI tool that writes natively — is where the warehouse-native shortlist splits the field. Some tools added writeback as an extension to a read-only architecture; others built it in. The difference shows up immediately in production. Extensions break, lack governance integration, and don't scale past pilot use cases. Native writeback survives audit, scales to many simultaneous users, and behaves like a real application.
This is the architectural reason data apps weren't possible in legacy BI. Qlik's reload model meant the data in the dashboard wasn't the data the action would write against. Tableau's extract model has the same problem. The migration to warehouse-native architecture isn't just a modernization of analytics — it's the precondition for analytics becoming operational.
What this means for the BI team
The honest part. Data apps are real work, and the team that builds them looks different from the team that built dashboards.
The skill set shifts. Dashboard design rewarded layout sense, visual hierarchy, the ability to pack a lot of context into a small space. Data app design rewards workflow thinking — what state does the user start in, what action are they taking, what governance does the action need, what happens after. Less Adobe-XD instinct, more product-manager instinct.
The SQL gets harder. Dashboards mostly read; data apps read and write, which means transactional patterns, idempotency, audit logging, error handling on writes. The BI developer who could ship dashboards in a week needs new patterns to ship a data app in a week.
The org chart shifts. Building a data app means working with the people who own the data the app is going to modify — usually engineering, sometimes the operational team that runs the source system. BI teams who used to operate as a separate function start collaborating across the stack in ways legacy BI never required. This is mostly upside — the BI team becomes more central, more strategic, more visible — but it's also more political. Stakeholder management is part of the job now.
The dashboard isn't going away. Most BI teams running data apps still ship more dashboards than data apps, because most analytics use cases are still read-only and that's fine. The data app is the additional capability that the warehouse-native architecture unlocks, not the replacement for everything that came before.
For teams still consolidating their migration, data apps are a year or two out. For teams who've finished and are looking at the next strategic move, this is the move. The Complete Guide to Migrating from Qlik to Snowflake covers the migration itself; this piece is about what comes after.
Three signals you're ready
Not every team should jump to data apps. Here's how to tell if the move makes sense for yours.
Signal 1: your dashboards are already mature
Data apps aren't a workaround for not having good dashboards. If your team is still consolidating reporting fundamentals — single source of truth, governed metrics, broad dashboard adoption — finish that first. Data apps work best when they sit on top of a mature analytical foundation, not as a replacement for missing one.
Signal 2: your business users are routinely making decisions that involve switching between the dashboard and another tool
This is the diagnostic question. Watch what your power users actually do. If they open the dashboard, see the data, and then alt-tab to a spreadsheet or operational system to do anything with what they saw, you have a data app opportunity. Count those workflows. The high-frequency ones are the ones worth building as data apps first.
Signal 3: your warehouse and BI architecture can support writeback under governance
This is the technical precondition. If you're on Snowflake and a warehouse-native BI tool, you have what you need. If you're still on legacy BI or running BI through extracts, the data app conversation is downstream of the architectural conversation — which is what the rest of this cluster is about, particularly the migration readiness checklist.
If you have all three signals, the question isn't whether to build data apps; it's which workflow to start with. Pick the one with the highest friction in the current dashboard-plus-other-tool workflow, and rebuild that single workflow as a data app. Iterate from there.
Frequently asked questions
Is "data app" just embedded analytics with a fancier name?
No. Embedded analytics is BI rendered inside another application — the BI tool is the renderer, the application is somebody else's product. A data app is the application — the analytics and the workflow are built in the same surface, by the same team, on the same BI platform. Embedded analytics is read-only by default; data apps are read-and-write by design. Different category, even when they look similar from the outside.
Can we build data apps on Tableau or Power BI?
Limited, and the limit is architectural rather than feature-related. Tableau's writeback is via extensions and works for small pilots but doesn't scale to multi-user governed workflows. Power BI's writeback works through Power Apps integration, which means leaving the BI surface for an action — closer to a dashboard-plus-handoff than a true data app. The extract-based architecture is what makes governed writeback hard, not the vendor specifically. The shortlist piece covers the architectural camps in detail.
Won't this turn the BI team into application developers?
Partially yes — and that's the point. The line between "BI" and "application development" has been blurring for a decade, and the data app is what finally crosses it. The team's instincts shift from layout-design toward workflow-design, but the underlying skills (SQL, modeling, understanding the business) are the ones BI teams already have. The new layer is product thinking, not full-stack engineering.
How do we govern a data app the way we govern a dashboard?
Better than a dashboard, in most cases. Because the writes happen through the warehouse's governed SQL layer rather than through a parallel BI-tool security model, the same access controls that govern any other data action govern the data app. The audit trail is the warehouse's audit trail. Every write logs. This is one of the reasons regulated industries — healthcare, financial services — have been early adopters; the governance is better than the spreadsheet-and-email status quo they're replacing.
Is this just an Astrato thing?
No. The data app pattern is happening across the modern data stack — Hex builds it through notebooks, Sigma through input tables, Retool from the operational-app direction, and Astrato builds it as part of warehouse-native BI. Each has a different angle. Astrato's angle is that the BI surface is the data app surface — same governance, same models, same place. Others put the BI and the app in separate surfaces, which works for some use cases. The category is real and the vendors approach it differently; this piece is about the category.
Ready to experience next-gen analytics?
See how Astrato runs natively in your warehouse.


.avif)