Dashboards or Apps? When a Weekly Decision Needs an App
When does a dashboard stop being enough? Learn when recurring business decisions need an app built around scenarios, actions, and outcomes.

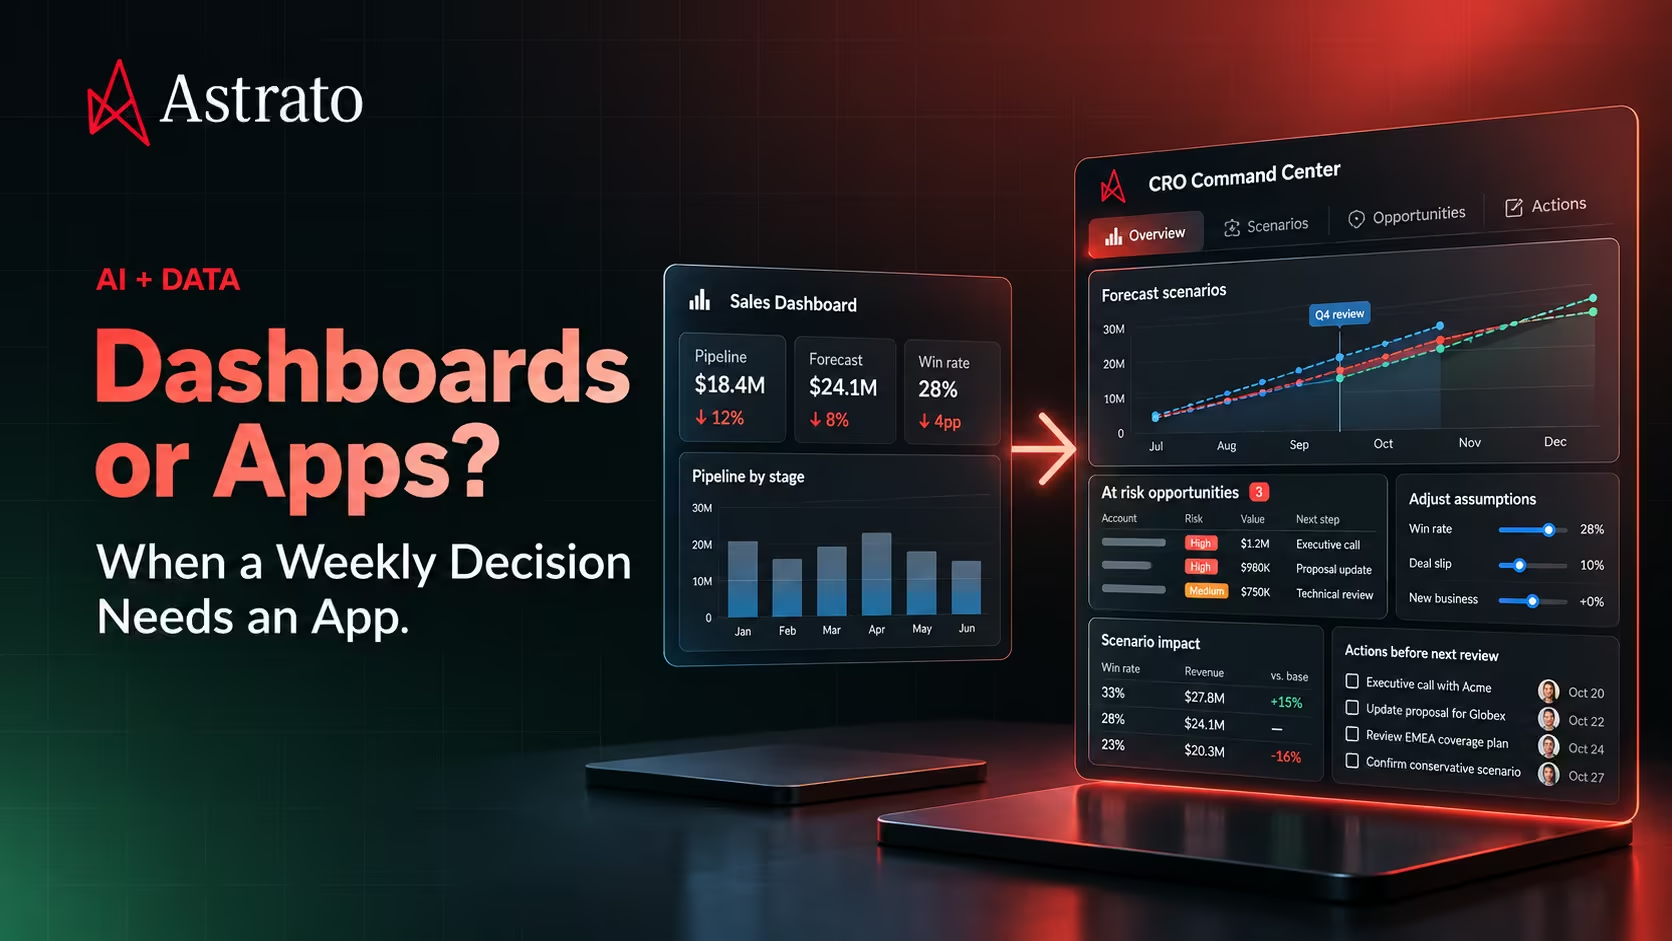
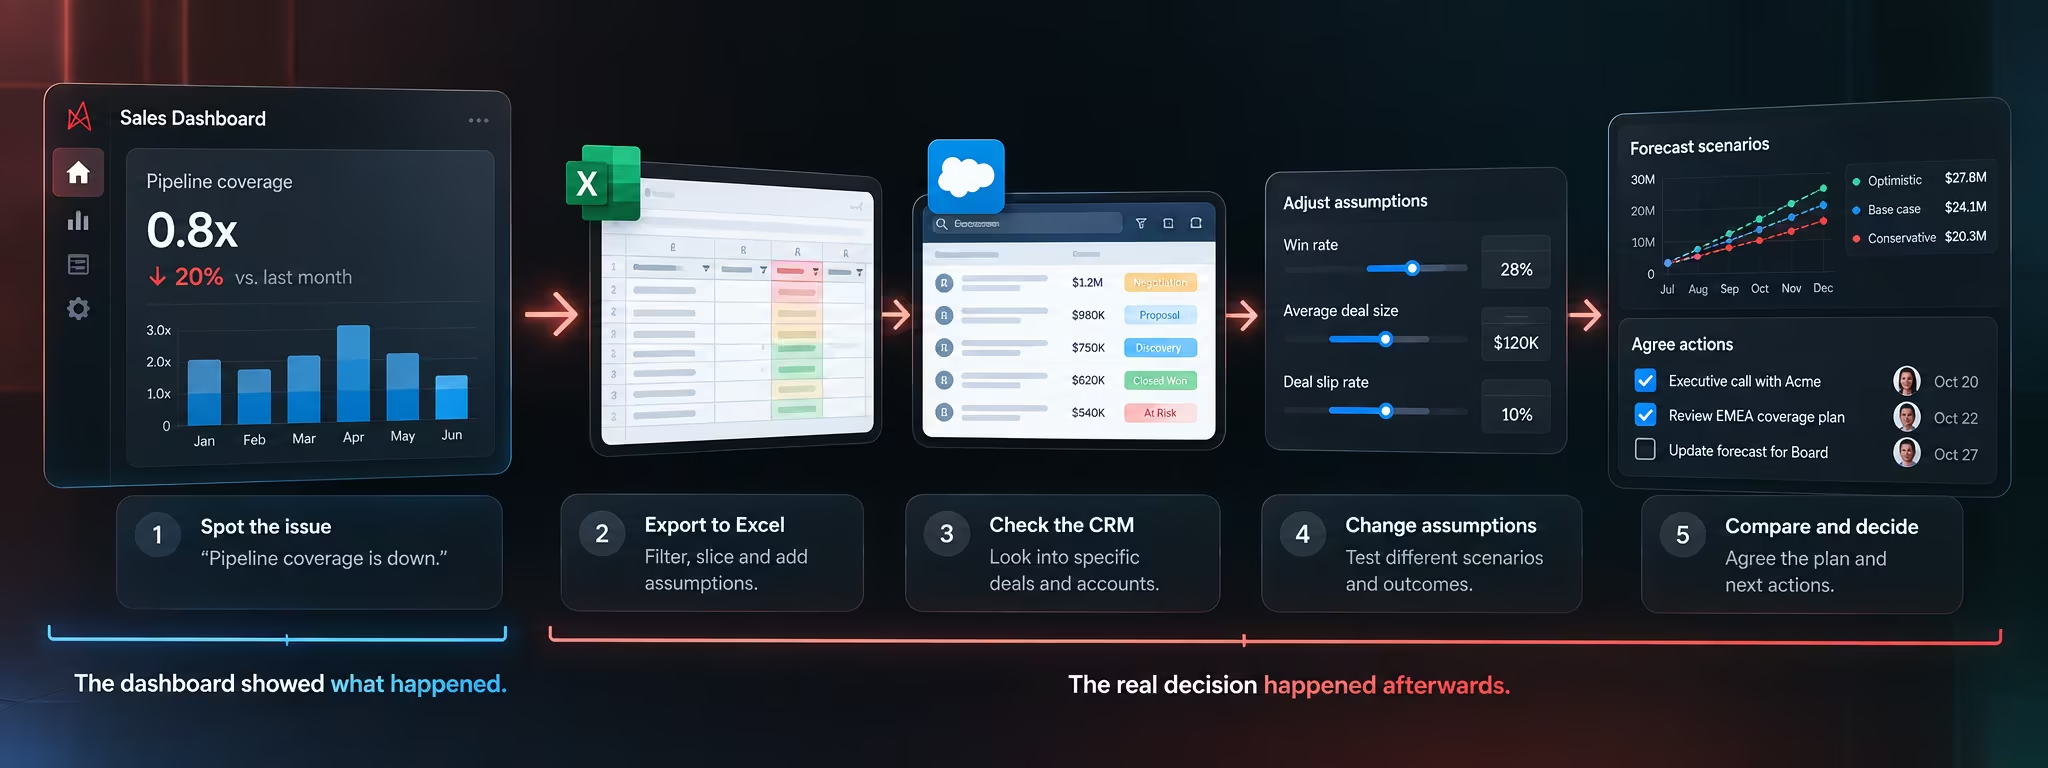
Your sales dashboard says pipeline coverage is down.
The number is clear. The trend is clear. Everyone in Monday's forecast meeting can see the problem.
Then the questions start.
Which deals caused the drop? Which regions are most exposed? What happens if two of the largest opportunities slip into next quarter? Does the team still hit target under a more conservative conversion rate? Where does leadership need to intervene this week?
Soon, someone has the CRM open. Someone else is changing assumptions in a spreadsheet. The sales leader is comparing scenarios, while actions from the meeting are being captured somewhere else.
The dashboard did its job. It showed the team what was happening.
But the decision required more than a dashboard.
That's an important distinction as AI makes it faster to build purpose-specific business apps. The question isn't whether apps are better than dashboards.
It's what happens after someone sees the number.
Dashboards and apps answer different questions
Dashboards are extremely good at making business performance visible.
They bring KPIs together, show trends, highlight changes and give people a shared view of what's happening.
For many situations, that's exactly what's needed.
A sales leader checking pipeline coverage doesn't necessarily need an application. Neither does a finance team monitoring monthly expenses or an operations leader watching fulfillment times.
If the job is to monitor, understand and explore, a dashboard may be the right interface.
But some recurring decisions go further.
The user sees a number and then needs to investigate it, change assumptions, compare possible outcomes and decide what happens next.
That's where the boundary between a dashboard and a business app starts to matter.
A useful shorthand is:
A dashboard helps you understand what's happening. An app helps you decide what to do next.
The line isn't absolute. Dashboards can be interactive, and apps can contain charts and KPIs.
The difference is what the experience is designed around.
Five signs your dashboard is part of a bigger workflow
You don't need to replace every dashboard with an app.
Instead, look at what people repeatedly do around the dashboard.
Those behaviors often tell you whether you're dealing with a reporting problem or a larger decision workflow.
1. People export the data every week
The meeting starts in a dashboard.
Five minutes later, someone clicks Export.
The data moves into Excel, where the team filters accounts, adds assumptions, rearranges rows or calculates scenarios that aren't available in the original view.
There's nothing inherently wrong with that. Excel is useful precisely because people can manipulate information quickly.
But when the same export happens every Monday, it's worth asking why.
The dashboard may be supplying the inputs to the decision without supporting the decision itself.
The repeated workflow isn't:
Open dashboard → understand performance.
It's:
Open dashboard → export data → manipulate it → compare options → decide.
That is a different job.
2. The same follow-up questions happen every time
Weekly business reviews tend to develop familiar questions.
Why did pipeline fall?
Which opportunities account for most of the change?
What happens if this deal slips?
Which customers are at risk?
Where are we furthest from target?
A dashboard may help answer each one through filters, drill-downs and additional views.
But if the team follows roughly the same investigative path every week, those questions aren't really ad hoc anymore.
They're a repeatable decision process.
Instead of giving users a collection of charts and asking them to reconstruct that process every Monday, an app can be designed around the questions they already know they'll need to answer.
3. People need to change assumptions
This is one of the clearest signs that the job has moved beyond monitoring.
A dashboard might tell a CRO that the current forecast is $18 million.
The next question is often:
What if?
What if win rates fall by five percentage points?
What if the two largest opportunities move into next quarter?
What if the team increases average selling price?
What if the conservative scenario becomes the operating plan?
Now the user isn't simply exploring what has already happened. They're testing possible futures.
That requires inputs, calculations and scenarios.
Once people need to change assumptions and see how those changes affect an outcome, the experience starts behaving much more like an application.
4. One decision requires information from several places
Organizations naturally build dashboards around subjects.
Pipeline.
Revenue.
Customer health.
Targets.
Product usage.
Each can be useful on its own. But executives rarely make decisions within such clean boundaries.
A CRO deciding where to intervene may need pipeline coverage, deal movement, account history, targets and customer signals at the same time.
If making one decision means opening four dashboards, switching to the CRM and maintaining another spreadsheet, the problem may not be a lack of information.
The information just isn't organized around the decision.
A purpose-built app can bring the relevant context together around the job the person is trying to complete.
5. The meeting needs to end with an action
The most important business meetings don't end with everyone agreeing that a chart looks concerning.
Someone has to do something.
Which accounts need executive attention?
Which forecast scenario are we committing to?
Where should resources move?
What needs to change before next week's review?
Who owns the next action?
The closer a workflow gets to making and acting on a decision, the more useful it becomes to design the experience around that outcome.
A dashboard can show the evidence.
An app can bring the evidence, inputs and decision process into the same experience.
A dashboard isn't a failed app
None of this means every dashboard should become an application.
If someone wants to know whether revenue is growing, a dashboard may be exactly what they need.
If an operations manager needs to monitor today's order backlog, don't add a workflow simply because you can.
And if an executive needs a concise view of company KPIs, turning that view into a complex application may make the experience worse rather than better.
The right interface depends on the job.
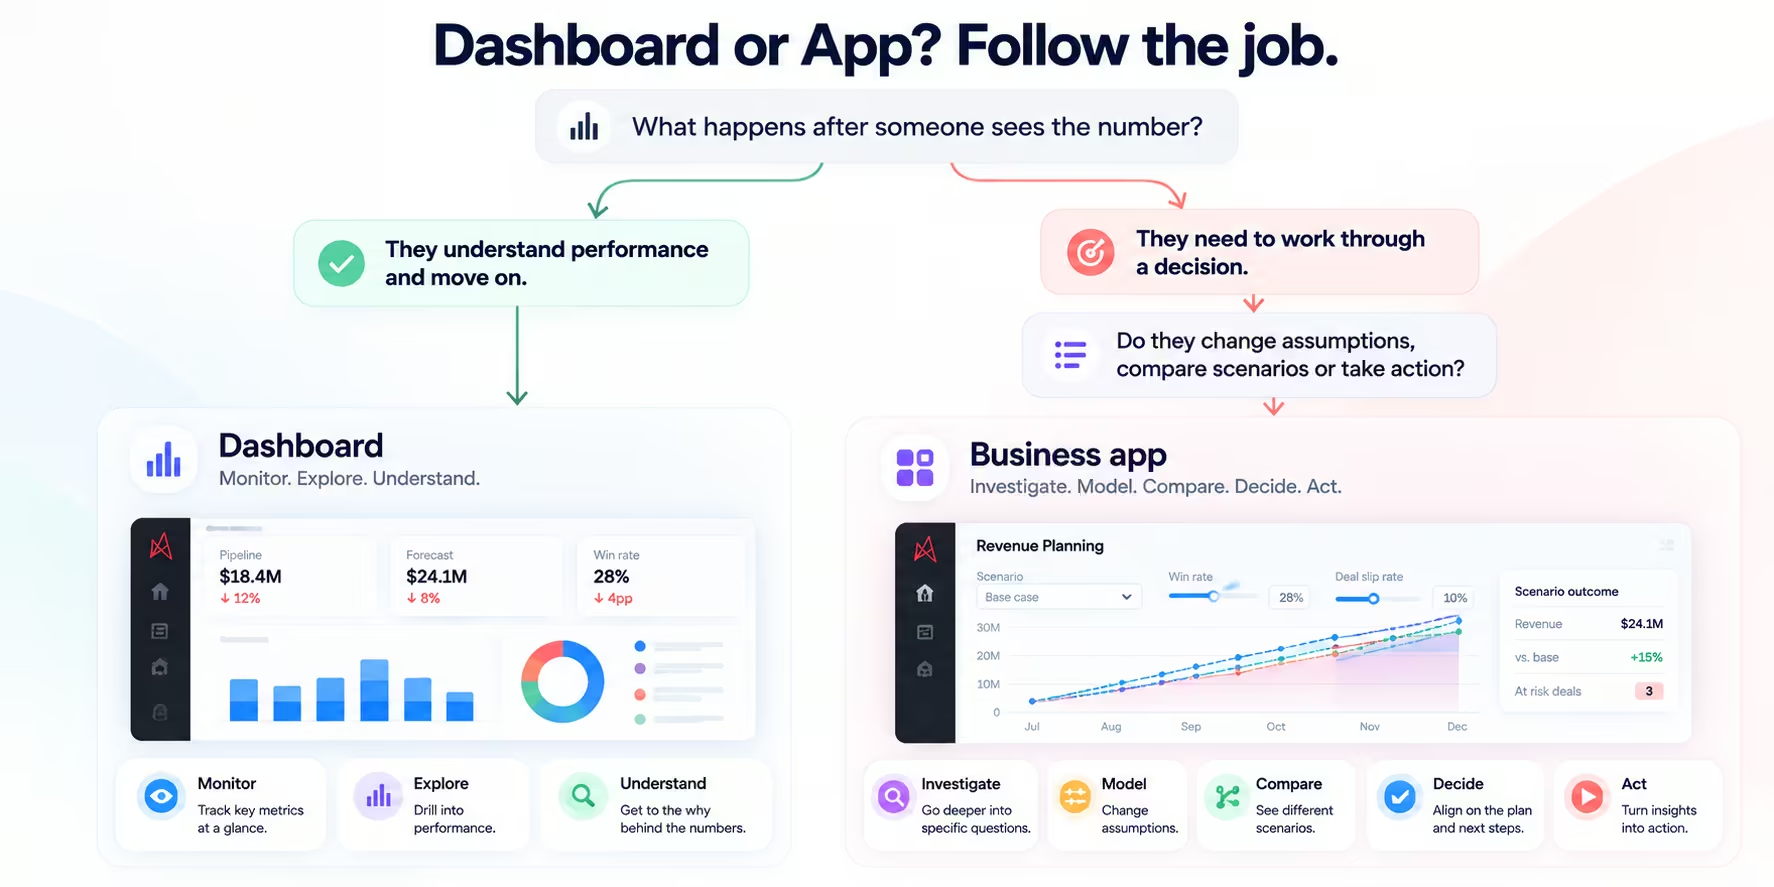
The interesting cases are usually not the obvious dashboards or the obvious operational systems.
They're the recurring decisions sitting somewhere in between.
Important enough that people repeat them every week. Specific enough that a traditional software project would have been difficult to justify.
Those are strong candidates for purpose-built business apps.
Design around the decision, not the dashboard
Suppose you're designing something for a CRO's weekly forecast meeting.
The traditional starting point might be:
What should go on the dashboard?
Pipeline by stage. Forecast versus target. Win rate. Average deal size. Regional performance.
All useful information.
But start with a different question:
What does the CRO need to decide every Monday?
Now the requirements change.
Are we still likely to hit the quarter?
Which deals put the forecast most at risk?
Where does leadership need to intervene?
What happens under the conservative scenario?
What needs to happen before the next review?
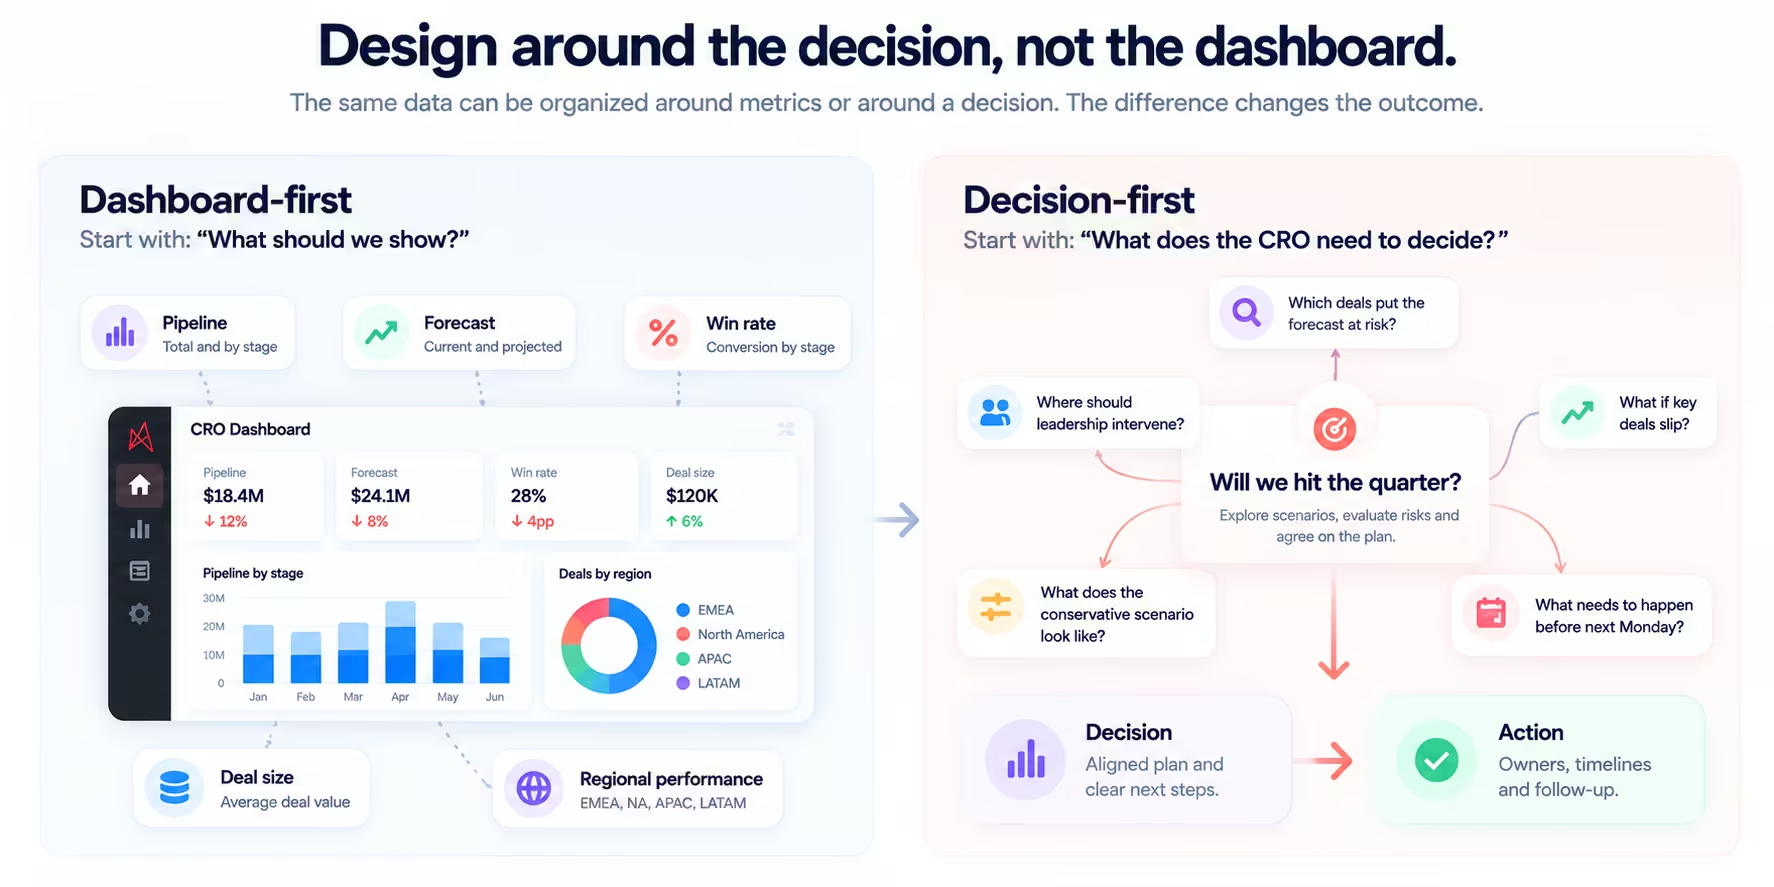
The data hasn't necessarily changed.
The organizing principle has.
Instead of arranging charts around metrics, you're arranging information and interactions around a decision.
That's the difference between showing someone the state of the business and helping them work through what to do about it.
AI changes which business apps are worth building
There's a reason many of these workflows ended up in spreadsheets.
Building custom software takes time.
A weekly forecast process might be extremely important to the sales organization without being important enough to compete for engineering resources.
So teams adapt.
They combine dashboards, spreadsheets, CRM screens, slide decks and institutional knowledge into a workflow that gets the job done.
AI changes the economics of that decision.
If a team can describe the experience it needs and build it much faster, a narrower class of business problems becomes worth turning into software.
A pricing team might need an app for evaluating scenarios before changing a price.
Finance might need one built around the operating review.
Customer success might need one that brings risk signals together and helps prioritize accounts.
Sales leadership might need one built specifically around Monday's forecast decision.
These don't need to become giant systems that handle everything the department does.
They can be apps built around one valuable, repeatable job.
The app still needs to understand your business
Building the interface faster doesn't remove the data problem underneath it.
If a forecast app uses one definition of pipeline and the finance report uses another, you've simply created another place for numbers to disagree.
The same applies to revenue, ARR, active customers, churn or any other metric that depends on business rules.
That's why access to the warehouse alone isn't enough.
An app also needs the definitions, relationships, calculations and access rules that give the underlying data its business meaning.
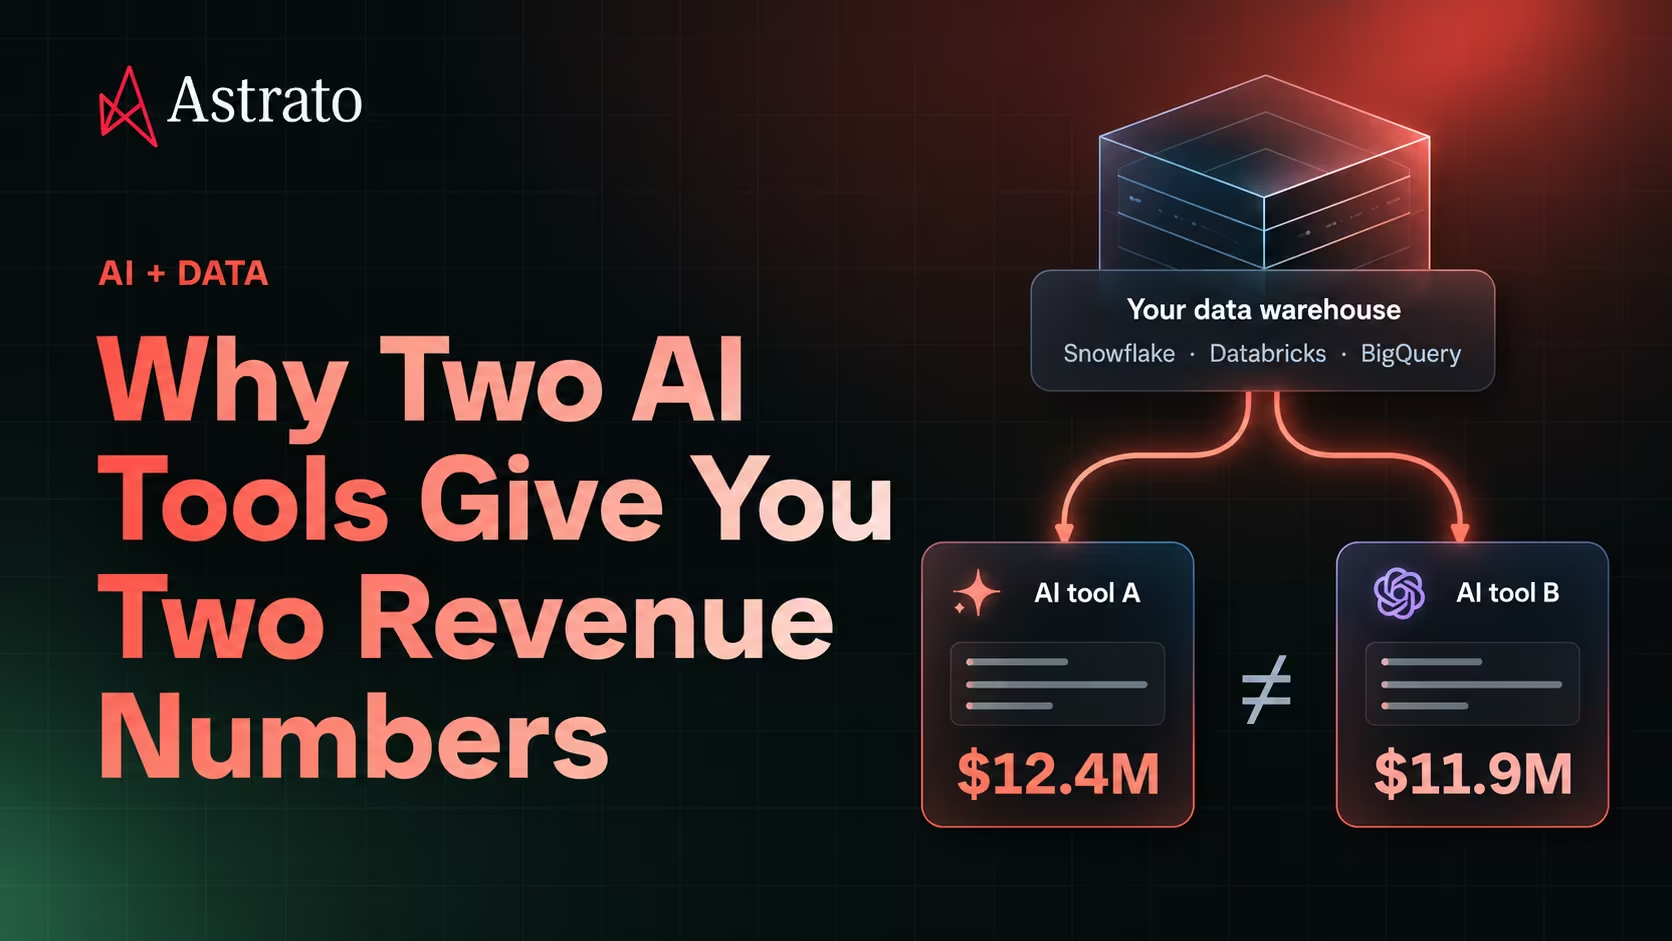
We've explored this problem in more detail in Why Two AI Tools Give You Two Revenue Numbers: two AI systems can query the same warehouse successfully and still disagree because they interpret the business question differently.
The goal isn't to rebuild those definitions every time someone builds another app.
It's to reuse the business context the organization already trusts.
From a weekly dashboard to a purpose-built app
This is where the new generation of AI app builders becomes interesting.
Astrato is built around a simple idea: describe what you need and build a business app on your warehouse data.
Instead of starting with a blank application and a development project, you can start with the business problem:
Build me an app for our Monday forecast meeting.
The resulting experience can bring together the metrics, detail and interactions needed for that particular job while working from live warehouse data and governed business definitions.
That distinction matters.
The objective isn't to turn every dashboard into an app.
It's to make purpose-built software practical for business decisions that previously fell into the gap between dashboards and custom development.
What happens after you see the number?
That's the simplest test.
Look at one of the dashboards your team uses every week and ask what happens next.
If people see the information, understand what's happening and move on, the dashboard is probably doing its job.
If they immediately export the data, open other tools, change assumptions, compare scenarios and work through the same set of decisions they did last week, the dashboard may only be the beginning of the workflow.
Don't start by asking whether you need a better dashboard.
Ask what decision people are actually trying to make.
If the real work starts after they see the number, you may be looking at an app.
Your data. Any business app.
Ready to experience next-gen analytics?
See how Astrato runs natively in your warehouse.