
Create, Schedule & Share Paginated Reports and Data Exports
⏰Deliver Business-Critical Insights | Provide users with essential insights precisely when they need it📃Generate, schedule, and distribute reports and data exports seamlessly.✨Leverage AI from Astrato Insights, simplify complex data into actionable summaries.

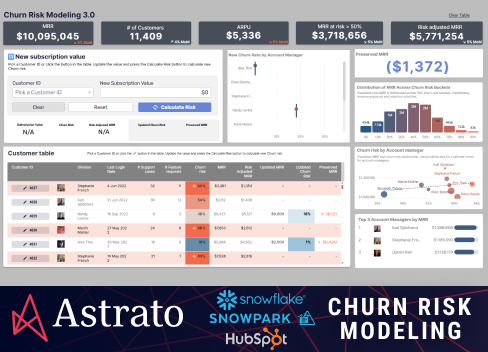
Select a customer from the table and update their MRR (monthly recurring revenue) to model their risk of churn. No-code modeling, without using data scientists time. Seamlessly build action into analytics and integrate with other tools using the power of Snowflake and Snowpark.How to:
- Select a customer ID using the button in the first column of the table
- Update the subscription value (be sure that it differed from the original subscription value)
- Click on the calculate risk button

Astrato makes visualizing financial data easy and accessible to business users, offering meaningful insights from complex financial statements. Intuitive dashboards, insightful visualizations, and cloud-native analytics not only enhance the quality of the BI but the capacity for collaboration in an organization.

The Seattle Housing Market Dashboard displays data for homes sold in Seattle, Washington, USA between August and December 2022. The dashboard showcases Astrato’s Input form functionality, and enables the user to predict a price of their desired home based on their requirements, using a sophisticated filtering option.The Price Prediction Sheet uses a statistical model to predict a home's price based on its attributes, such as number of bedrooms, bathrooms, Square Feet (Sqft) and Zip code or Region. The user enters their requirements into the input form, and predicts the price based on its attributes. This feature was accomplished using Python.The dashboard will also display similar homes (the same number of bedrooms, with ±1 bathroom, ±500 sqft, and in the same zip code or region.) This feature was created with SQL. The Supplemental Data Sheet allows the user to explore different regions and get a sense of how house prices and availability have changed over time.
