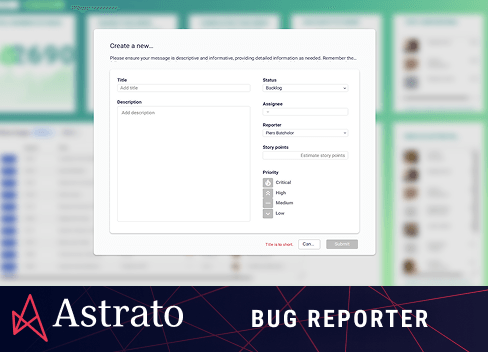
✅ Create and manage new issues with inline forms
📊 Track top reporters and most active contributors
⚙️ Filter by status, assignee, priority, and more
📈 Know what's rising, what’s resolved, and what’s stuck Perfect for product, QA, and support teams needing live, actionable insights. Powered by real-time data for faster debugging and better collaboration.
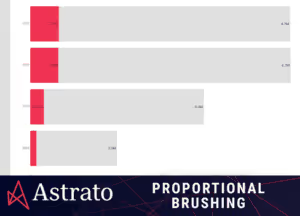
Proportional brushing is a powerful feature in data visualization that highlights related data points across multiple charts simultaneously. When you select a data point in one chart, proportional brushing automatically highlights corresponding data in other charts, making it easier to see patterns, correlations, and insights at a glance.With two measures with a 𝗰𝗼𝗺𝗺𝗼𝗻 𝗽𝗮𝗿𝗮𝗺𝗲𝘁𝗲𝗿 for the country that is 𝗯𝗿𝘂𝘀𝗵𝗲𝗱 and a variable driving that parameter, Proportional Brushing can be created with ease, using 𝗔𝘀𝘁𝗿𝗮𝘁𝗼 𝗔𝗰𝘁𝗶𝗼𝗻𝘀. Have a look at the images attached on the end result and how to create it. I also created an action to update the 𝗱𝘆𝗻𝗮𝗺𝗶𝗰 𝗹𝗮𝗯𝗲𝗹𝘀.