This workbook shows how self-service formulas help users apply:
📈 Quarter-over-quarter growth (like the 274% spike in Q3 2024)
📉 Negative growth detection (e.g. -2% in Q1 2023)
➕ Inline % changes on charts with no code Use built-in functions like: Running totals Moving averages Period-over-period Nested logic Built for business users who need fast, flexible insights, without SQL or help from the data team.

🔍 Match & Learn: Astrato Memory Game
Test your memory while exploring Astrato! Flip cards to reveal data sources and try to find matching pairs, all powered by dynamic Astrato Actions. This interactive demo is a fun way to learn advanced action techniques and how to create engaging, data-driven experiences.

Astrato widgets. Inspired by the work of Nicholas Lea TrengrouseThis is a set of widgets designed to maximize canvas space and deliver focused insights:
- 𝗔𝗻 𝗶𝗻𝘁𝗲𝗿𝗮𝗰𝘁𝗶𝘃𝗲 𝘄𝗶𝗱𝗴𝗲𝘁 for hands-on exploration.
- 𝗔 𝗱𝘆𝗻𝗮𝗺𝗶𝗰 𝘃𝗶𝘀𝘂𝗮𝗹 for deeper data comparisons
- 𝗔 𝘀𝗹𝗲𝗲𝗸 𝗰𝗮𝗿𝗱 to highlight key metrics.

This is a sample - setup this workbook now,https://help.astrato.io/en/articles/10248639 This workbook provides comprehensive insights into user engagement by tracking active users, session lengths, and workbook usage trends. It enables organizations to monitor daily activity, identify high-usage content, and uncover gaps in adoption to optimize onboarding, improve content strategies, and enhance resource allocation.

Create, Schedule & Share Paginated Reports and Data Exports
⏰Deliver Business-Critical Insights | Provide users with essential insights precisely when they need it📃Generate, schedule, and distribute reports and data exports seamlessly.✨Leverage AI from Astrato Insights, simplify complex data into actionable summaries.

This interactive demo provides insights into energy trends from 2016 to 2018, visualizing key metrics for energy load, price analysis, and generation across multiple energy sources. Users can explore biomass, gas, hard coal, wind, and solar contributions, tracking their performance over time and analyzing the alignment between actual vs. forecasted data. The dashboard highlights significant periods of market shifts, including price fluctuations, consumption patterns, and renewable energy adoption, giving users a detailed view of energy supply and pricing strategies.

🚀 Unlock the Power of Real-Time Data with Our Demo App!Ever wondered how your call center metrics can drive smarter decisions? Dive into our demo app built on real-world data from call center operations. Here’s what you can explore:
- Agent Performance: See how different agents handle call types, resolutions, and more.
- Call Metrics: Track call duration, satisfaction scores, and disposition for actionable insights.
- Queue Management: Understand how various queues impact call handling and resolution.
Why Try the Demo?
- Instant Insights: Get a clear view of key performance indicators and call metrics.
- User-Friendly Interface: Experience seamless navigation and easy-to-understand data visualizations.
- Actionable Data: Use real-time data to make informed decisions and optimize operations.
Elevate your analytics game and make every call count!

Explore the comprehensive Healthcare System Dashboard designed for Bedford Health System, a robust tool leveraging Astrato’s powerful data visualization capabilities. This dashboard provides a holistic view of various critical healthcare metrics, enabling informed decision-making and strategic planning.This Astrato workbook is designed for healthcare administrators, financial analysts, and strategic planners within Bedford Health System. It offers a comprehensive view of operational, clinical, and financial data, driving data-driven decisions and enhancing overall healthcare delivery.

🎮 Pick your Street Fighter in this pixel perfect dashboard. Inspired by Luis Felipe Tensini check it out here Youtube
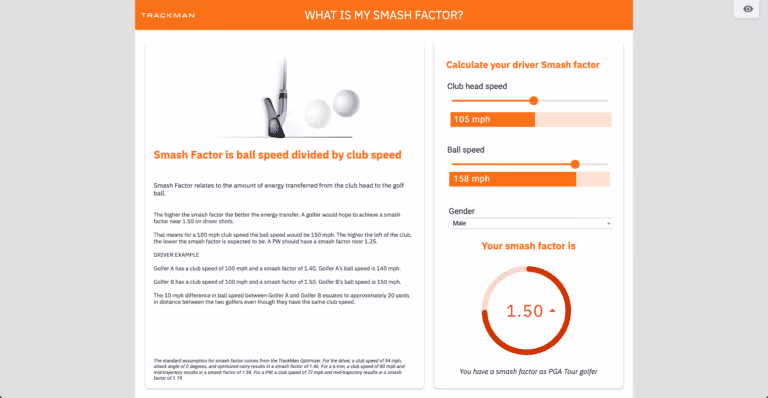
Smash Factor is ball speed divided by club speed. The higher the smash factor the better the energy transfer. A golfer would hope to achieve a smash factor near 1.50 on driver shots.Calculate your smash factor in this interactive data app

Funnel is the marketing data platform that gives you business-ready data that makes sense. Collect data from all platforms across the customer journey, transform it, explore it, and send it to any visualization app or data warehouse.You get data that is clean, accurate, and always up to date – data that helps you understand how your marketing is performing.

Unveil the Art of Data Visualization with Astrato's Design Lookbook! 🌟 Dive into a world where data meets design. Our Lookbook is your gateway to exploring stunning, innovative visualizations crafted for impact and clarity. Elevate your data storytelling skills now!

This interactive dashboard offers a comprehensive overview of the automobile industry's competitive landscape. It's an invaluable tool for business intelligence and market analysis.Insights are succinctly summarized using Generative AI, pointing out the highest and lowest performers in categories like fuel efficiency and price change. This dashboard is ideal for stakeholders to derive quick, actionable insights and for companies to demonstrate their analytic capabilities in the automobile sector.Astrato Insights summarizes the whole dashboard, ready to be easily understood by users, copied or shared.

This high-tech armour dashboard showcases cutting-edge data visualization, blending detailed analytics with striking aesthetics. This platform illustrates the potential in creating dynamic and engaging user experiences, perfect for tech-driven presentations and discussions. It's a prime example of data-driven storytelling, with a design that speaks directly to tech enthusiasts and professionals alike.Your browser does not support the video tag.

Live Query gives you immediate insights into your data so you can make better decisions faster. With real-time updates and accurate results, you can rely on Live Query to give you the information you need when you need it.