
🔍 Match & Learn: Astrato Memory Game
Test your memory while exploring Astrato! Flip cards to reveal data sources and try to find matching pairs, all powered by dynamic Astrato Actions. This interactive demo is a fun way to learn advanced action techniques and how to create engaging, data-driven experiences.
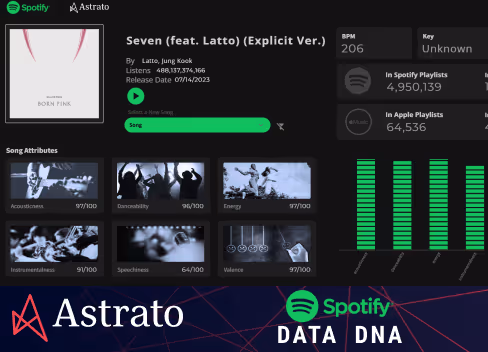
Spotify Data DNA

Astrato’s LLM Comparison App brings AI and analytics together in a seamless, interactive experience—powered by Snowflake Cortex. 🎥💡Here’s what you can explore:1️⃣ LLM Prototyping: Test and compare outputs from Anthropic's Claude Sonnet, Snowflake Arctic, and Llama 3 side-by-side. Adjust model settings like temperature and system prompts directly in the app.2️⃣ Use Case Tuning: Simplify complex parameters with intuitive BI controls, allowing easy experimentation to find the best model for your use case.3️⃣ Airbnb Review Analysis: Dive into a dedicated sheet to analyze Airbnb review data. Harness the power of LLMs to derive actionable insights directly from customer feedback.Whether it’s picking the right LLM for your budget or tying AI prompts to your warehouse data, this app shows the possibilities of embedded analytics meeting AI.Built to showcase the best of Astrato + Snowflake Cortex, this app is your all-in-one tool for interactive AI experiences. Ready to elevate your data storytelling? 🚀

Dive into this interactive map showcasing the global community of Snowflake Data Superheroes! Using Cortex, we enriched location data with Longitude & Latitude, bringing the Superheroes' worldwide presence to life.Built in Astrato, the visualization leverages our native heatmap and point map layers to deliver a seamless, dynamic experience. See the power of live data connections and intuitive storytelling in action!Created by our very own Snowflake Data Superhero, Piers Batchelor. Join the ranks, apply here: https://www.snowflake.com/en/data-superheroes/https://www.snowflake.com/en/data-superheroes/

Spotify Wrapped Meets Data Analytics: Build Your Taste ProfileGet inspired by our Spotify analytics app, built to celebrate the arrival of Spotify Wrapped!This demo uses Snowflake Cortex AI to create personalized insights like your unique taste profile and even predict your age based on listening habits. Powered by Astrato Analytics, it highlights how HTML support transforms tables, KPI cards, and visuals, making analytics as striking as your favorite album covers.⚠️ Note: While the app supports a variety of playlists, some curated by Spotify may not work due to API limitations.Experience the power of data storytelling for yourself! Explore the demo and see how Astrato brings creativity to analytics.
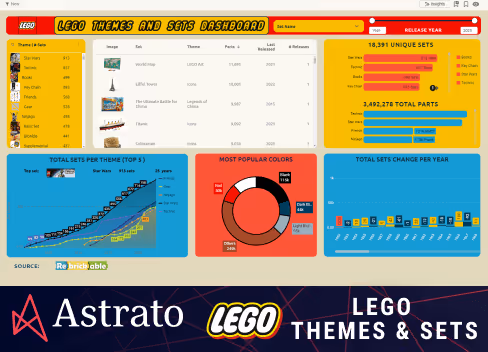
Discover the World of LEGO with Our New Dashboard!
Explore the incredible diversity and depth of LEGO themes and sets. Built with Astrato’s powerful Self-Service BI platform, this dashboard exemplifies the potential of self-service analytics and real-time data exploration.
Why You’ll Love This Dashboard:
Self-Service BI:
- No coding needed: Dive into your data with ease.
- Build 4x faster than traditional tools like Tableau and Power BI.
Explore LEGO Themes:
- 18,391 Unique Sets: Discover the extensive collection of LEGO sets across various themes.
- Detailed Insights: See the most popular sets, colors, and themes at a glance.
Unlock the potential of your data with Astrato – where insights are just a click away.

🎮 Pick your Street Fighter in this pixel perfect dashboard. Inspired by Luis Felipe Tensini check it out here Youtube

☢️🎮Radioactive data just in! Since the launch of Amazon Prime's #FALLOUT, gamers have flocked back to the fallout game series with single player Fallout 4 on top, followed by MMO Fallout 76. Data sourced from SteamDB. Visualised in Astrato Analytics. Presented on a #PipBoy.

This high-tech armour dashboard showcases cutting-edge data visualization, blending detailed analytics with striking aesthetics. This platform illustrates the potential in creating dynamic and engaging user experiences, perfect for tech-driven presentations and discussions. It's a prime example of data-driven storytelling, with a design that speaks directly to tech enthusiasts and professionals alike.Your browser does not support the video tag.

Live Query gives you immediate insights into your data so you can make better decisions faster. With real-time updates and accurate results, you can rely on Live Query to give you the information you need when you need it.