
A fast, simple way to explore machine-generated log data at scale.
This workbook uses the Brown University MgBench dataset, a public benchmark built to test analytics performance on high-volume operational logs. You’ll find millions of rows of raw machine metrics – CPU, memory, disk, network, and load stats – captured across multiple machines and groups. It’s ideal for showing how Astrato handles live-query workloads, fast filtering, and smooth interaction on dense time-series data. What’s inside: Machine groups and names CPU usage (idle, system, user, wio, nice) Memory and disk metrics Load averages (1/5/15 minute) Network bytes in/out Time-series views built directly from the raw MergeTree tables This workbook helps users explore: Trends over time Resource spikes Group comparisons Anomalies in machine performance Great for demos that highlight real operational telemetry, live queries, and how Astrato handles large datasets without extracts.
Sources:
- https://clickhouse.com/docs/getting-started/example-datasets/brown-benchmark
- https://clickpy-playground.clickhouse.com/?query_id=GEOICKHUJBUXMYROUXJK7C
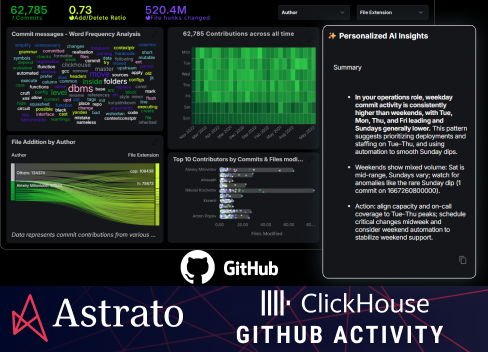
See your team’s GitHub activity come to life, powered by ClickHouse for lightning-fast queries ⚡
🧠 What you’ll find:
Real-time view of commits, file changes, and trends
Word cloud of the most common commit messages
Top contributors and how much they’ve modified
Heatmap showing when your team commits most
Smart AI insights that highlight work patterns and weekend dips
🚀 Why it’s cool:
You can explore years of GitHub data instantly. Spot trends, compare teammates, and see productivity shifts; all in one super-responsive dashboard.
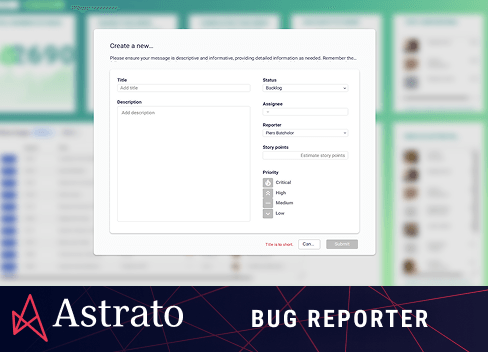
✅ Create and manage new issues with inline forms
📊 Track top reporters and most active contributors
⚙️ Filter by status, assignee, priority, and more
📈 Know what's rising, what’s resolved, and what’s stuck Perfect for product, QA, and support teams needing live, actionable insights. Powered by real-time data for faster debugging and better collaboration.


🚀 Unlock the Power of Real-Time Data with Our Demo App!Ever wondered how your call center metrics can drive smarter decisions? Dive into our demo app built on real-world data from call center operations. Here’s what you can explore:
- Agent Performance: See how different agents handle call types, resolutions, and more.
- Call Metrics: Track call duration, satisfaction scores, and disposition for actionable insights.
- Queue Management: Understand how various queues impact call handling and resolution.
Why Try the Demo?
- Instant Insights: Get a clear view of key performance indicators and call metrics.
- User-Friendly Interface: Experience seamless navigation and easy-to-understand data visualizations.
- Actionable Data: Use real-time data to make informed decisions and optimize operations.
Elevate your analytics game and make every call count!

Live Query gives you immediate insights into your data so you can make better decisions faster. With real-time updates and accurate results, you can rely on Live Query to give you the information you need when you need it.

Easily identify hotspots in time using gradient color scales. See the lows and highs of consumption, and filter down for more detail on specific time periods for in-depth insights!