Self-Service BI on Snowflake: Guide for Non-Technical Teams
Every BI vendor claims self-service in 2026. A four-level spectrum, five evaluation questions, and an honest comparison of the platforms that compete on Snowflake.

Every business intelligence vendor in 2026 claims self-service. None of them mean the same thing.
Some mean a marketing manager can build a dashboard in a browser. Some mean an analyst can write SQL without filing a ticket. Some mean a finance lead can ask a chatbot a question and get a chart back. These are not the same product, even when they ship under the same word.
The buyer evaluating self-service BI on Snowflake has been told all of these are “self-service.” They’ve watched a Tableau demo where a power user does something brilliant in three clicks, then handed the trial to a marketing manager who spent an hour trying to filter by quarter. They’ve seen a Looker Studio dashboard that “anyone can build” and discovered the team needed a LookML modeler to build anything reusable. They’ve installed Metabase, watched it work beautifully for two weeks, then watched it break the moment three teams disagreed on what “active customer” means.
So the real question isn’t which BI tool offers self-service. Every BI tool offers self-service. The question is who on your team can serve themselves, what can they actually do, and what happens when they hit the ceiling.
This guide answers that question for teams running on Snowflake. It defines self-service as a four-level spectrum, gives you five questions to test any vendor’s claim against, and maps the platforms that compete in this space — including where each one overstates what it delivers.
TL;DR
Self-service is a spectrum, not a feature. The honest question is which slice of your team — analysts, builders, explorers, or pure consumers — the platform actually enables. Most “self-service BI” tools serve analysts well, builders partially, and the marketing manager poorly.
For Snowflake-backed teams, the strongest fits depend on who you’re enabling. Sigma and Hex serve analysts. Looker and Power BI serve trained builders. Metabase serves consumers and breaks past that. Astrato is built for guided self-service — explorers and builders working inside boundaries set by the data team.
No platform serves all four levels equally. Pretending otherwise is the marketing fiction this article is here to call out.
What “self-service” actually means
Self-service BI is a spectrum of user capability, not a binary feature. To evaluate any platform’s claim honestly, define which level of user it actually enables — and where it stops.
Four levels are useful. Most teams will recognise their own users in here.
Level 1 — Consumer. Views existing dashboards. Applies filters and date ranges. Drills down a hierarchy. Doesn’t create anything new. The marketing intern checking last week’s traffic. The CFO looking at the monthly close. The salesperson scanning their pipeline. They want it fast, current, and unambiguous.
Level 2 — Explorer. Creates ad-hoc charts from curated datasets. Asks a natural-language question and gets a chart back. Bookmarks the result. Doesn’t define new metrics, doesn’t join new tables, doesn’t write SQL. This is the marketing manager who wants to know “which channels are converting best for the new product launch” without filing a ticket. They explore what the data team has already prepared.
Level 3 — Builder. Creates new dashboards using the semantic layer. Joins curated datasets. Builds a report that didn’t exist before, using metrics the data team has already defined. Doesn’t write SQL but understands the model. This is the RevOps lead who pulls together a quarterly board view from Salesforce, billing, and product usage data. They build with the data team’s primitives, not around them.
Level 4 — Analyst. Writes SQL. Defines new metrics. Builds models. Owns the semantic layer or contributes to it. This is the power user who actually understands how the warehouse is structured, what the dimensions mean, and where the joins are tricky. They serve themselves completely.
The dirty secret of the BI market is that most “self-service” platforms serve Level 4 well, Level 3 partially, and Levels 1–2 poorly. Tableau, Looker, Power BI, Hex — these were all designed for analyst-led self-service. Their definition of “self-service” assumes the user can think in joins, write a calculated field, or model a dataset. The marketing manager who just wants last week’s pipeline numbers is not the user these platforms were built for, even when the marketing copy says they were.
The opposite mistake is just as common. Tools that genuinely work at Level 1 — clean, fast, idiot-proof dashboards — often break at Level 3. The moment a builder needs to join two curated datasets or define a new metric, the no-code surface runs out and the answer is “go ask the analytics team.”
The platforms that succeed in the middle of the spectrum — Levels 2 and 3 — share a common architectural choice. They sit on top of a semantic layer the data team controls, and they expose that layer to non-technical users through a guided interface. Astrato calls this “guided self-service” on its product navigation, and the term is useful. Business users explore freely within boundaries set by the data team via the semantic model, row-level security, and curated datasets. The exploration is real. The boundaries are too.
This is the angle that matters when you evaluate a platform: not “is it self-service” but “which level of user does it enable, and what happens at the ceiling.”
Five questions to ask before believing any self-service claim
Before you accept any vendor’s self-service claim, run it through these five questions. Each is designed to expose the gap between marketing language and product reality.
1. Can a non-technical user build their first useful dashboard without help, in under an hour, against your real Snowflake data?
Most POCs are run by an analyst. The analyst makes the platform look brilliant. Then the actual target user — the marketing manager, the ops lead — opens it for the first time and gets stuck. Run the POC with the user you’re actually trying to enable. Give them a curated dataset and a simple question (“how did our top 5 products perform last quarter”) and time how long it takes. If they need an analyst sitting next to them, the platform is not Level 2 self-service. It’s Level 4 with a friendly UI.
2. What does the tool do when the user needs to join two datasets that aren’t already joined?
This is where Level 2 stops and Level 3 begins. Some tools (Metabase, Sigma’s basic surfaces) hit a wall here. Some tools (Looker, Hex) require SQL or LookML. The platforms that handle this gracefully expose a semantic layer where joins are pre-defined by the data team, and the user just picks fields. Test this in the POC. It’s where most “no-code” claims fall apart.
3. Does the tool prevent SQL contradictions across users, or does it produce them?
A platform that lets every user write their own metric will produce 47 versions of “active customer” within six months. That’s not self-service — that’s chaos with a dashboard. The honest test: does the platform make business users consume metrics defined once in a semantic layer, or does it let everyone redefine them? Sigma, Looker, and Astrato sit on the consume-from-semantic-layer side. Tableau and Power BI sit on the everyone-defines-their-own side, with optional semantic layers that few teams enforce. Metabase doesn’t really have a semantic layer at all.
4. Is there a semantic layer the AI can ground itself in, or does the AI generate SQL from raw schemas?
Natural-language queries are the new self-service surface. They only work if the underlying model is well-defined. Snowflake Cortex Analyst, for example, requires a semantic model — table definitions, metric definitions, synonyms — to generate trustworthy answers. Without that grounding, text-to-SQL hallucinates. The platforms that take AI seriously connect the natural-language interface to the semantic layer (Astrato, Looker, ThoughtSpot to a degree). The platforms that don’t are running AI directly on the warehouse schema, which produces SQL queries that look right and aren’t.
5. Does the pricing model survive the “let everyone explore” promise?
Per-seat pricing breaks self-service the moment self-service works. If you successfully enable 200 marketing and ops people to use the tool, your bill scales linearly with adoption — and finance will come asking why. Per-query pricing rewards adoption but punishes heavy exploration. Consumption-based pricing tied to warehouse compute is the cleanest fit for warehouse-native platforms, because the cost scales with the work the warehouse is already doing. Read the pricing page. Then run the math for your target headcount. If “self-service for everyone” gives you a six-figure bill, it’s not really self-service — it’s a paywall around exploration.
If a vendor passes all five, the self-service claim is real. If they pass three, the claim is partial. If they pass one or two, the claim is marketing.
Where most platforms actually sit on the spectrum
Map the comparison set against the four levels honestly, and the picture clarifies fast.
Tableau is the platform most teams are migrating away from in this conversation. It is genuinely brilliant for Level 4 analysts and Level 3 builders who are willing to learn it. It is intimidating for Level 2 explorers and unnecessary for Level 1 consumers, who often end up exporting to Excel. Tableau’s “self-service” claim is real for analysts and overstated for everyone else.
Power BI is similar. DAX and Power Query are powerful for Level 4 users who learn them. The barrier for Level 2 and 3 users is real. Microsoft ecosystem lock-in means many teams use Power BI by default, not by fit. Self-service exists, but the path to it runs through training.
Looker has a strong semantic layer (LookML) and serves Level 3 builders well once the LookML model is mature. Building the LookML is a Level 4 task that requires a dedicated modeler. Looker Studio Pro extends the consumption surface but doesn’t change the fundamental fact that Looker is analyst-led self-service.
Sigma is built for spreadsheet-fluent analysts. The spreadsheet UI is genuinely accessible if your users live in Excel. For Level 2 explorers without spreadsheet fluency, the surface is less natural than the marketing suggests. Strong at Level 3–4. Less convincing at Level 2.
Hex is notebook-first. It serves Level 4 analysts beautifully. It does not pretend to serve Level 1 or 2, and that honesty is its credit. Including Hex in a self-service-for-non-technical-teams comparison is mostly a category error — but enough teams do it that the article has to address it.
ThoughtSpot invested heavily in natural-language search as a Level 2 surface. It works well for direct factual questions (“what was last week’s revenue”) and less well for the kind of multi-step exploration a Level 3 builder needs. Strong at the question-answering edge. Weaker as a full dashboarding platform.
Metabase is genuinely accessible at Level 1 and Level 2 for simple questions. It breaks at Level 3 — the moment users need to join curated datasets or work with a semantic layer, the surface runs out. This is fine if your team is mostly Level 1 consumers. It’s a problem if your data team is trying to enable builders.
Astrato is built around guided self-service for Levels 2 and 3. Business users explore curated semantic models, build dashboards from pre-joined datasets, and ask natural-language questions grounded in the model — all within row-level security and access controls defined in Snowflake. The platform is weaker than Tableau for advanced visualization and weaker than Hex for Level 4 SQL-native exploration, and it is honest about both.
Snowsight sits at the floor of this conversation. It’s free with Snowflake. It serves Level 4 SQL-fluent users. It is not a self-service tool for non-technical teams, and Snowflake doesn’t really claim it is.
The pattern: every platform has a level where it shines and levels where it overstates. The buyer’s job is to know which level you’re trying to enable, and pick accordingly.
Self-service for ops, product, and finance: what each team actually needs
Different business teams need different points on the spectrum. A platform that serves all of them equally well doesn’t exist; the question is which combination matters most.
RevOps and sales operations are usually Level 3 builders. They need to combine pipeline, billing, and activity data into views that don’t exist out of the box. They benefit most from a semantic layer with joins pre-defined and metrics governed centrally. The pain point isn’t visualization — it’s getting a trustworthy multi-source view without writing SQL.
Marketing analytics and growth teams are usually Level 2 explorers. They want to ask “which channels drove pipeline last month, broken down by segment” and get a chart back. They don’t want to model a dataset; they want to interrogate one the data team has already curated. Natural-language interfaces help here, but only when grounded in a semantic model.
Finance and FP&A are mixed. Senior FP&A analysts are Level 3 or 4 — they often want to model directly. CFOs and finance business partners are Level 1 consumers who need scheduled reports and filtered dashboards. A platform that serves finance well needs to handle both ends.
Product analytics teams are typically Level 4. They live in notebooks, write SQL, and don’t really want a no-code surface. Hex, dbt, and direct Snowflake access often serve them better than a BI tool.
The mistake is buying a single platform for every team without thinking about who actually does what. The role-segmented analysis in our AI-native BI buyer’s framework goes deeper into how different roles evaluate platforms — the upshot is that “self-service for everyone” is rarely the right buying frame. “Level 2 for marketing, Level 3 for RevOps, Level 4 for product analytics” is closer to reality.
Self-service without the governance nightmare
The reason most self-service projects produce chaos is that they enable creation faster than they enable governance. A semantic layer in the warehouse, owned by the data team, is the only durable answer.
The governance failure mode is well-documented. Three teams build dashboards using slightly different definitions of “active customer.” Six months later, the CEO asks why the numbers don’t match across decks. The data team spends three weeks reconciling, finds that all three are technically correct (different definitions for different contexts), and then has to negotiate which definition wins. By the end, no one trusts any of the dashboards.
The shift-left pattern fixes this. Metric definitions, joins, and access controls move into the warehouse layer — defined in dbt, in Snowflake views, or in a semantic model the BI tool consumes rather than overwrites. The BI tool exposes those definitions to business users and prevents them from redefining the basics. Users still build their own dashboards; they just build them on top of agreed primitives.
This is what Astrato means by “guided self-service” and what Looker means by LookML. Both consume a semantic model rather than letting end users invent one. Astrato can use Snowflake’s semantic models directly when present, which means the work the data team has already done in the warehouse is reused, not duplicated. The same governance — row-level security, column masks, role-based access — that Snowflake enforces flows through to the dashboard automatically.
This pattern is covered in more depth in our reference architecture for data products on Snowflake. The summary version: self-service that scales requires a layer of agreed definitions between the warehouse and the user. Without it, every new user is a new source of contradictions. With it, the data team enables exploration without losing control of the definitions.
The IAG Loyalty team at British Airways’ parent group describes their architecture this way:
“Astrato is the execution layer. Everything is computed in Snowflake, where all datasets are aggregated and processed. We then layer visualization on top. It’s almost like a headless architecture — decoupling logic from the visualization product.”
— Chanade Hemming, Head of Data Products, IAG Loyalty
This is what Level 2 and 3 self-service looks like when it’s done well. Logic in Snowflake. Visualization on top. Users build freely on top of governed primitives, and the data team keeps control of what the primitives mean.
The platforms that compete here
Seven platforms compete seriously for self-service BI on Snowflake. Each takes a different architectural approach and serves a different point on the spectrum.
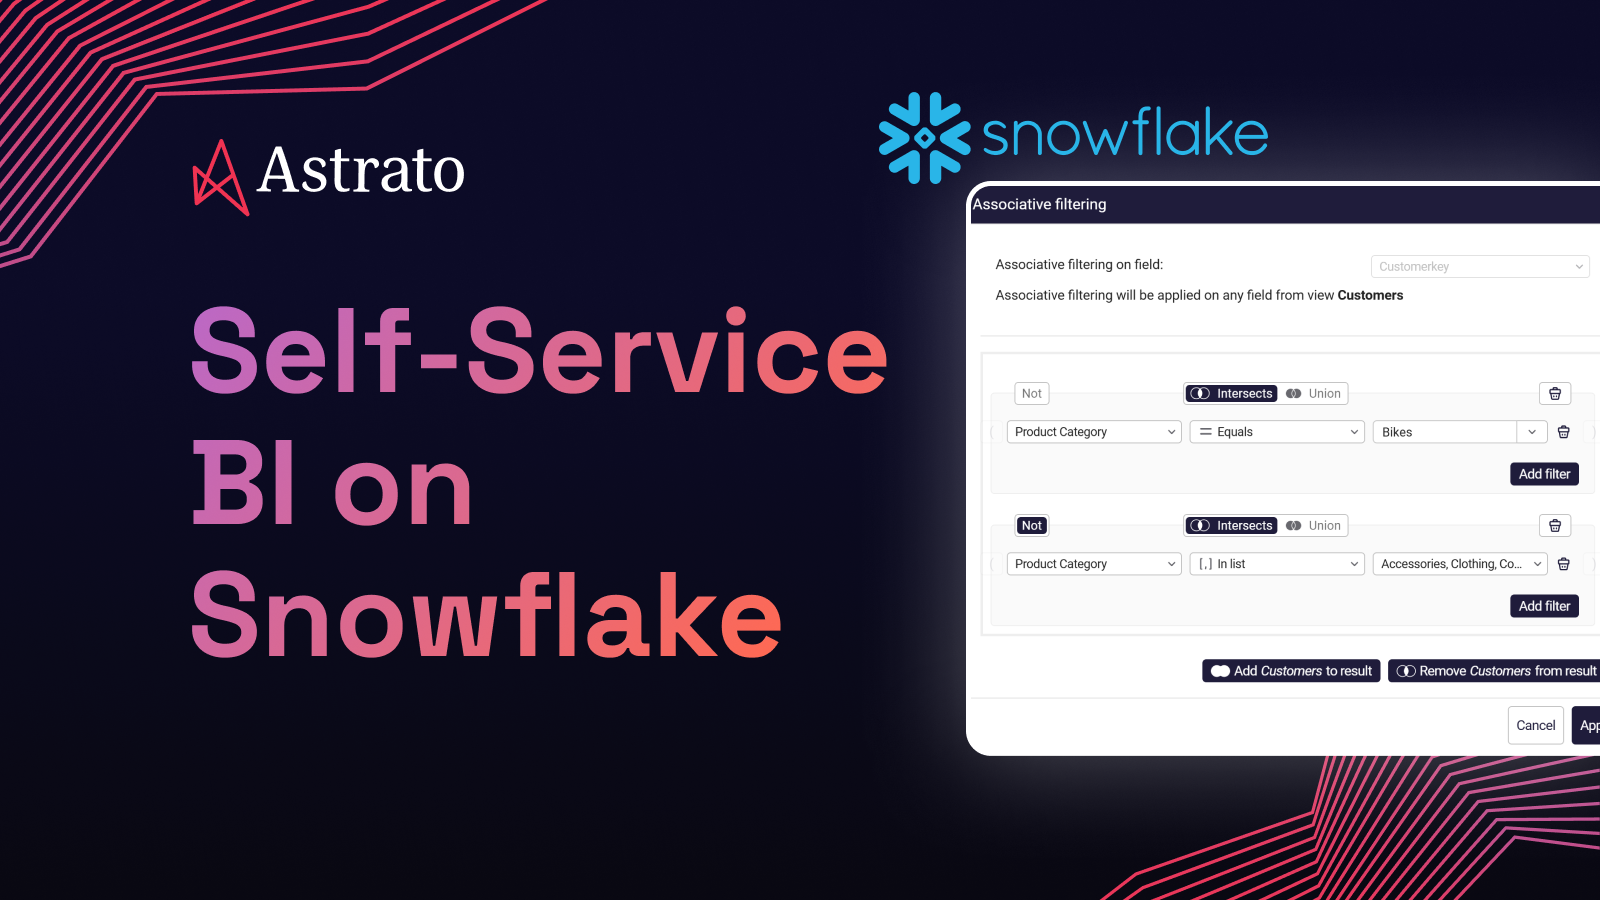
Astrato

Astrato is a warehouse-native business intelligence platform built around guided self-service for Snowflake-backed teams. Every query runs live against Snowflake — no extracts, no caching layer, no refresh schedules. Snowflake roles, row-level security, and column masks flow through to the dashboard automatically.
The semantic layer is the centre of the self-service model. Astrato consumes Snowflake semantic models when they exist, and provides its own modelling layer when they don’t. Business users build dashboards by picking from curated datasets and pre-defined metrics — they don’t write SQL, and they can’t redefine the basics. Natural-language queries are grounded in the same semantic model and can be powered by Snowflake Cortex (which gives access to Meta’s Llama, Claude, DeepSeek, and Mistral), Google Gemini, OpenAI, or a bring-your-own LLM.
Doctena, a European healthcare scheduling platform, replaced a single-analyst bottleneck with Astrato self-serve dashboards on Snowflake:
“Today, most teams self-serve in Astrato. Dashboards that once took weeks and multiple follow-ups are now live in minutes.”
— Melanie Menkes, CRO & CMO, Doctena
Astrato is strongest for Level 2 and 3 users — the explorer and builder slices most platforms underserve.
Pros
- Live-query against Snowflake — no extract layer, no refresh schedules, dashboards always reflect current warehouse state
- Guided self-service via semantic layer — Level 2 explorers and Level 3 builders work inside boundaries the data team defines, preventing metric sprawl
- Snowflake security inherited automatically — row-level security, column masks, and roles flow through without a parallel permission model
- Multi-LLM AI grounded in the semantic model — Cortex, Gemini, OpenAI, or BYO, with natural-language queries that don’t hallucinate against raw schemas
- Writeback under governed SQL — dashboards become operational tools, not just read-only views
Cons
- Less natural for Level 4 SQL-native analysts than notebook-first tools like Hex
- No on-prem deployment — cloud-only rules it out for air-gapped environments
- Younger ecosystem than the legacy BI vendors, with fewer third-party integrations
Sigma Computing

Sigma’s self-service angle is the spreadsheet UI. Users who think in Excel pivots can model and explore warehouse data in a familiar surface, with live queries against Snowflake. The platform is genuinely accessible for spreadsheet-fluent analysts — Level 3 builders and Level 4 analysts who’d rather not write SQL.
The catch is that “spreadsheet-fluent” is itself a skill bar. A marketing manager who hasn’t built a complex pivot table won’t find Sigma intuitive. The Level 2 explorer surface is thinner than the marketing suggests. Sigma has invested in natural-language and AI features to broaden the audience, and the trajectory is clear, but at the time of writing the spreadsheet metaphor still anchors the experience.
Pros
- Spreadsheet UI is a real onramp for analysts comfortable with Excel pivots
- Live-query architecture against Snowflake, with no extract layer
- Input tables enable basic writeback for Level 3 builders
- Strong governance integration with Snowflake roles and row-level security
- Active investment in AI features is closing the natural-language gap
Cons
- Spreadsheet UX is unfamiliar to Level 2 explorers who don’t live in Excel
- Per-viewer pricing can become expensive when self-service actually scales
- Visualization presentation skews “analyst tool” rather than “polished dashboard”
- Semantic layer is less mature than Looker’s or Astrato’s
- Less natural for Level 1 consumers — the surface is built for builders
ThoughtSpot
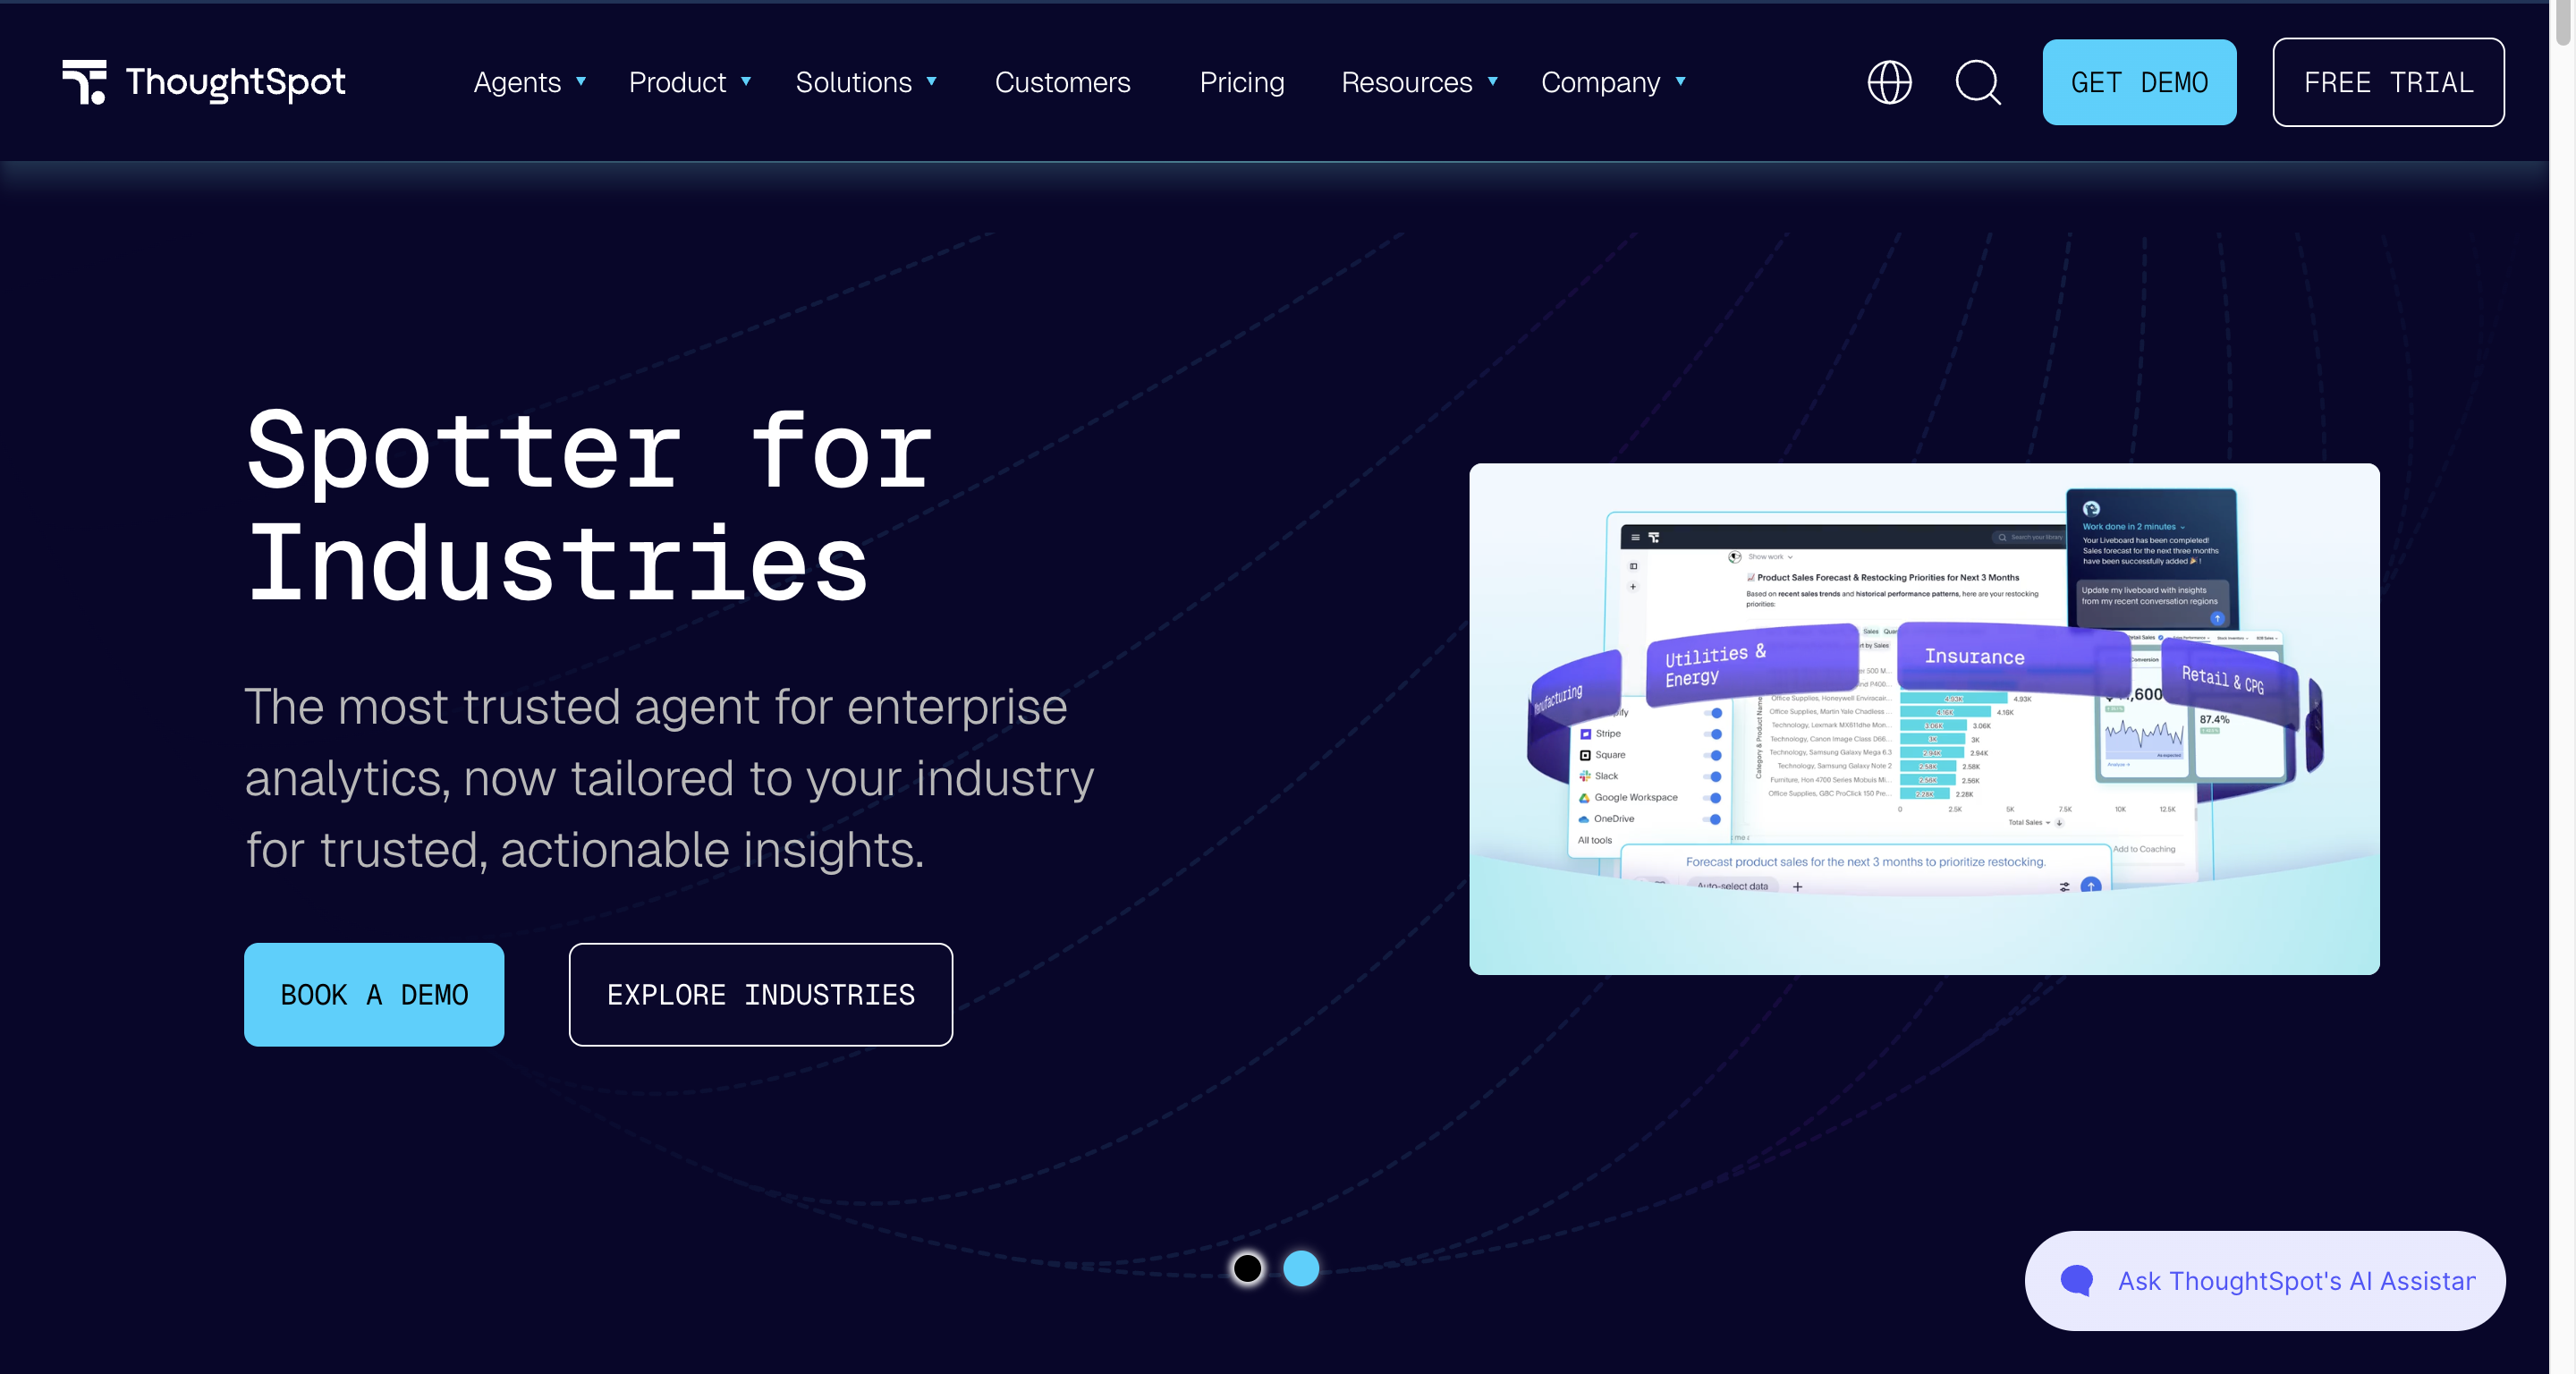
ThoughtSpot leads with natural-language search. Users type a question and get a chart back, grounded in a “worksheet” the data team has prepared. For Level 2 explorers asking direct factual questions, this surface is genuinely useful — the cognitive load is lower than building a dashboard from scratch.
The limit is that search-first interfaces work well for direct questions and less well for multi-step exploration. A Level 3 builder constructing a multi-dimensional dashboard often hits a ceiling. ThoughtSpot has expanded into Liveboards and broader dashboarding to address this, but the platform’s centre of gravity remains the search experience.
Pros
- Natural-language search is a real Level 2 surface for direct factual questions
- Strong AI investment — natural-language is the product, not a bolt-on
- Worksheet model gives the data team control over what’s exposed to search
- Good integration with Snowflake as a data source
- Works well as a complement to a more traditional dashboarding platform
Cons
- Multi-step exploration and complex dashboard building hit a ceiling faster than competitors
- Pricing skews enterprise — small teams find it expensive
- Worksheet modeling is its own skill the data team has to learn
- Visualization breadth narrower than Tableau or Sigma
- Best as a search layer rather than a full BI stack
Hex
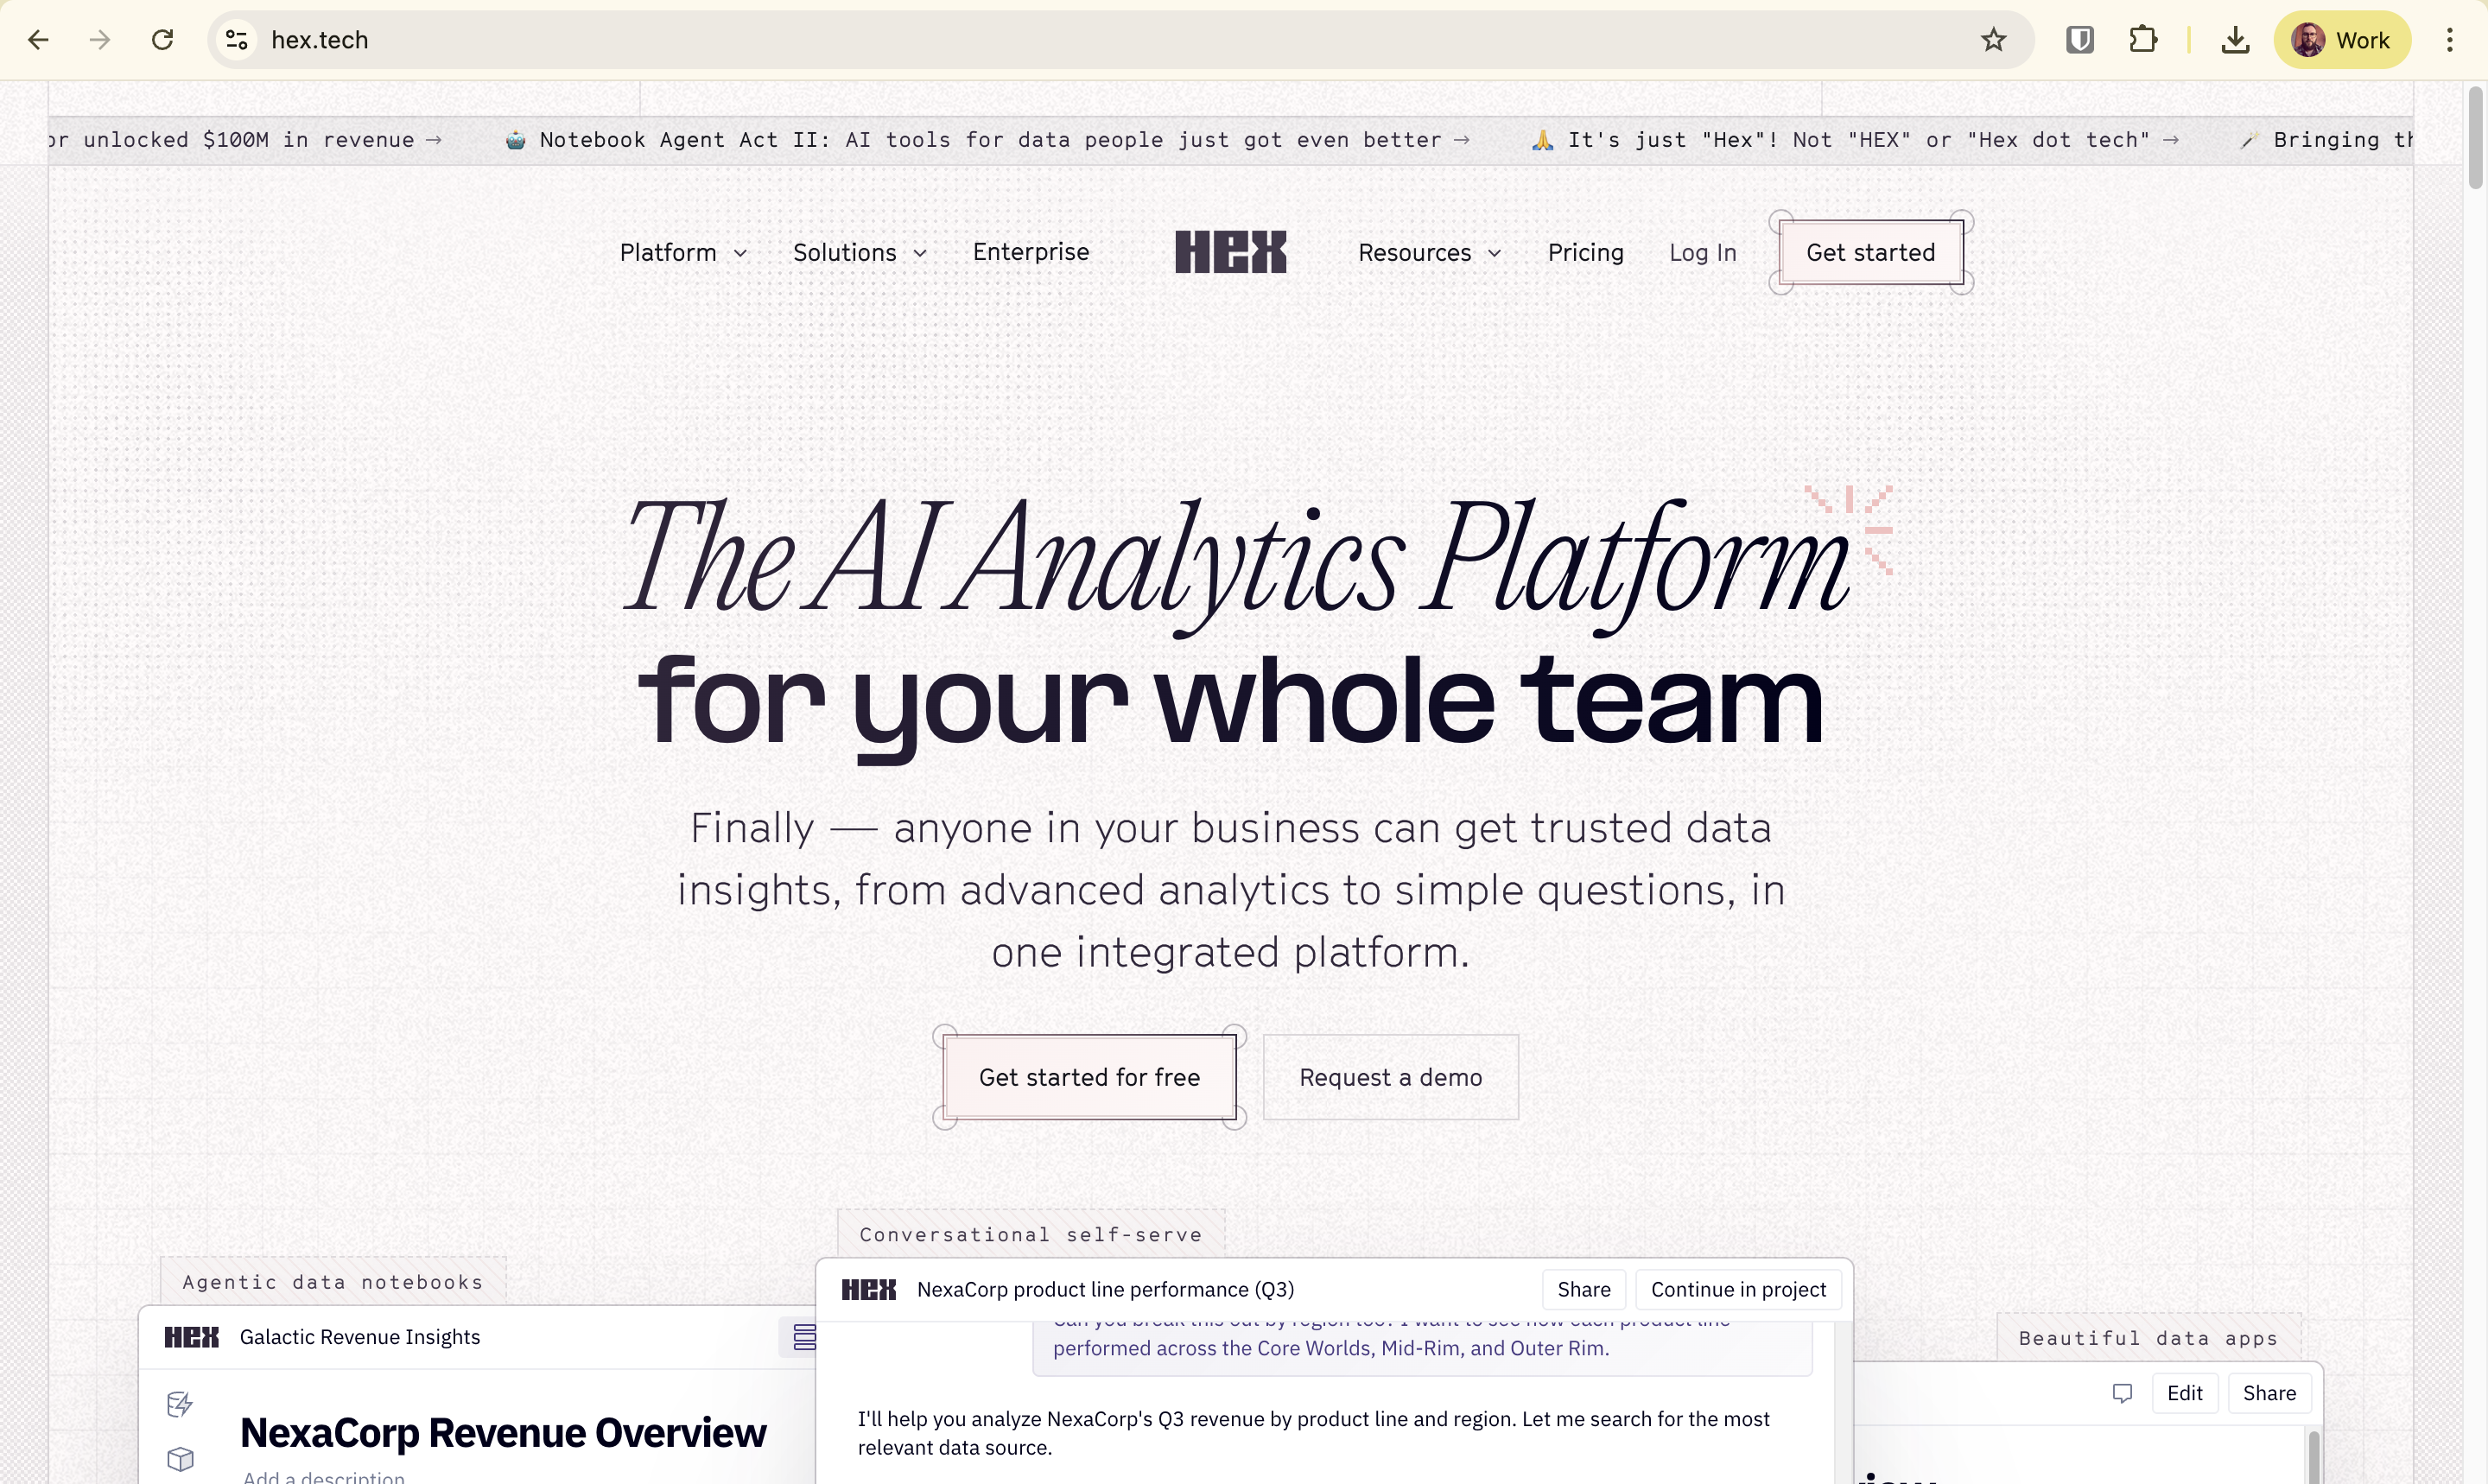
Hex is notebook-first. Analysts write SQL and Python in cells, build dataframes, and publish results as interactive apps. For Level 4 power users — data scientists, product analysts, technical RevOps — Hex is genuinely excellent.
Hex doesn’t pretend to be self-service for non-technical users, and that honesty is part of its credit. Including it in a self-service-for-non-technical-teams comparison is mostly a category error. Some teams do try to use it that way, and find that “publishing a Hex notebook as an app” doesn’t make the underlying surface accessible. The marketing manager opening a Hex app sees the output, not the notebook — but if they want to ask a different question, they’re back to filing a ticket.
Pros
- Excellent for Level 4 analysts and data scientists working in SQL and Python
- Notebook surface is the right tool for exploratory analysis
- Magic AI features genuinely help SQL-fluent users move faster
- Strong collaborative editing for technical teams
- Published apps are clean for Level 1 consumption of finished analyses
Cons
- Not self-service for Level 2 or 3 users — the surface is built for analysts
- “Publishing as an app” is one-way; non-technical users can’t extend or modify
- Per-user pricing scales with technical headcount, not adoption
- No native semantic layer — relies on whatever modeling exists upstream
- Including it in a self-service evaluation is mostly a category mismatch
Looker
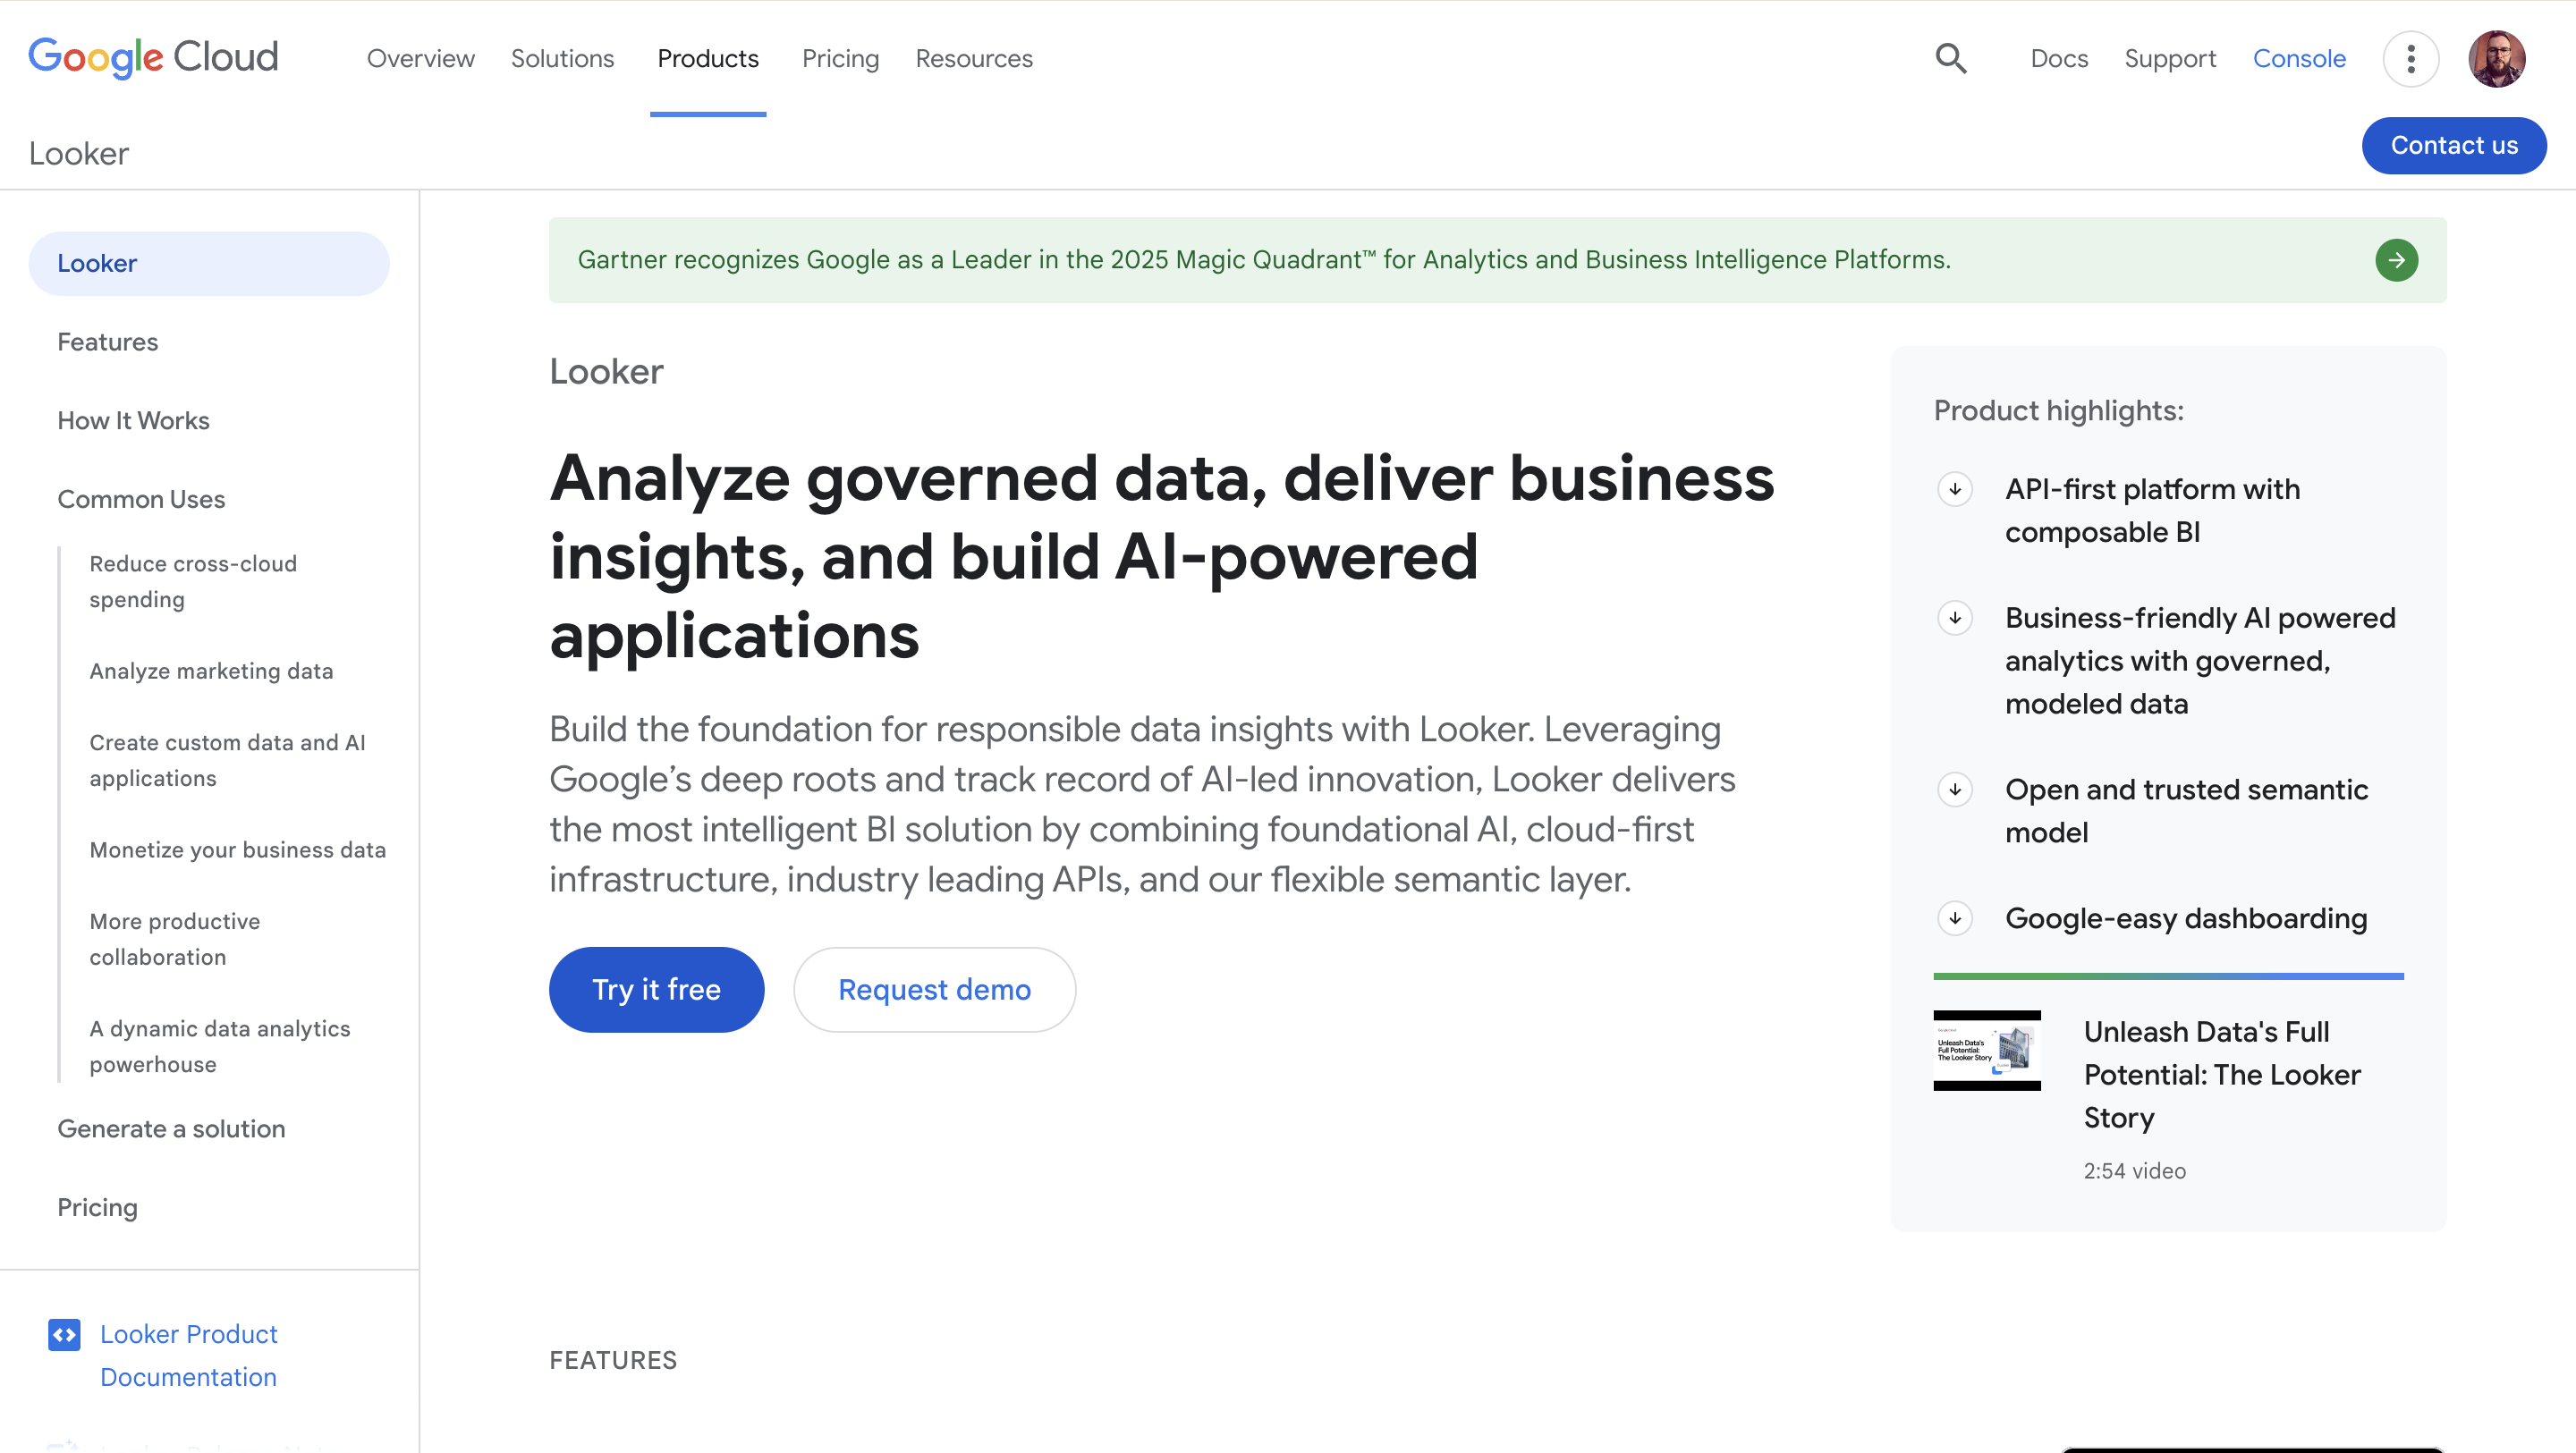
Looker (now part of Google Cloud) is built around LookML — a code-based semantic modeling layer that defines metrics, dimensions, and joins centrally. Once the LookML model is mature, Level 3 builders can construct new dashboards from governed primitives without writing SQL. The model prevents metric sprawl by design.
The cost is the LookML model itself. Building and maintaining it is a Level 4 task that requires a dedicated modeler. Smaller teams without that role often end up with thin LookML and dashboards that hit the model’s limits quickly. Looker Studio Pro extends the consumption surface but doesn’t change the underlying fact that Looker self-service runs through a semantic layer the analyst team owns.
Pros
- LookML semantic layer is the strongest governance model in the comparison set
- Once the model is built, Level 3 builders genuinely can self-serve without SQL
- Tight integration with Google Cloud and BigQuery — Snowflake support is solid but secondary
- Mature governance, access controls, and data validation
- Looker Studio Pro extends consumption to Level 1 users
Cons
- LookML modeling is a Level 4 skill — small teams without a dedicated modeler struggle
- Pricing is complex and skews enterprise
- Snowflake integration is good but the platform’s centre of gravity is BigQuery
- Dashboard-building UX is less polished than Sigma or Astrato
- Long ramp before self-service actually pays off
Metabase
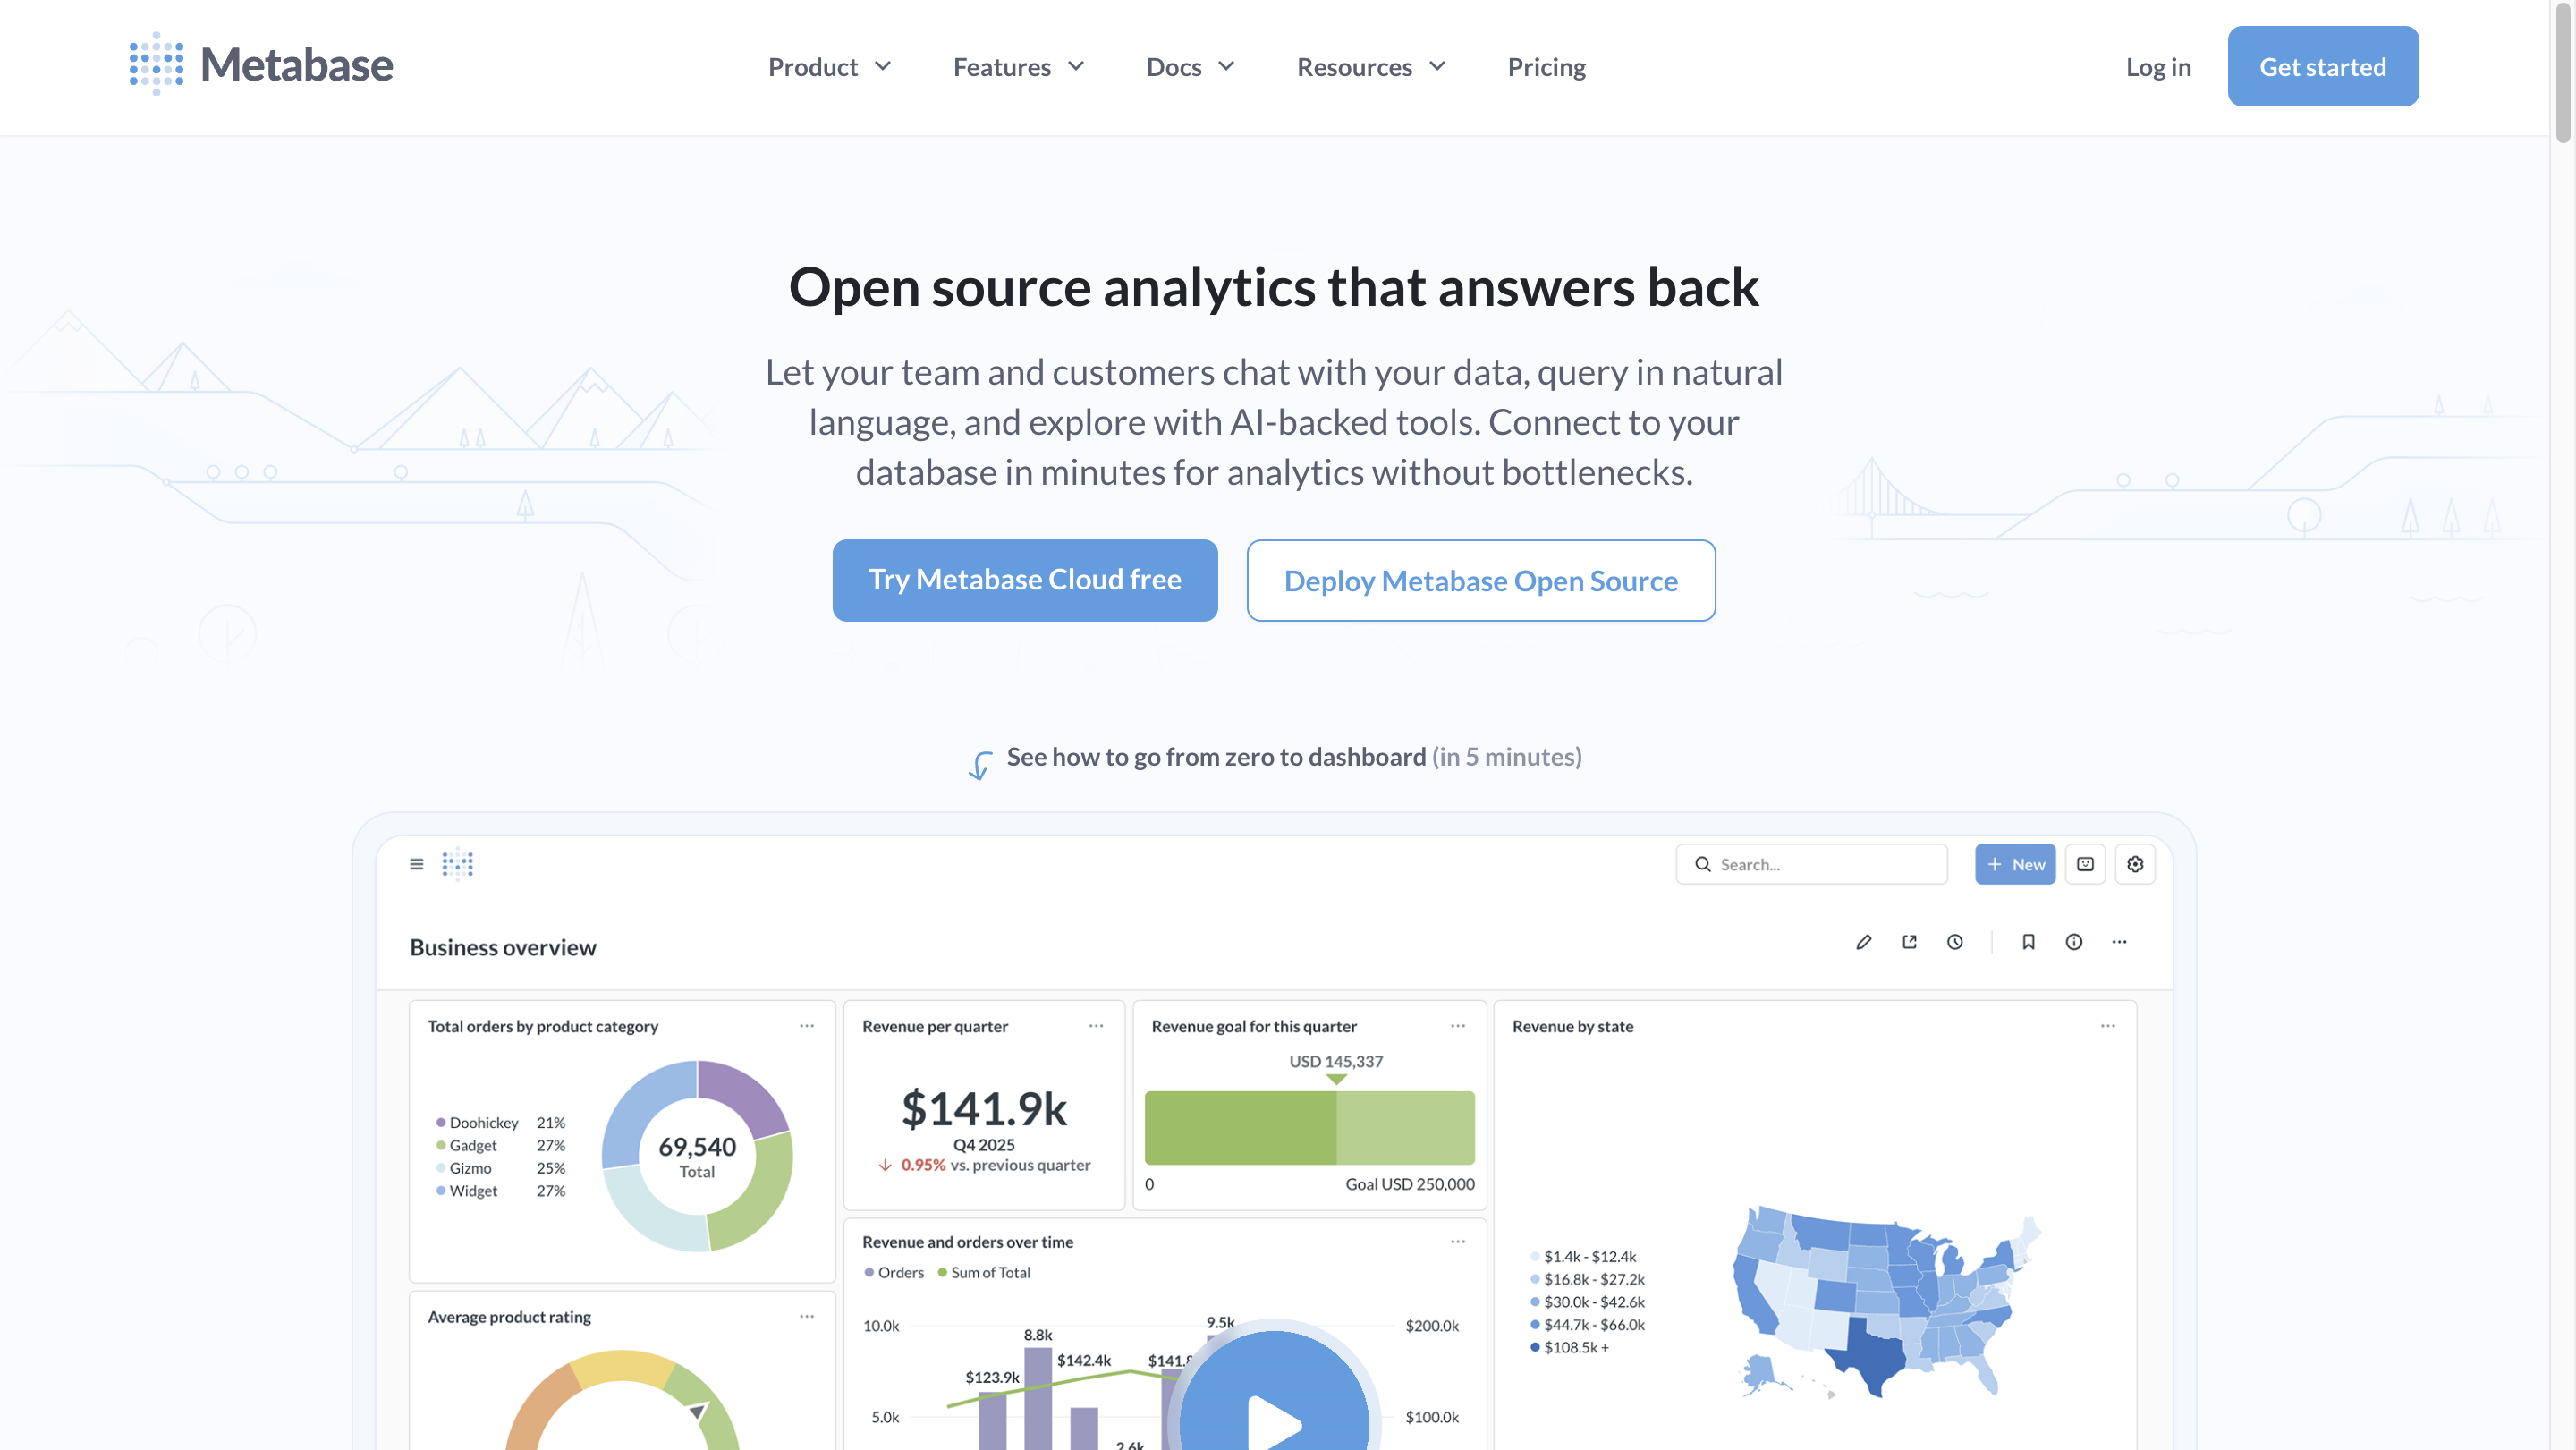
Metabase is the genuine no-code option for Level 1 and simple Level 2 use cases. Users browse curated tables, build a chart from a question builder, and share it. For teams whose self-service ambition is mostly Level 1 with some light exploration, Metabase delivers more cleanly than the enterprise platforms.
The ceiling is Level 3. The moment users need to join two curated datasets, define a metric centrally, or work with a semantic layer the data team has invested in, Metabase runs out. The platform has added a model layer to address this, but it’s thinner than Looker’s or Astrato’s. For pure no-code at Level 1–2 it’s strong; for guided self-service at Level 2–3 it’s underpowered.
Pros
- Genuinely accessible for Level 1 consumers and simple Level 2 explorers
- Open-source tier makes it cheap to start
- Question builder is intuitive for users without SQL skills
- Snowflake support is solid for basic use cases
- Low operational overhead for small teams
Cons
- Breaks at Level 3 — semantic layer thin, joins limited, governance manual
- Metric sprawl is the default outcome at scale, not the exception
- Visualization breadth narrower than the enterprise platforms
- Snowflake-specific features (Cortex, semantic models) less integrated
- Often outgrown by teams whose ambition expands past Level 2
Power BI
Power BI is the default BI tool for organisations already in the Microsoft ecosystem. Semantic models are first-class, DAX is powerful for Level 4 analysts, and Copilot is investing heavily in natural-language for Level 2 surfaces. For teams already running Office 365, the integration story is real.
The Snowflake angle is more complicated. Power BI’s import mode performs better but caches data outside Snowflake — defeating the warehouse-native model. DirectQuery against Snowflake works but is treated as a secondary path with documented performance trade-offs. Self-service on top of DirectQuery against Snowflake is workable but not the platform’s strongest configuration.
Pros
- Mature semantic model layer when teams invest in building it
- Tight Microsoft ecosystem integration — Teams, SharePoint, Excel, Fabric
- DAX is powerful for Level 4 analysts willing to learn it
- Copilot natural-language features improving rapidly
- Per-seat pricing is competitive for organisations already on Microsoft licenses
Cons
- DirectQuery against Snowflake is a secondary mode — best performance comes from extracts that defeat warehouse-native architecture
- DAX and Power Query learning curves are real Level 4 barriers
- Self-service for Level 2 explorers is weaker than the marketing suggests
- Microsoft-ecosystem optimization makes Snowflake integration second-class
- Governance depends on teams enforcing the semantic model; many don’t
A decision rubric: matching the platform to the team
The honest decision framework reads in one direction: identify which level of user dominates your self-service ambition, and pick the platform that genuinely serves that level — not the one that claims to serve all of them.
The mistake to avoid is buying a platform that claims to serve all four levels equally. None do. The platforms that try usually serve Level 4 well and the others poorly, with marketing copy that reverses the order.
Customer evidence: what good self-service looks like
Three Astrato customers illustrate what guided self-service on Snowflake looks like in practice — used here as evidence, not feature showcases.
Doctena is a European healthcare scheduling platform serving providers and patients across six countries. Their data team was a single analyst fielding requests from sales, marketing, finance, and customer care — the classic bottleneck pattern. They modernized onto Snowflake with Matillion for ETL and Astrato as the analytics layer. Today most teams self-serve in Astrato; the dashboards that used to take weeks of analyst time now appear in minutes. The pattern that worked: governance and computation stay in Snowflake; Astrato exposes curated semantic models to business users who explore within the boundaries the data team set.
PetScreening runs pet policy management software for over 24,000 property management firms. Their self-service problem was external — customers wanted real-time analytics access, and account managers were drowning in custom-report requests. They embedded Astrato into the customer-facing product, running live on Snowflake. The Director of BI and Operations described the impact:
“Our customers are already thrilled by the improvement in user experience we have seen from switching to Astrato, which is enabling their non-technical users to self-serve for the insights they need to make informed decisions and be far more productive.”
— Beau Dobbs, Director of BI & Operations, PetScreening
This is Level 2 self-service for an external audience — exactly the case where the cognitive bar matters most because the users haven’t been trained.
IAG Loyalty, the parent company of the Avios rewards program, modernized analytics for over 69 million members. Their architecture decision was to keep all logic in Snowflake and use Astrato as the visualization layer — what Hemming describes as a “headless” approach. The result: 1 in 3 monthly users now use Astrato daily, which is unusually high active-use density for a BI tool. The lesson: when the semantic layer lives in the warehouse and the BI tool exposes it cleanly, adoption follows.
The thread across all three: self-service that works is grounded in a semantic layer the data team owns, exposed through an interface non-technical users can navigate, with governance enforced at the warehouse — not the dashboard.
Frequently asked questions
What does “self-service BI” actually mean for non-technical teams?
Self-service BI means non-technical users can answer their own questions from data without filing a ticket. The honest version is more specific: it depends on which level of user (consumer, explorer, builder, or analyst) the platform serves. Most “self-service BI” tools serve analysts well and the other levels poorly. For non-technical teams, the right platforms are the ones that genuinely serve Level 2 explorers and Level 3 builders — typically through a semantic layer that prevents metric chaos.
Is Snowsight enough for self-service BI on Snowflake?
Snowsight serves SQL-fluent users adequately and is free with Snowflake. It’s not a self-service tool for non-technical teams — there’s no semantic layer, the surface is built for analysts, and dashboarding is basic. It’s worth using as the floor of your evaluation: if your users adopt Snowsight, your self-service ambition is mostly Level 4. If they don’t, you need a platform that actually serves the level you’re trying to enable.
How do I prevent self-service BI from creating governance chaos?
Move metric definitions, joins, and access controls into the warehouse layer — defined in Snowflake views, dbt models, or a semantic model the BI tool consumes. Pick a BI platform that consumes that semantic layer rather than letting users redefine it. The pattern is sometimes called “shift-left governance” or “headless BI.” Astrato, Looker, and a mature Sigma model all support this pattern. Metabase and Tableau in their default configurations do not.
Which BI tool is best for non-technical teams on Snowflake?
It depends on which level of user dominates your team. For Level 1 consumers with simple needs, Metabase is the cleanest fit. For Level 2 explorers and Level 3 builders who need governed self-service, Astrato is built specifically for this slot. For spreadsheet-fluent analysts, Sigma is strong. For natural-language-first organisations, ThoughtSpot. The wrong question is “which is the best self-service tool overall” — that question doesn’t have an answer.
Can AI and natural-language queries replace traditional self-service BI?
Not yet, and probably not entirely. Natural-language queries work well for Level 2 explorers asking direct factual questions, especially when grounded in a semantic model like Snowflake Cortex Analyst. They work less well for multi-step exploration, Level 3 dashboard building, and any analysis that requires the user to understand the model. Treat AI as a Level 2 surface that complements traditional dashboarding, not as a replacement. The platforms taking this seriously (Astrato, Looker, ThoughtSpot) connect the natural-language interface to a governed semantic layer rather than running it directly on the warehouse schema.
See guided self-service on Snowflake
Astrato is the warehouse-native BI platform for guided self-service, data apps, and embedded analytics on Snowflake. Live-query architecture, governed semantic layer, and multi-LLM AI grounded in your data model. Book a demo or explore the Snowflake integration.
Ready to experience next-gen analytics?
See how Astrato runs natively in your warehouse.