Introducing Astrato’s Nash AI
Your team’s agentic BI assistant – it builds the trusted data model first, then the dashboards on top, all in plain language. Nash AI is in public preview now.

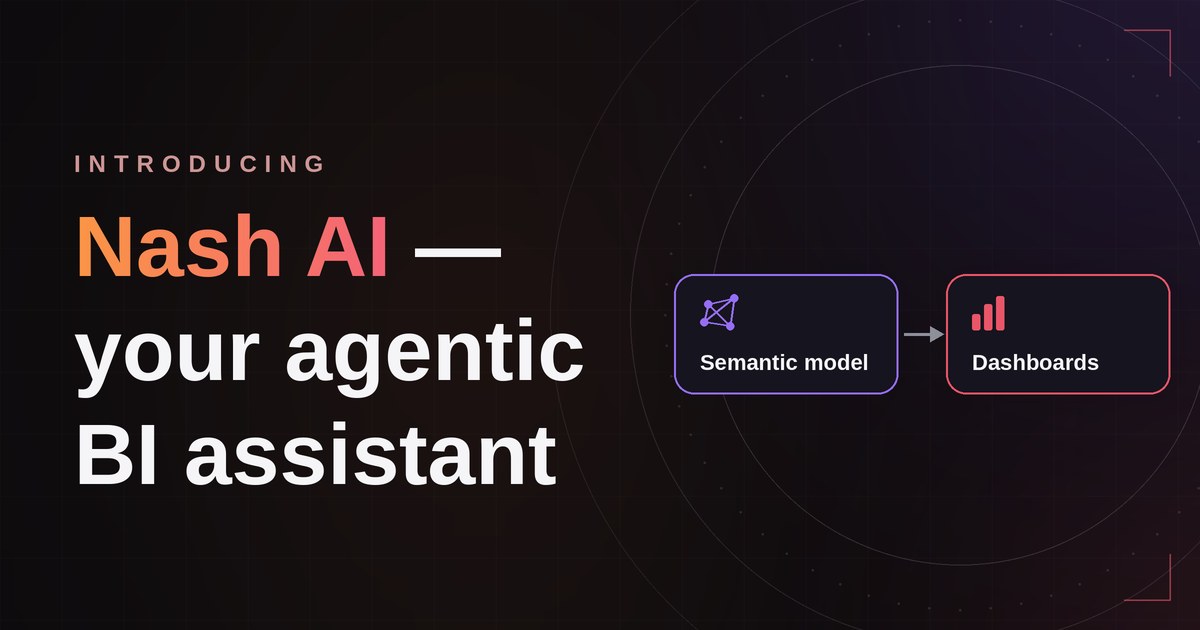
Your team’s agentic BI assistant – it builds the trusted semantic model first, then the dashboards on top, all in plain language. Nash AI is in public preview now.
If you run BI for your team, you know the drill. The requests never stop. Every new dashboard means modelling the data, writing the measures, wiring up the joins – and then doing it all over again the next time someone asks. AI was supposed to help. But most AI in BI just hands you a chart, and a chart you can’t trust is worse than no chart at all. Because the hard part was never drawing the chart – it was turning raw data into a number you'd stake a decision on.
While others generate charts, Nash AI generates understanding. It’s an agentic assistant that lives inside Astrato and does the work in the right order: it builds your governed semantic model first, then the dashboards on top. Because it works through the model your team already agreed on, the answers stay trustworthy. Nash speeds up the tedious part without hallucinating the math.
What you can do with Nash AI today
Build your semantic model
The dashboard is easy. The business logic is hard.
Tell Nash what you’re trying to measure and it reads your warehouse schema, then drafts the foundation for you: dimensions, metrics, relationships, hierarchies, drill paths and reusable calculations. Nothing happens in a black box – every action is listed in the panel so you can see exactly what Nash is doing and why. You can always inspect the produced results in the UI, and refine it. Your team stays in charge of the model and Nash handles the tedious bits in between.
Bring your old BI logic with you
Years of DAX and Set Analysis don’t have to be rebuilt by hand.
Moving off Tableau, Power BI, Qlik or Looker is slow because the business logic is locked inside the old tool. Paste it in and Nash translates years of Qlik Scripts, Qlik Set Analysis, Power BI DAX, Tableau calculations, legacy SQL and Excel logic into governed semantic assets, showing the original next to its Astrato equivalent, so you can see exactly what it did.
Build a dashboard from a sentence
Describe what you need (or just say ‘Build me a dashboard”) and Nash builds it on the canvas.
With the model in place, anyone can ask for the dashboard they need, and Nash lays it out on Astrato’s pixel-perfect canvas: KPIs, charts, filters and navigation, all configured. It builds several charts in the same pass rather than one after another, listing every step as it goes. Keep refining by chatting, or jump onto the canvas yourself. The same prompts work whether you’re a BI engineer or someone in ops:
- “Build an executive ARR dashboard.”
- “Create a customer health monitoring app.”
- “Show late shipments by warehouse.”
Get answers about your semantic layer
Ask for a detailed overview, in plain language.
Click “Describe my semantic layer” and Nash reads the whole thing, then hands back a clear summary: tables, joins, dimensions, measures, and where the model has gaps. A new analyst can understand the model in under a minute, with nothing to read first. You can also define new metrics by just saying what you mean – “Define active customers as anyone who’s purchased in the last 90 days” – and it lands in the semantic layer as a reusable, governed asset.
Make sweeping changes in one go
One instruction, applied across the whole sheet.
Restyle the page, swap every pie chart for a bar, reformat all the visuals, or switch the sheet to euros – ask once and Nash applies it to every visual on the sheet in a single pass, instead of one chart at a time. As your semantic model grows, it can also run a consistency review to surface duplicate metrics and gaps before they turn into problems.
Work on several builds at once
Instruct, switch, instruct the next, review when each is ready.
Nash doesn't make you wait on a progress bar. Kick off a build on one semantic model or workbook, switch to another and start the next, then come back to review the results as they land. One person keeps several streams of work moving at once – not one at a time.
From warehouse to dashboard, start to finish
1. Connect your warehouse. Once it’s connected in Astrato, Nash reads your Snowflake, BigQuery or Databricks schemas and shows you what’s there.
2. Build the semantic model. “Build me a marketing-attribution model from our HubSpot, Salesforce and Google Ads data.” Nash proposes the joins, measures and dimensions.
3. Build the dashboard. “Build a marketing-attribution review for the QBR.” Nash lays it out on the canvas.
4. Refine and publish. Edit any chart directly, or keep talking to Nash. Publish through your usual draft-and-version workflow.
5. Keep it healthy. As things grow, Nash flags overlaps and gaps so they get fixed before anything breaks.
Human in the lead
We built Nash to speed up the work, not to take the wheel. A few things we got right from the start:
This is just the start
Nash AI is just getting started – here's some of what's on the way:
- Nash AI Analyst – ask questions of your data in plain language and get governed answers back.
- Nash for actions – go beyond dashboards to build workflows and data apps, so your analytics can act, not just report.
- Build from Claude or Copilot – create semantic layers from the tools your team already works in, via MCP.
- Business Questions as a semantic asset – capture the questions your team asks most, so Nash answers with more context.
Get started
Nash AI is in public preview now, for teams on Snowflake, BigQuery, Databricks or another modern warehouse.
Every BI team is carrying a backlog – dashboards that aren't built, metrics that aren't defined, people still waiting on answers. Nash is built to chip away at it with you, starting with the jobs you keep pushing to the next sprint. Got a semantic-layer rebuild on your list and no time to do it? That's exactly who this is for.
Open Astrato and point Nash at it – or book a walkthrough and we'll run it on your data.
Ready to experience next-gen analytics?
See how Astrato runs natively in your warehouse.