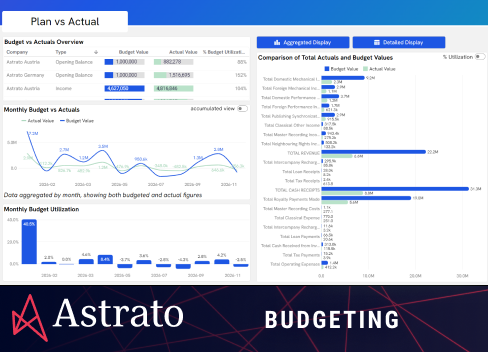
Effortless comparisons with grouped and stacked bar and column charts.
This Astrato demo shows how to use bar and column charts for trends over time, category breakdowns, and before/after states. Drag-and-drop setup, conditional formatting, and smart defaults highlight insights faster.

This dashboard is interactive
Change the org, date range or click any chart — data updates on the fly.
Live demo
no login required
More demo apps

Ready to experience next-gen analytics?
See how Astrato runs natively in your warehouse.
SOC 2 Certified
GDPR Compliant
Predictable costs
