When Databricks Dashboards Aren’t Enough: AI/BI vs. Data Apps
Databricks AI/BI is a strong dashboard layer for the lakehouse. But there are operational use cases that need data apps, not dashboards.


You bought Databricks for a reason. The lakehouse holds the data. Unity Catalog governs it. Databricks SQL queries it. And somewhere in 2024 or 2025, Databricks AI/BI arrived as the native dashboard layer — with Genie offering conversational analytics on top.
For showing data, this stack works. Dashboards load. Genie answers questions. Executives see numbers. Analysts iterate.
But a different kind of request keeps landing on your desk. The VP of Sales wants the team to update the forecast inside the analytics view, not export it to a spreadsheet. Finance wants budget adjustments routed and approved without three tools and a Slack thread. Customer Success wants to flag at-risk accounts and assign owners from the same screen where the health score lives. Ops wants to override a reorder point and have the change persist where every downstream system can see it.
None of these are dashboards. They’re workflows. They need the data to flow both ways — out to the screen, and back to the warehouse.
This is where AI/BI stops, and where the conversation about data apps starts. This article is about the gap, the use cases that live inside it, and the vendors competing to fill it.
TL;DR
Databricks AI/BI is a strong dashboard and conversational-analytics layer for the Databricks lakehouse. It’s read-only by design. A growing share of internal use cases — forecasts, approvals, customer interventions, capacity adjustments, exception queues — need a different shape: the data app. Bidirectional, operational, governed at the warehouse. For those, you’ll need either Databricks Apps (the native code-led answer) or a third-party platform like Astrato or Sigma (purpose-built for warehouse-native data apps with writeback and workflows).
What Databricks AI/BI is, and where it stops
Databricks AI/BI is the dashboard and visualization layer built directly into the Databricks platform. It does what dashboards do, with two things going for it that competing tools can’t easily match.
The first is Genie, the conversational analytics interface. Users type questions in natural language and get back answers grounded in the lakehouse. Because Genie is built inside Databricks, it knows your Unity Catalog tables, your column semantics, and your governance rules. It can route through the same compute the rest of your platform uses. For natural language data exploration on Databricks-resident data, it has architectural advantages that any third-party tool will struggle to match.
The second is native lakehouse integration. AI/BI dashboards inherit Unity Catalog row filters and column masks automatically. Workspace and account levels of access flow through. Audit logs aggregate where the rest of your Databricks audit data lives. Refresh schedules use Databricks compute. If you’re a Databricks shop and your data lives there, AI/BI consolidates the dashboard layer into spend you already have.
AI/BI also covers the standard dashboard surface area you’d expect: a range of visualization types, formatting options, cross-filtering, widget-level filters, scheduling, email or Slack subscriptions, an intuitive interface for business users to consume, and increasingly capable tooling for data analysts to build on. Declarative automation bundles and Git integration let you manage dashboards programmatically, automate dashboard creation, and version control dashboard files alongside the rest of your infrastructure as code. For teams that live inside the Databricks workspace, the cohesion is real.

But here’s where it stops. AI/BI is a dashboard product. It shows data. Users consume. They cross-filter, drill, ask Genie a follow-up, export. What they don’t do is write back. They don’t submit values that change a forecast. They don’t approve a budget request. They don’t flag a customer or resolve an exception. The dashboard is one-directional by design — from the warehouse to the screen, and the loop doesn’t close.
That’s not a feature gap waiting to be filled in the next release. It’s an architectural choice. AI/BI optimizes for what dashboards do well. The roadmap for closing the loop on Databricks-resident data sits somewhere else — in Databricks Apps, which we’ll come to in the vendor section.
If you’re evaluating AI/BI for customer-facing embedded analytics — white-labeling dashboards into a SaaS product your customers use — that’s a different question, and one we’ve covered separately in our piece on embedded analytics for BigQuery and other warehouses. The customer-facing lane has different constraints. This article is about your internal teams.
The shape change: dashboards vs. data apps
Here’s the distinction worth keeping.
- A dashboard is read-only. The data flows one way: from the warehouse, through the BI layer, onto the screen. Users consume. They might filter, drill, or ask Genie a question, but they don’t change anything in the underlying data. The dashboard is optimized for showing.
- A data app is bidirectional. Data flows both directions. Users see the current state, but they can also act on it — input a new forecast number, approve a budget line, flag an exception, override a reorder point. Their actions write back to the warehouse, with audit trails, role-based permissions, and governed SQL keeping the operation safe. The data app is optimized for doing.
Most “we need a dashboard” requests in 2026 are actually data-app requests in disguise. The team needs to do something with the data, not just look at it. Dashboards survived as the default because BI tools couldn’t do anything else. That’s changing.
The cleanest way to state the architectural distinction is this: Databricks AI/BI is an AI-powered analytics layer for the Databricks lakehouse. A platform like Astrato is a warehouse-native operational analytics platform for building interactive data apps with writeback and workflows. Different shapes of tool for different shapes of problem. Both can be right; they’re usually right at the same time, for different jobs.
The shift from dashboard to data app is also a shift in who uses the analytics layer day-to-day. A dashboard’s audience is executives and analysts who want to see numbers. A data app’s audience is the people who own the operational process — the sales manager committing a forecast, the finance partner approving the adjustment, the CS lead working the customer health queue. They aren’t checking analytics. They’re doing their jobs, and the analytics layer is where they do them.
You’ll find the architectural foundation for this pattern — semantic layer, writeback, governance — in our data products reference architecture for Snowflake. The pattern is warehouse-native by necessity. If the action doesn’t land in the same warehouse the data lives in, the loop breaks.
Five operational use cases AI/BI can’t handle
Here are five workflows that look like dashboard requests but aren’t. Each is a recognizable piece of someone’s actual job. Each ends with the same verdict: AI/BI handles the dashboard part, and something else handles the workflow part.
1. Forecast submission and review
Quarter-end. The VP of Sales needs region managers to commit a forecast. Today, that probably looks like: managers see a dashboard showing pipeline and historical performance, then leave the dashboard, open a spreadsheet, enter their numbers, email the spreadsheet to FP&A, who reconciles, who pastes into a model, who routes to the CFO, who approves over Slack, who emails back, who updates the warehouse table.
The dashboard showed the data. The workflow lived everywhere else.
What this needs is a single interface where the manager sees the pipeline data and enters the committed number in the same screen. The number writes to the warehouse with an audit record — who entered it, when, against what underlying pipeline state. FP&A sees the submitted numbers as they land. The CFO reviews and approves inline. The committed forecast becomes a queryable table that every downstream system — finance models, sales comp, exec dashboards — references.
AI/BI can show the pipeline data. It can’t accept the input. It can’t route the approval. It can’t write back. The “input → review → approve → commit” loop is structurally outside what a read-only dashboard does. You need a data-app layer over the same Databricks lakehouse, or you need a code-led app built directly inside it.
2. Budget adjustment approvals
A department head needs to shift $40k from one budget line to another. Today, that’s a Jira ticket or an email or a finance portal that doesn’t talk to the warehouse. The actual budget table — the one finance reports against — gets updated last, manually, after several rounds of back-and-forth.

A data app collapses the loop. The department head sees current budget vs. spend in the analytics interface. They request an adjustment inside the same view, with the justification. The request routes to the right approver based on amount and cost center — finance partner under $25k, finance director under $100k, CFO above. The approver sees the request in their own queue inside the same app, with the context of the budget state. Approve. The adjustment writes to the warehouse table. The audit trail captures who approved what, when, and against which budget state.
This is straightforward as a data app and impossible as a dashboard. AI/BI dashboards can show the budget state beautifully. They have no concept of an approval workflow, an action trigger, or a state transition. You either build this in Databricks Apps with custom code, or use a third-party data-app platform that treats approval workflows as a first-class capability.
3. Customer health interventions
Customer Success has a health dashboard. Account health scores are computed in Databricks — usage signals, support ticket volume, NPS, contract status. The dashboard shows red, yellow, and green accounts.
When an account turns red, what happens? In most teams, a CSM sees the dashboard, copies the account name into a CRM, creates a task, assigns an owner, drops a note in Slack to alert the team, and updates a spreadsheet of “at-risk accounts we’re working.” Three tools, four steps, no single source of truth.
A data app shrinks this to a button. The CSM sees the at-risk account in the health view, clicks “open intervention,” fills in the play they’re running, assigns the owner, sets the next check date. All of it writes to a customer_interventions table in the warehouse. The exec view of “what’s our save rate this quarter” queries that table. The CSM’s queue view reads the same table. Nothing duplicates. Nothing drifts.
AI/BI shows the health score. It doesn’t open the intervention. Without a data-app layer, the analytics interface stops at the moment the work starts.
4. Capacity and inventory planning
Operations is looking at current stock alongside forecasted demand. The system’s reorder recommendation says order 400 units. The ops lead knows about a supplier disruption the system doesn’t, and wants to order 600 instead.
In a dashboard world, the ops lead writes that down somewhere, walks over to the procurement system, enters 600, and hopes the override sticks. The warehouse table that drives the next forecast run still says 400. The system “learns” the wrong thing.
In a data-app world, the override happens in the same interface. The ops lead enters 600 with a short justification. The change writes to a capacity_overrides table that the procurement system reads and the next forecast cycle picks up. The audit trail captures the override, who made it, and why — useful later when you’re back-testing forecast accuracy and want to separate model error from intentional override.
This is the pattern Impensa runs in healthcare supply chain — capacity adjustments, ordering, exception management — using Astrato over Snowflake as the operational layer their non-technical team can ship work in days, not weeks. Same shape on Databricks: the lakehouse holds the source data, the data-app layer holds the action.
5. Exception management queues
Finance, ops, and compliance teams spend a non-trivial share of their week working through queues of exceptions — anomalous transactions, reconciliation breaks, records that failed validation. Each one needs a human decision: investigate, reassign, resolve, escalate, write off.
A dashboard can show you the queue. It can’t help you work it. Resolving an exception means changing the record’s state, adding a resolution note, optionally assigning a new owner, and writing the change to wherever the next system picks it up.
The data-app version is one screen with three columns: the exception list on the left, the detail of the selected exception in the middle, the action panel on the right with resolve / reassign / escalate buttons and a notes field. The action writes to the warehouse. The queue updates. The next item appears. The exec view of “exceptions resolved this week, average time to resolution, top exception types” reads the same table the queue worker is writing to.
This is what teams currently do in some combination of Excel, JIRA, and the warehouse’s source system UI. Consolidating it into a warehouse-governed data app removes the seams. AI/BI shows the queue volume. The queue itself needs a different tool.
The pattern across all five is the same. The dashboard piece is real and AI/BI does it well. The workflow piece is where another layer earns its place. Either you build that layer in Databricks Apps with engineering time, or you bring in a warehouse-native data-app platform that treats writeback and workflows as first-class.
The vendor landscape for data apps on Databricks
Five categories of tools compete for the data-app use case. Most enterprise stacks end up with two of them.
Warehouse-native BI with data-app capabilities. Tools that started as BI and added writeback, workflows, and operational UX as first-class features. Astrato and Sigma are the two clearest examples. Closest fit when the use case is “operational analytics with workflows on warehouse-resident data.”
Databricks-native answers. AI/BI for dashboards and Genie for conversational analytics; Databricks Apps for code-led custom operational apps inside the lakehouse. Best when the data lives only in Databricks and your team has the engineering capacity to build apps.
Internal-tool builders. Retool, Appsmith, Budibase. Developer-led platforms for building custom internal UIs. Strong for general internal tools that go beyond analytics. Often the right call when the app needs a lot of custom logic and the data layer is just one of many systems it touches.
Analyst-first data app platforms. Hex, Streamlit, Plotly Dash. Notebook-first or code-first. Strong for analyst-driven exploratory apps. Powerful but typically require either Python skills or careful curation to land in front of business users.
Workflow-first platforms. Workato, Tray.io. Integration and workflow tools that can build operational UIs as a byproduct. Not analytics-shaped, but compete for the workflow side of data apps when the analytics part is light.
The six platforms most likely to be in a serious shortlist for “internal data apps on Databricks-backed data” are Astrato, Sigma, Databricks AI/BI, Databricks Apps, Retool, and Hex. Here’s how they compare.
Astrato

A warehouse-native BI platform built around the dashboard → data app → data product progression. Live-query architecture, no extracts. Connects to Databricks, Snowflake, BigQuery, Redshift, ClickHouse, PostgreSQL, Supabase, Dremio, MotherDuck. Writeback and approval workflows are first-class. Pixel-perfect operational UX. No-code so business users actually use the apps day-to-day. See the Astrato Data Apps & Workflows product page for the full capability set.
Where it fits: Internal operational data apps on multi-warehouse stacks that include Databricks, where the team needs writeback, approvals, and a polished business-user interface.
Pros
- Writeback to the warehouse under governed SQL, with audit trails and role-based edit permissions
- Multi-warehouse from day one — decisive if Databricks isn’t your only data home
- Approval workflows and action triggers serialize multi-step processes inside the app
- Pixel-perfect, no-code operational UX accessible to non-technical users
- Live-query architecture means the data app reflects warehouse state without extract refresh lag
Cons
- Doesn’t replace Databricks for ML or model serving; sits above it for the analytics layer
- For conversational analytics on Databricks lakehouse data specifically, Genie has a native integration advantage
- Adds a line item separate from existing Databricks spend
Sigma

The closest direct alternative to Astrato in this category. Spreadsheet-style UI familiar to analysts. Input tables provide writeback. Warehouse-native architecture. Stronger heritage on Snowflake than on Databricks but supports both.
Where it fits: Teams whose analysts live in Excel and want a spreadsheet-style interface for warehouse-resident data, with writeback for operational use cases.
Pros
- Spreadsheet-style interface — short learning curve for analyst-heavy teams
- Input tables for writeback cover many of the same use cases as Astrato’s writeback layer
- Warehouse-native, no-extract architecture
- Strong on level-of-detail expressions and calculated fields for analyst-driven modeling
- Mature on Snowflake, growing on Databricks
Cons
- Spreadsheet metaphor can constrain how operational apps look and feel for non-analyst end users
- Less pixel-perfect customization than Astrato for business-user-facing operational portals
- Workflow capabilities are more input-table-shaped than full approval-chain-shaped
- Same line-item cost concern as Astrato — separate from Databricks spend
- Strongest reference architectures still skew Snowflake-first
Databricks AI/BI

The native dashboard and conversational analytics layer. Genie for natural language, Unity Catalog governance flow-through, Databricks compute and refresh.
Where it fits: Dashboards on Databricks-resident data, especially when conversational analytics through Genie is a primary requirement.
Pros
- Native lakehouse integration — Unity Catalog row filters and column masks flow through automatically
- Genie’s natural language data exploration has architectural advantages on Databricks data
- No extra vendor — consolidates with existing Databricks spend
- Audit logs aggregate with the rest of Databricks
- Declarative automation bundles and Git integration for managing dashboards as code
Cons
- Read-only by design — no writeback, no approval workflows, no action triggers
- Operational UX is workspace-shaped, not portal-shaped
- Multi-warehouse stories require either federation or moving data to Databricks
- Less polished customization for branded internal portals
- Cannot serve the data-app use cases described above
Databricks Apps

A newer Databricks-native answer for custom operational apps. Built on Streamlit, Dash, Gradio, or Flask. Runs directly inside Databricks with native access to lakehouse data and Unity Catalog governance.
Where it fits: Teams with engineering capacity who want operational apps built directly in Databricks without a third-party tool.
Pros
- Native — runs inside Databricks, inherits governance, no separate data movement
- Full code control means the app can do anything Python can do
- Consolidates with existing Databricks spend and operations
- Strong for ML-integrated apps where model serving is part of the workflow
- Streamlit and Dash are mature frameworks for analyst-built apps
Cons
- Code-led — requires Python skills to build and maintain
- Less polished out-of-the-box UX than purpose-built operational analytics platforms
- No no-code visual composer for business-user maintainability
- Workflow and approval-chain logic must be hand-built per app
- Newer than the third-party data-app category — smaller library of patterns and references
Retool

A general-purpose internal-tool builder. Strong for custom internal UIs that touch many systems. Not analytics-native, but competes when the use case is “operational app that includes some data display.”
Where it fits: Internal tools that go well beyond analytics — admin panels, customer support tools, CRUD UIs over operational systems — where the warehouse is one input among many.
Pros
- Mature platform with broad connector library beyond just data warehouses
- Strong for custom UIs that need significant logic and integration
- Familiar to developer teams who’ve built internal tools before
- Component model gives precise control over operational UX
- Good for apps that are workflow-heavy and analytics-light
Cons
- Not warehouse-native — analytics is a connector, not the architecture
- Developer-led — limited no-code surface for business users to maintain apps
- Less suited to dashboard-heavy operational analytics use cases
- Governance has to be re-established outside Unity Catalog
- Seat-based pricing can scale unpredictably with broad rollout
Hex
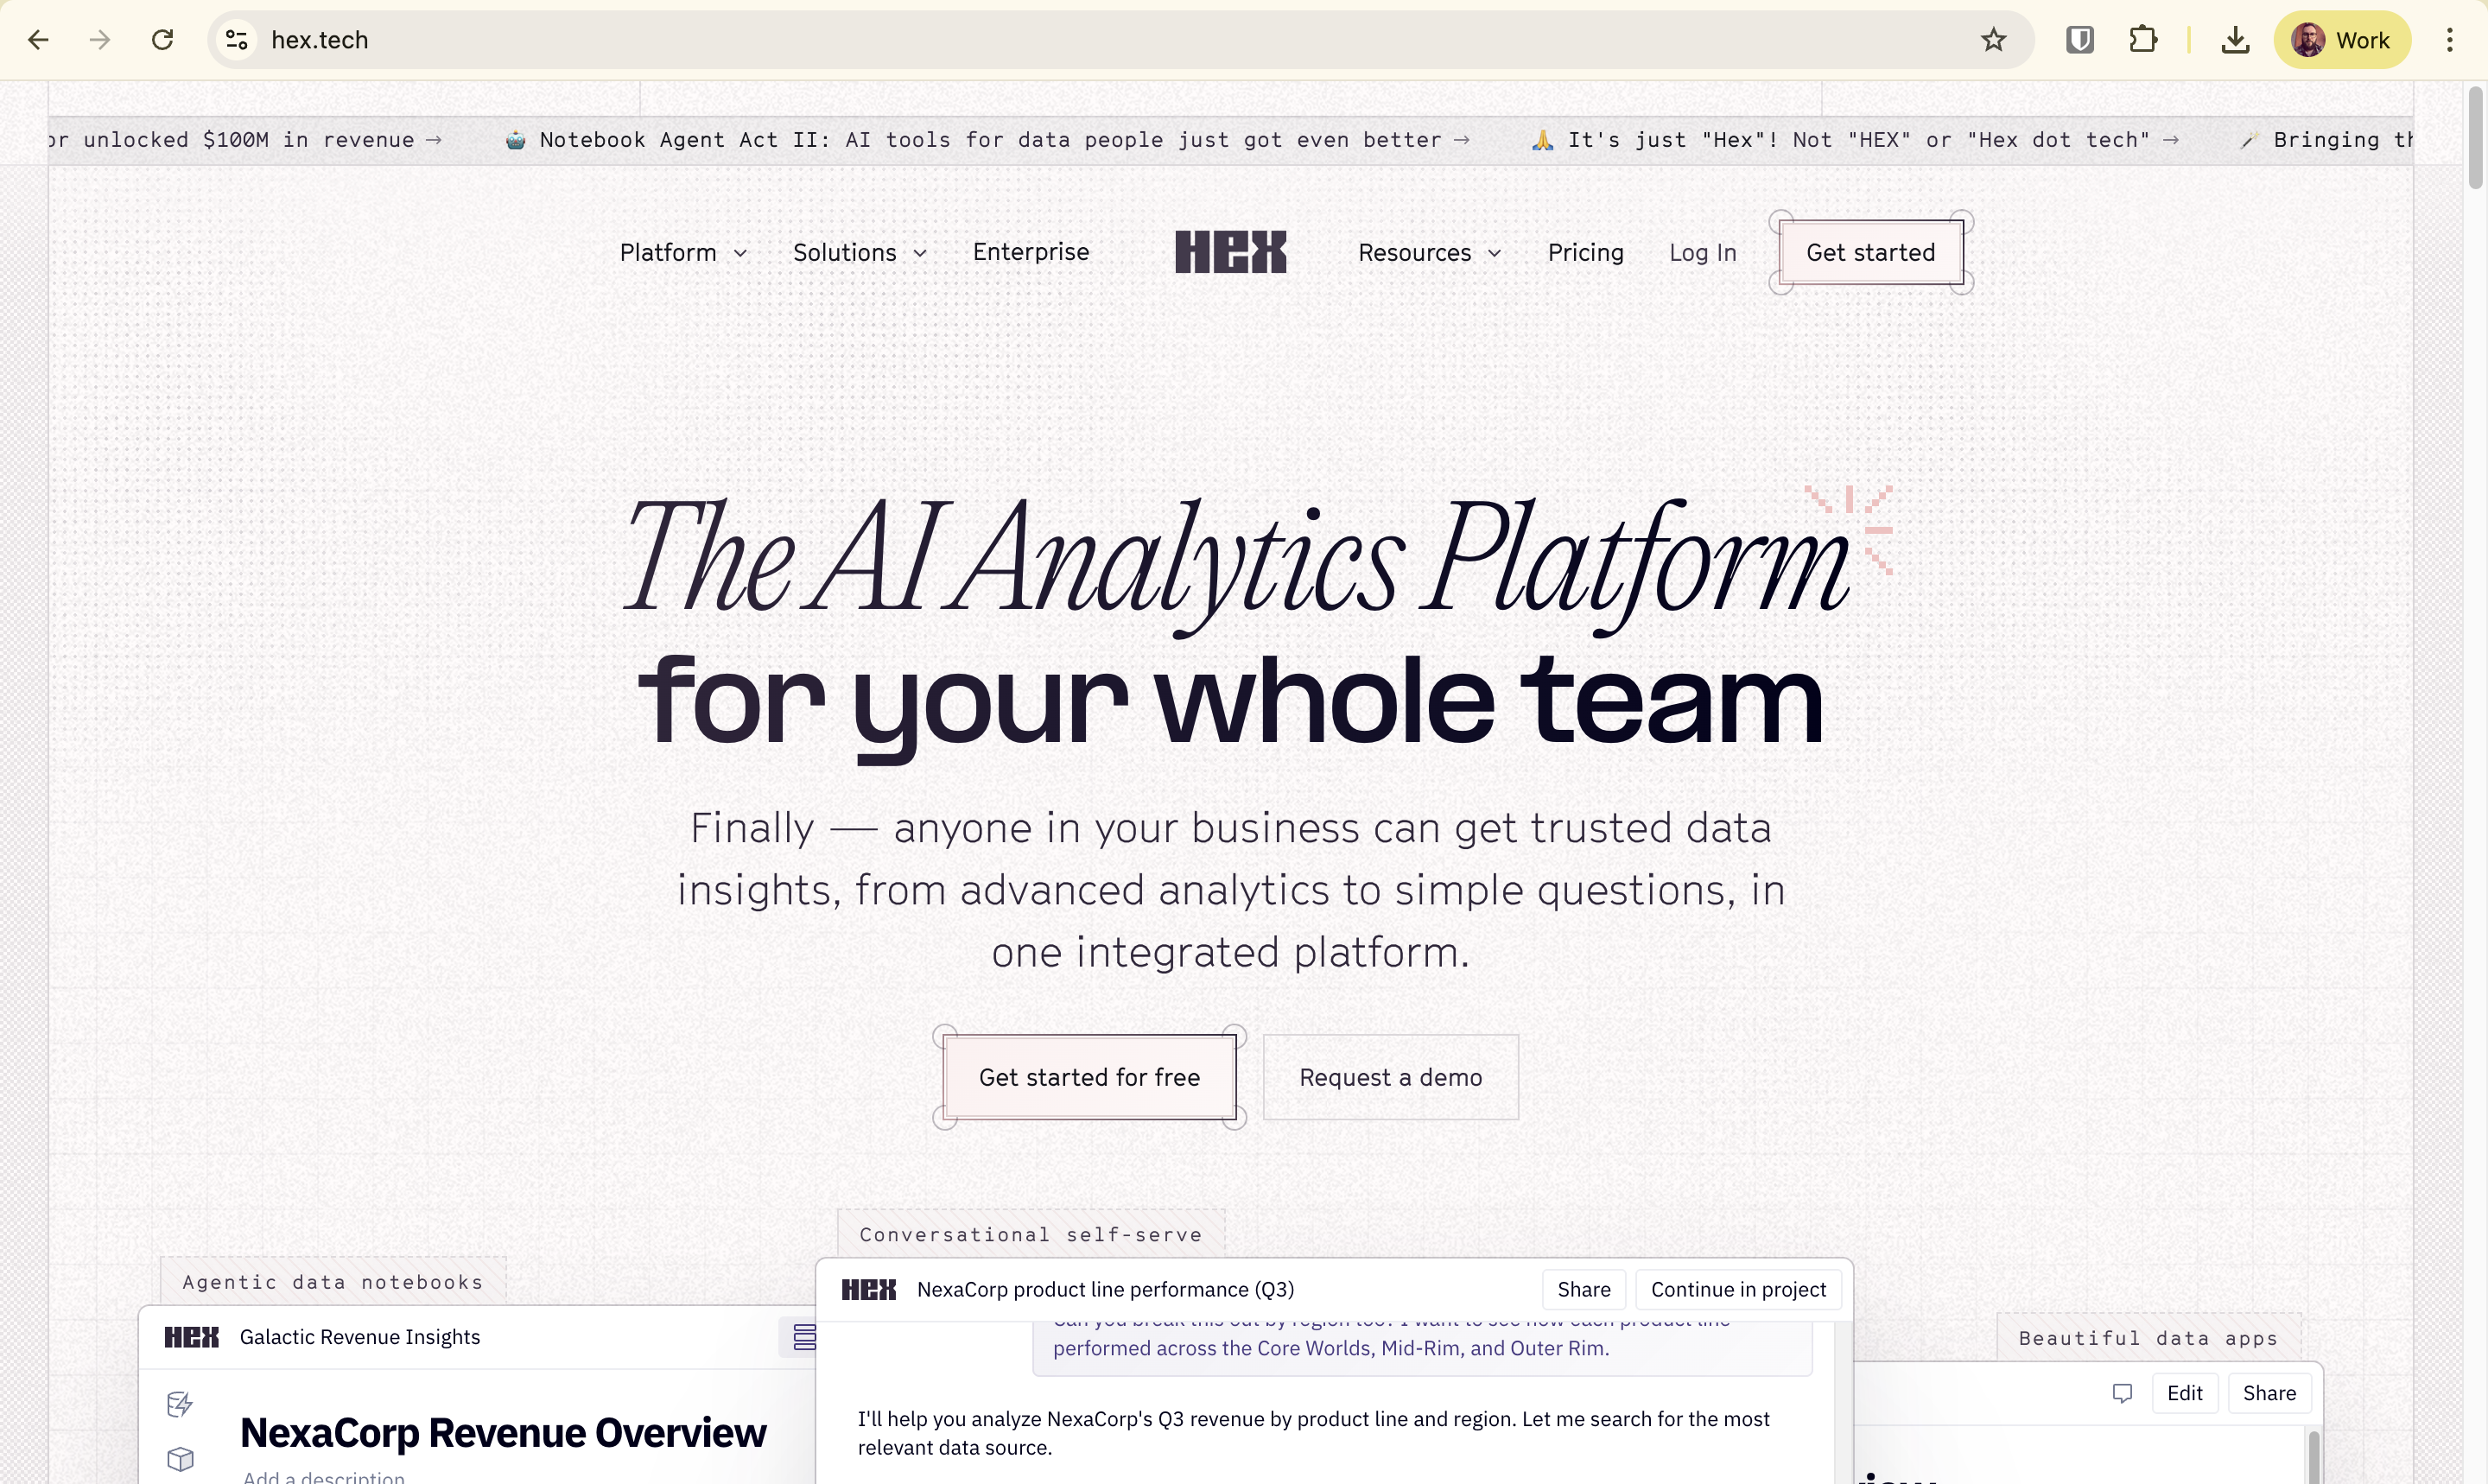
A notebook-first analytics platform that has grown app-like capabilities. Strong with Python-fluent analysts.
Where it fits: Analyst-driven exploratory data apps. Cases where a data scientist or analytics engineer wants to publish an interactive view of a notebook to stakeholders.
Pros
- Notebook-first — natural for Python-fluent analysts
- Strong collaboration model for data science teams
- Increasingly capable as an app builder, not just a notebook
- Warehouse-native query architecture
- Good for exploratory data products that don’t need polished operational UX
Cons
- More analyst tool than business-user operational platform
- Workflow and writeback capabilities are lighter than warehouse-native BI competitors
- App polish trails purpose-built operational analytics tools
- Less suited to non-analyst end users running the app daily
- Pricing model assumes analyst seats, less elegant for wide business-user rollout
The decision: when to use AI/BI, when to use a data app
You don’t have to pick one. Most enterprises running Databricks at scale end up using two tools for two different jobs.
The rubric is straightforward:
If your use case is conversational analytics on Databricks lakehouse data, AI/BI with Genie is the strongest answer. Native semantic awareness, no third-party tool.
If your use case is AI-native analytics tightly integrated with ML workflows — model inference inside the analytics layer, vector search, Mosaic AI — AI/BI plus the Databricks ML stack is purpose-built.
If your use case is internal operational data apps with writeback — forecasts, approvals, customer interventions, capacity adjustments, exception queues — you need either Astrato, Sigma, or Databricks Apps. Astrato fits best when the stack is multi-warehouse and the team needs no-code, polished operational UX. Sigma fits when analysts and spreadsheet thinkers are the builders. Databricks Apps fits when the team has engineering capacity and wants the app to live inside Databricks.
If your use case is multi-warehouse analytics — finance data in Snowflake, telemetry in Databricks, marketing in BigQuery, and you want a single layer over all of them — Astrato is the clearest fit. Sigma supports multi-warehouse but with stronger Snowflake heritage.
If your use case is general internal tools beyond analytics — admin panels, CRUD UIs, multi-system internal apps — Retool is the right call. Don’t ask a warehouse-native BI tool to do this job.
If your use case is analyst-driven exploratory data apps, Hex is purpose-built. Don’t try to make a business-user operational platform do what a notebook-app does well.
Most Databricks shops will end up with AI/BI for dashboards and conversational analytics, plus one of Astrato, Sigma, or Databricks Apps for the operational layer. That’s not a failure of consolidation. That’s two tools doing the two jobs each is best at.
The architectural foundation for either approach — semantic layer, governed writeback, live query — is the same as the pattern we covered in our data products reference architecture and the row-level security patterns for warehouse-native BI. Governance flows through. The data app inherits the warehouse’s posture rather than fragmenting it.
For more on the live-query architecture that makes operational data apps responsive enough to use day-to-day, the same warehouse-native foundation applies.
See what data apps on Databricks look like in practice
Astrato is the warehouse-native BI platform for guided self-service, embedded analytics, and operational data apps. Book a demo or start a free trial to see writeback, approval workflows, and live-query architecture working over your own Databricks data.
FAQ
Can Databricks AI/BI write data back to the lakehouse?
No. AI/BI dashboards are read-only by design. They display data from Unity Catalog tables but don’t accept input that writes to those tables. For writeback on Databricks-resident data, you’ll need either Databricks Apps (code-led, built on Streamlit or Dash) or a third-party platform like Astrato or Sigma that treats warehouse writeback as a first-class capability.
What’s the difference between Databricks AI/BI and Databricks Apps?
AI/BI is the dashboard and conversational analytics layer — read-only, optimized for showing data, with Genie for natural language queries. Databricks Apps is a newer code-led platform for building custom operational apps inside Databricks, using Python frameworks like Streamlit, Dash, Gradio, or Flask. AI/BI is for analysts and business users consuming dashboards; Databricks Apps is for engineering teams building bespoke operational tools.
When should I use a third-party tool instead of Databricks Apps?
Databricks Apps requires Python development. If you want a no-code platform where business users or analytics engineers can build and maintain data apps without writing code, a warehouse-native BI platform with data-app capabilities is a better fit. The choice usually comes down to engineering capacity: if you have it and want apps to live inside Databricks, use Databricks Apps; if you’d rather treat the operational layer as a platform you configure, use Astrato or Sigma.
Does Astrato replace Databricks?
No. Astrato sits above Databricks as the analytics and data-app layer. Databricks remains the lakehouse, the compute engine, the ML platform, and the governance substrate. Astrato connects to Databricks live (no extracts), uses Databricks compute for queries, and writes back through Databricks SQL when the use case requires it. Same relationship Astrato has with Snowflake, BigQuery, and the other warehouses it supports.
What about Tableau, Power BI, or Looker for operational data apps on Databricks?
These are dashboard-first tools. They have varying degrees of writeback capability — usually limited, often through extensions or custom development — but they weren’t architected for the data-app pattern. If your use case is genuinely read-only dashboarding, any of them can work alongside Databricks. If your use case includes writeback, approvals, or operational workflows, the warehouse-native data-app platforms (Astrato, Sigma) or Databricks Apps are better-suited to the shape of the problem.
Ready to experience next-gen analytics?
See how Astrato runs natively in your warehouse.