Best BI Tools for ClickHouse in 2026: Live-Query Architecture Comparison
Six BI platforms compared for ClickHouse — Astrato, Superset, Grafana, Metabase, Looker, Tableau. Live-query architecture, pushdown SQL, writeback, embedding.

You chose ClickHouse because it's fast. Sub-second queries on billions of rows. High concurrency on cheap hardware. Columnar storage built around MergeTree. None of that is accidental — it's why you're not on Postgres or BigQuery for this workload.
Now you need a BI tool in front of it, and most of the options were built for slower warehouses. They cache. They extract. They schedule refreshes overnight. They were architected assuming the underlying database needs help to feel responsive, and that assumption inverts everything about ClickHouse. Put the wrong BI tool in front of ClickHouse and you end up paying for speed you never let your users see.
This piece is about figuring out which BI tools actually fit ClickHouse architecturally — not which ones merely have a connector. Six platforms get serious treatment: Astrato, Apache Superset, Grafana, Metabase, Looker, and Tableau. Open-source gets fair weighting; commercial tools earn their place by what they do that Superset and Grafana don't. There's also a short note on Sigma, which announced ClickHouse support in beta with substantial limitations.
If you're a data platform lead picking a commercial alternative to your current Superset deployment, or a product engineering leader building customer-facing analytics on ClickHouse, this guide is for you.
TL;DR
- Grafana wins for pure observability dashboards.
- Apache Superset is the most mature open-source choice for internal analyst-led exploration on a budget
- Astrato is the strongest fit for customer-facing analytics, multi-tenant SaaS, writeback, and building no-code operational data apps on ClickHouse, plus it’s a warehouse-native tool.
- Looker fits enterprise teams already invested in LookML where ClickHouse is one of several warehouses.
- Metabase fits small teams adding their first commercial BI on ClickHouse without an enterprise budget.
- Tableau has a ClickHouse connector but its extract-first architecture works against you.
What “ClickHouse BI” actually means
There are two architectural patterns for putting BI on a data warehouse, and they're different enough that everything else flows from which one you pick.
Live-query architecture
The BI tool sends SQL to the warehouse at the moment a user opens a dashboard or changes a filter. The warehouse runs the query and returns the result. The BI tool renders it. Nothing is pre-computed or cached in a separate engine. Every user interaction hits the warehouse.
Extract-and-refresh architecture
The BI tool runs a scheduled query against the warehouse, pulls the result into its own engine (Hyper, an in-memory cube, a proprietary store), and serves dashboards from that copy. Users interact with the cached copy, not the warehouse. Refresh happens on a schedule — nightly, hourly, sometimes more often.
For most warehouses, both patterns make sense in different contexts. Snowflake and BigQuery often warm caches behind the BI tool's extracts. The difference between architectures matters less when the warehouse itself adds latency.
For ClickHouse, the calculation is different. ClickHouse was engineered to answer queries fast — sub-second on huge tables, sustained concurrency that traditional row-store databases can't match. If your BI tool extracts data overnight and serves it from a cache, you've paid for ClickHouse and given your users the experience of a 24-hour-stale snapshot. Whatever speed advantage ClickHouse provided is now invisible.
This is the core mismatch the rest of the article addresses. Live-query against ClickHouse exposes its speed. Extract-and-refresh hides it. Your BI tool decision determines which one your users see. The same principle drives the broader live-query argument in Real-Time Analytics on Snowflake — the warehouse you chose only matters if the BI layer above it preserves what makes it good.
There's a secondary consequence worth naming. Dashboards are read-only by definition — users consume what the warehouse computed. A data app is different: users act on data through it, and those actions update the warehouse. Forecasts get submitted. Records get approved. Exceptions get resolved. ClickHouse's recent maturity around inserts and ReplacingMergeTree means writeback is now feasible — but only on BI tools that support it. Most don't.
What ClickHouse buyers actually need from BI
The architectural mismatch above generates a specific evaluation framework. Six criteria, each rooted in something ClickHouse-specific. If your BI tool covers four of these well, you're fine. If it covers two, you've bought the wrong tool.
1. Live-query architecture
Does the tool query ClickHouse live, or extract and refresh on a schedule? This is the single most important question, and the one that separates ClickHouse-fit tools from ClickHouse-with-an-asterisk tools. Some platforms support both modes — what matters is whether live-query is the default and well-supported path, or a checkbox option whose performance the vendor hasn't optimized for.
2. SQL pushdown and ClickHouse-aware optimization
When a user filters a dashboard, does the tool push that filter down into the SQL it sends to ClickHouse, letting MergeTree's primary key skip irrelevant data parts? Or does it pull millions of rows back and filter client-side? Does the tool generate SQL that benefits from materialized views and projections, or does it generate naive queries that scan everything? Good pushdown can be the difference between a 100ms dashboard and a 30-second one on the same data.
3. Connection method
Three options exist for connecting to ClickHouse: the native protocol (port 9000, fastest, supports all ClickHouse types), the HTTP interface (port 8123 or 8443, broadest compatibility), and the PostgreSQL wire protocol (port 9005, limited but works with any PG-compatible client). Native protocol gets you the best performance and full type fidelity. JDBC and ODBC drivers fall back to HTTP. The PostgreSQL interface is convenient but loses ClickHouse-specific features like complex array operations and certain aggregate functions.
4. Multi-tenant capability for customer-facing SaaS
If you're building customer-facing analytics, you'll serve thousands of end-customers off one ClickHouse cluster. Can your BI tool isolate them properly — each tenant sees only their data, no cross-tenant leakage, governance enforced at the warehouse rather than reimplemented in the BI layer? Some tools handle this cleanly through row-level security passed through to ClickHouse. Others require you to provision a separate workspace per customer, which doesn't scale.
5. Writeback and operational workflows
Can users update data through the dashboard — submit a forecast, approve a record, flag an exception — and have that action write back to ClickHouse under governed SQL? This is the dashboard-to-data-app jump. Most BI tools don't make it. The ones that do let you build operational tools instead of just analytical views. ClickHouse's writeback story has matured (inserts are efficient, ReplacingMergeTree handles updates well enough for app patterns), but the BI tool has to support the pattern.
6. Embedding depth for customer-facing analytics
Beyond the iframe embed code, what's the customization surface? Custom domains, themes, fonts, CSS, branded exports, multi-tenant security per customer, an SDK for deeper integration into your product. Most BI tools embed somehow; few embed cleanly into a SaaS product where the end-customer never sees the BI vendor's name.
Few tools cover all six. The honest framing is that each of these criteria requires deliberate architectural intent the vendor either built or didn't. You can't bolt live-query onto an extract-first tool. You can't add per-tenant security as a feature. The platforms that cover the framework cover it because they were designed around it from the start.
The six platforms compared
Six platforms compete for the ClickHouse BI decision. Here's how they score across the criteria.
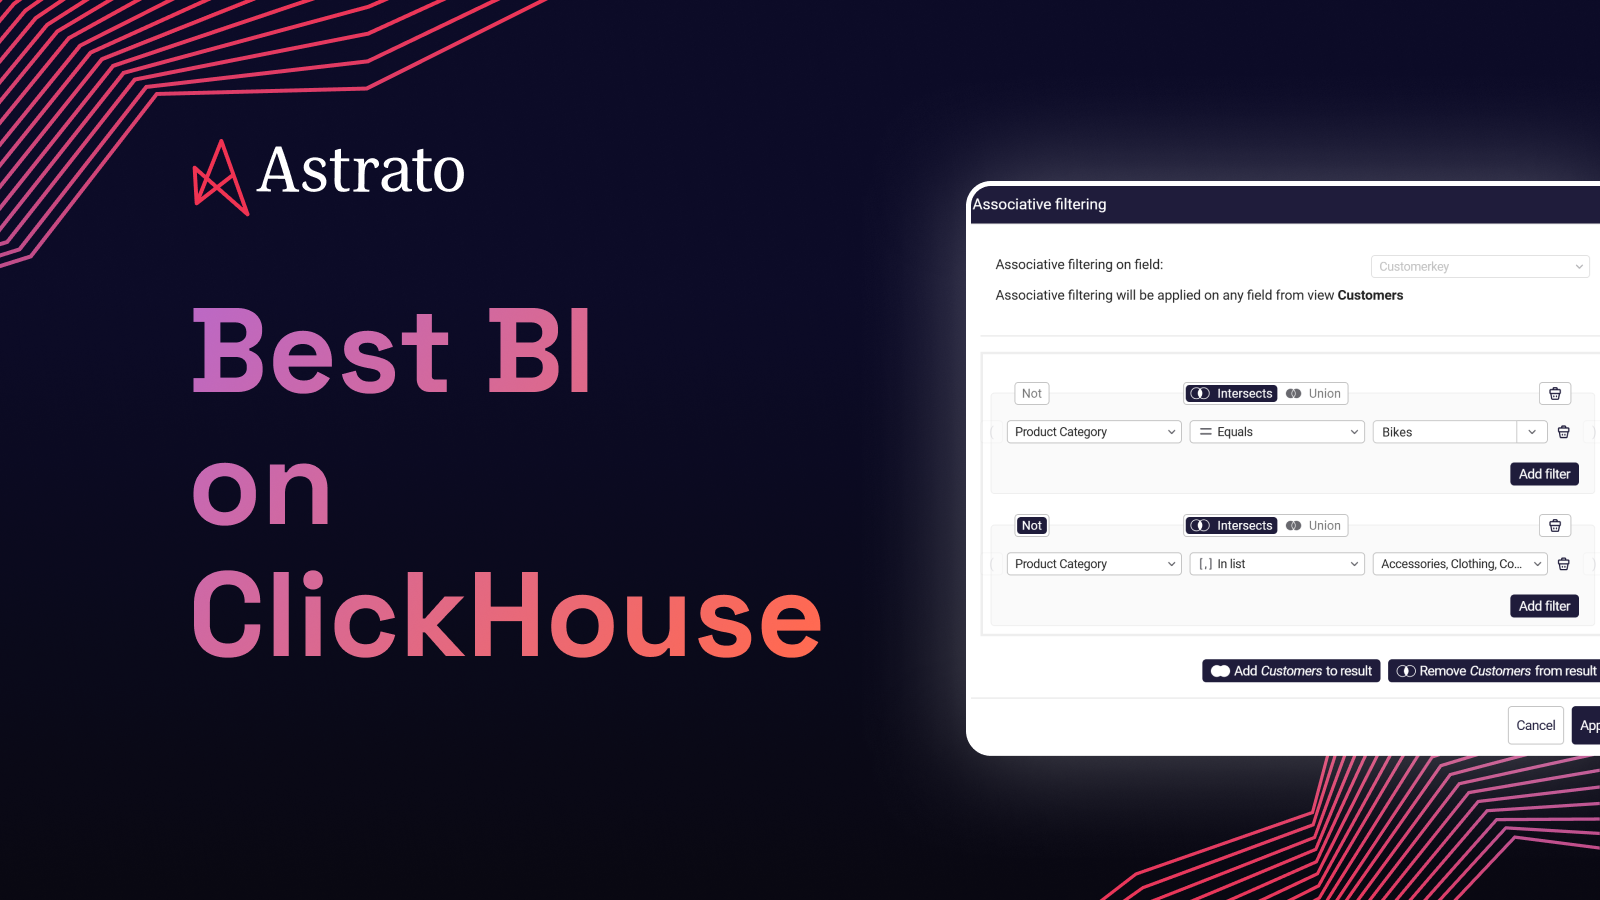
Astrato

Astrato is a warehouse-native BI platform. It connects directly to ClickHouse over the native protocol and runs every query live — no extracts, no scheduled refreshes, no interposed cache. ClickHouse's columnar engine handles the work; Astrato renders the result.
Astrato is listed in ClickHouse's official integrations documentation, which is meaningful third-party validation — ClickHouse vets the integrations it lists. The connector supports both ClickHouse Cloud and self-hosted deployments, plus the ClickHouse Playground for evaluation without infrastructure setup.
Writeback to ClickHouse is now supported, which moves Astrato beyond read-only dashboards into data app territory — forms, approvals, operational workflows that write to ClickHouse tables under governed SQL. Multi-warehouse from a single platform means teams running ClickHouse alongside Snowflake, BigQuery, or Databricks can use one analytics layer across all of them, which is the common reality in larger organizations where ClickHouse rarely runs alone.

Pixel-perfect white-label embedding handles the customer-facing case. Custom domains, themes, fonts, branded exports, and an SDK for deeper integration into a SaaS product.
Pros
- Native ClickHouse protocol connection, live-query by default — every dashboard interaction queries ClickHouse directly with no cache layer in between
- Listed in ClickHouse's official integrations documentation — not a self-claimed integration
- Writeback to ClickHouse supported — operational data apps work on ClickHouse, not just on Snowflake
- Multi-warehouse from one platform — ClickHouse plus Snowflake, BigQuery, Databricks, Redshift, PostgreSQL, and others through a single analytics layer
- Pixel-perfect white-label embedded analytics — customer-facing SaaS deployments where end-users never see the BI vendor's name
Cons
- Commercial — Superset and self-hosted Grafana have real cost advantages for teams that can absorb the operational overhead
- Not optimized for observability-style time-series at the depth Grafana offers — if you're plotting node CPU over time, Grafana is the better tool
Apache Superset
Superset is the most mature open-source BI tool for ClickHouse. Built originally at Airbnb, donated to Apache, and used in production by data teams at companies running ClickHouse for analyst-led work. The ClickHouse community knows Superset well; the Superset community knows ClickHouse well. That mutual familiarity matters.
Connection is via the SQLAlchemy ClickHouse driver, which uses the HTTP interface. Live-query is the default mode. Pushdown is reasonable for filtered queries; complex transformations can fall back to client-side processing. Multi-tenant isolation requires substantial DIY setup — Superset has row-level security, but you wire it up against your ClickHouse user model.
Where Superset earns its place: free, mature, technically competent, and trusted by the ClickHouse community. Where it doesn't: customer-facing analytics, polished embedding, writeback, and operational data apps. Superset was built as an internal analyst tool, and it shows when you try to use it as anything else.
Pros
- Most mature open-source ClickHouse integration — used in production by ClickHouse-running data teams for years
- Free under Apache 2.0 — no licensing cost, real for teams with engineering bandwidth to operate it
- Live-query against ClickHouse by default, with pushdown that's reasonable for filtered analytical queries
- Strong SQL Lab for ad-hoc exploration — analysts comfortable with SQL can move fast
- Active community and contributor base — issues get triaged, features get added
Cons
- No writeback — Superset is read-only by design; you can't build operational data apps on it
- Embedding for customer-facing SaaS is limited — basic iframe embedding works, but white-labeling and SDK depth are weak
- Multi-tenant governance is DIY — you'll implement and maintain it yourself against ClickHouse
- Operational overhead is real — you host it, upgrade it, secure it, scale it
- No commercial support contract from the project itself — third-party vendors offer it, but you're stitching together your support story
Grafana
For observability and time-series analytics on ClickHouse, Grafana is the answer and nothing else comes close. The ClickHouse data source plugin is well-maintained, integrates with ClickHouse's time-series functions (toStartOfInterval, toRelativeMinuteNum), and supports both query inspection and template variables. Teams running ClickHouse as a logs or metrics store overwhelmingly pair it with Grafana.
Grafana is also useful beyond pure observability — operational dashboards, status pages, single-pane-of-glass views over multiple data sources. But for general-purpose BI — narrative dashboards for finance, marketing analytics, multi-step exploration by non-technical users — it's the wrong shape. Grafana was built around the time-series model, and that model is visible in everything it does.
Pros
- Best-in-class ClickHouse support for time-series and observability use cases — the ClickHouse plugin is mature and actively maintained
- Live-query by default with intelligent pushdown for time-bucket aggregations
- Free self-hosted option, with Grafana Cloud as a commercial alternative
- Massive community for observability use cases — Grafana dashboards are the lingua franca of SRE
- Multi-source dashboards — ClickHouse alongside Prometheus, Loki, Tempo, and others natively
Cons
- Not designed as a general-purpose BI tool — narrative dashboards, finance reporting, marketing analytics don't fit the time-series model
- No writeback — Grafana is observability and visualization, not operational workflows
- Weak self-service for non-technical users — dashboard editing assumes you know SQL and the data source
- Embedding for customer-facing SaaS is limited — Grafana Cloud has options, but pixel-perfect white-labeling isn't a strength
- Visualization library is observability-shaped — time-series charts excel, business visualizations are weaker
Metabase
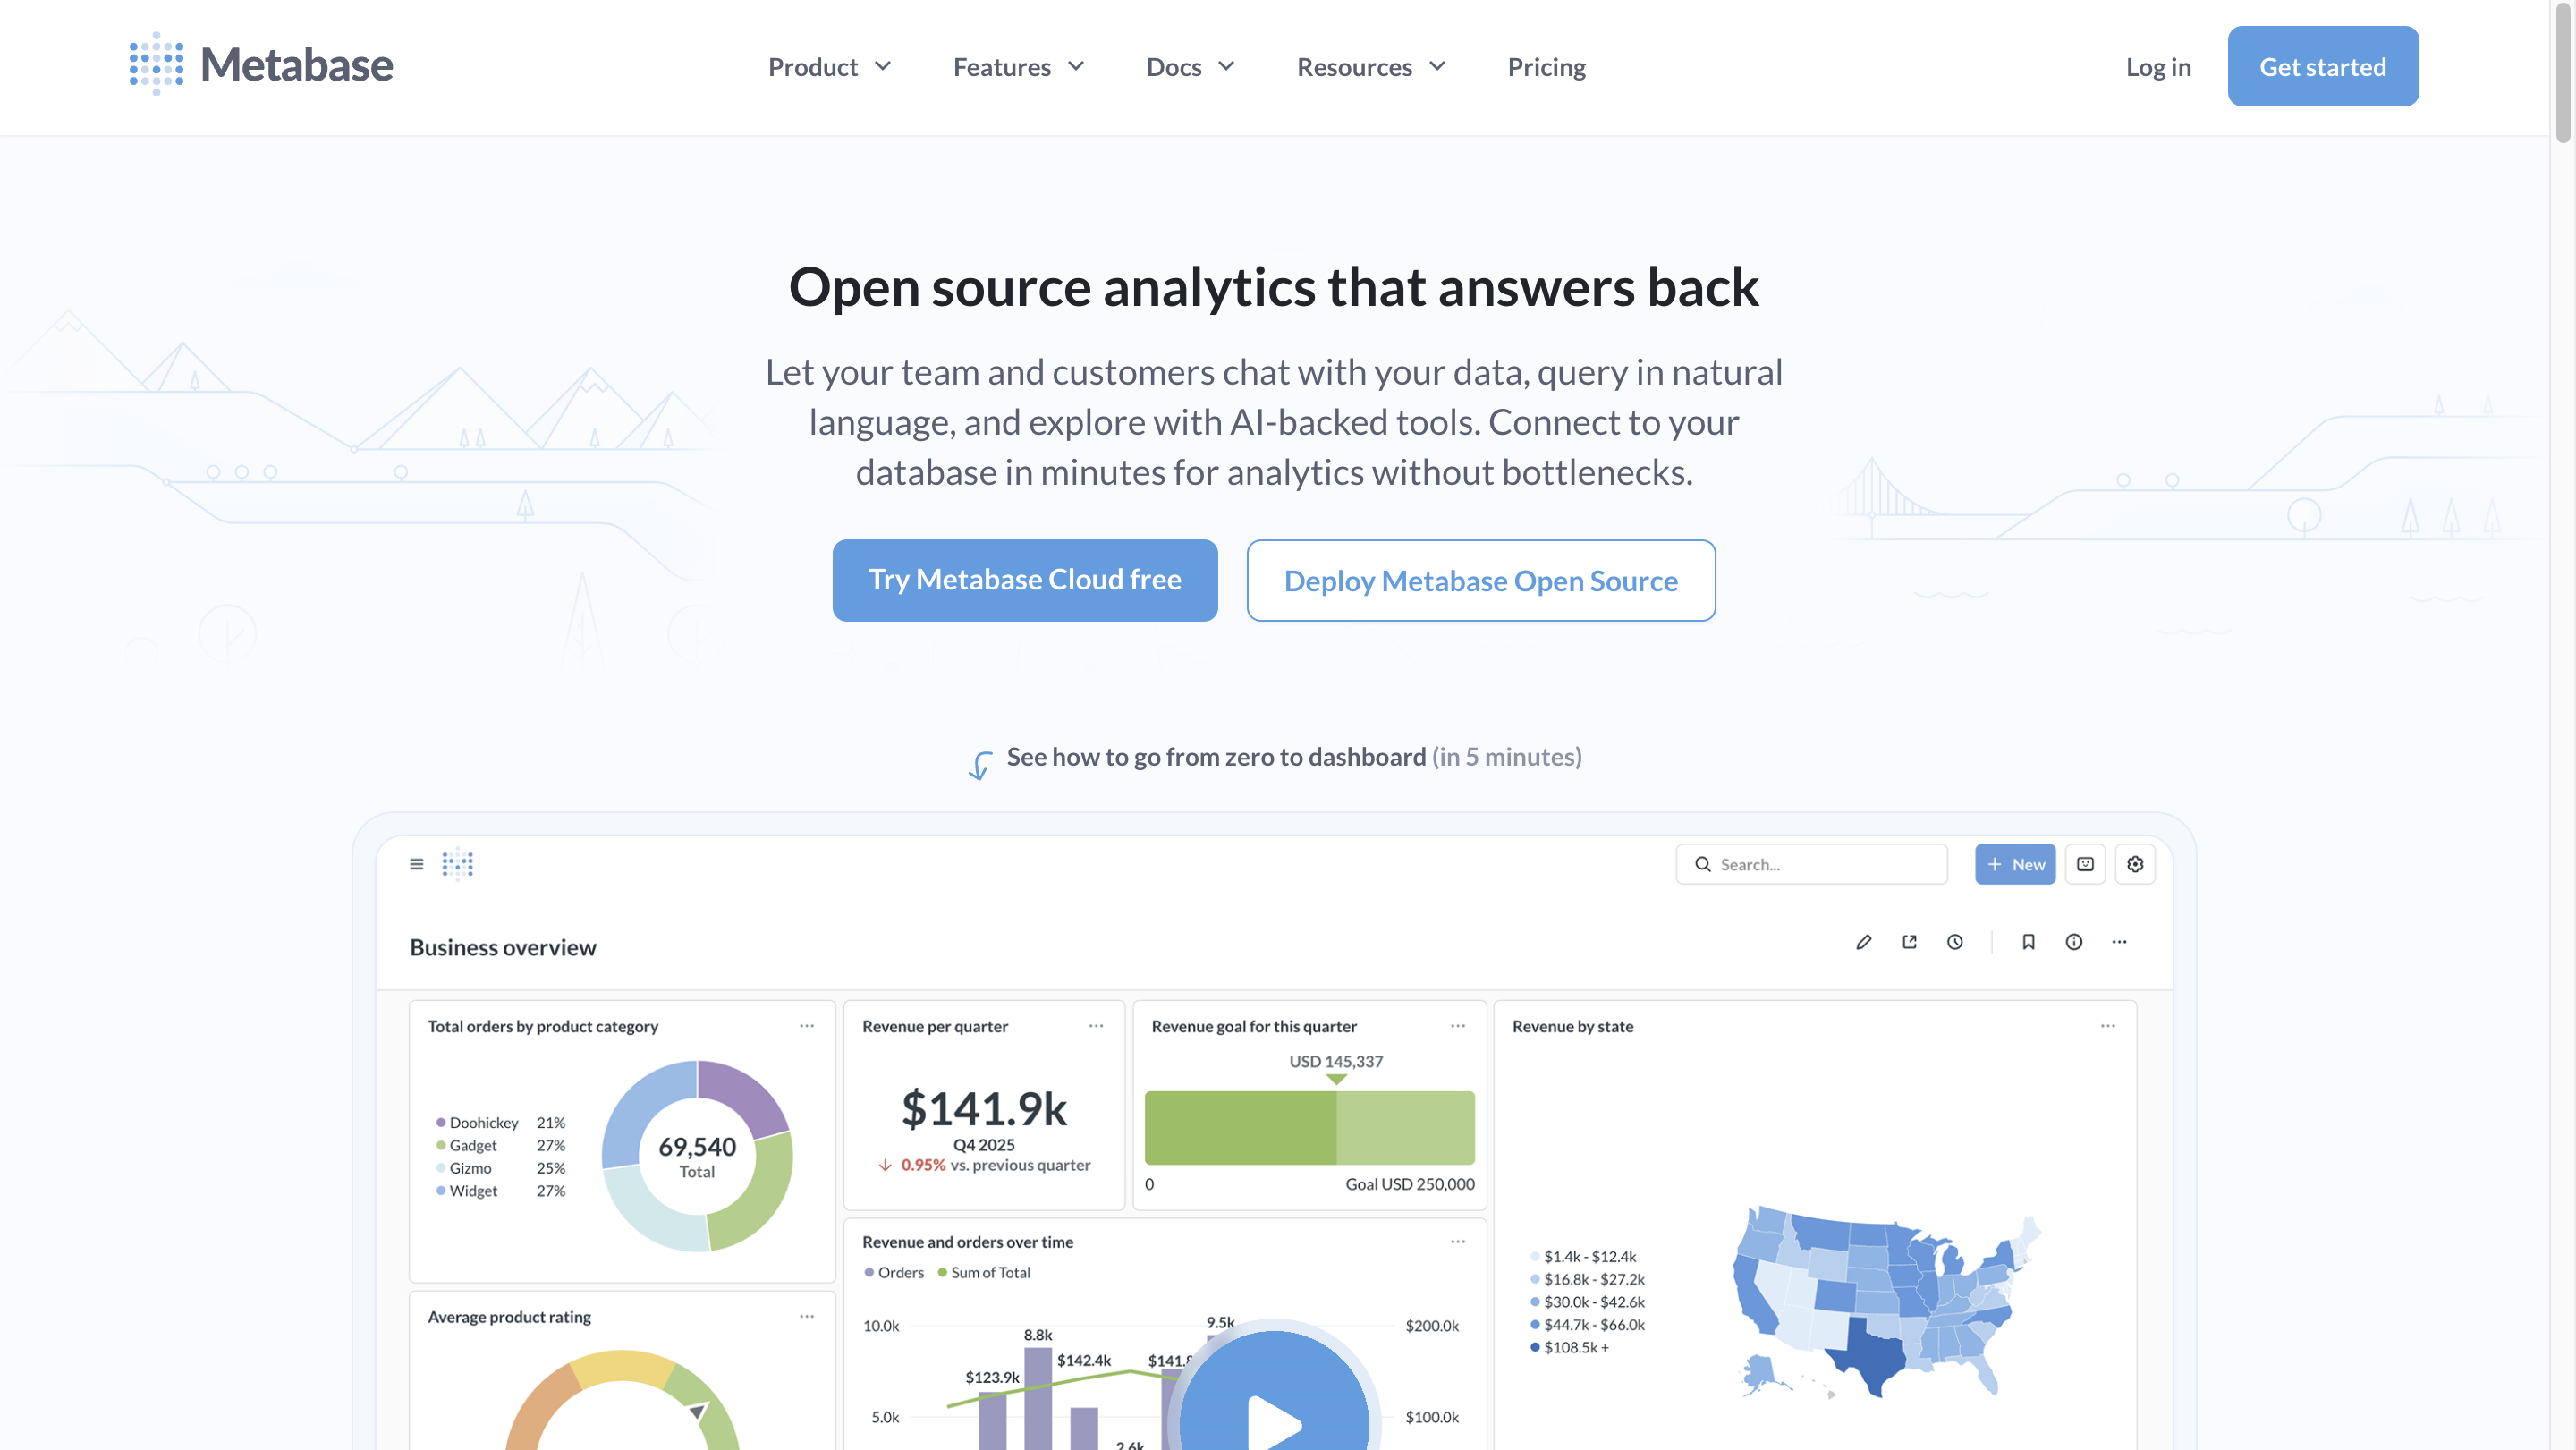
Metabase is the lightweight commercial entry — open-source core, hosted cloud starting around $85/month, and a native ClickHouse driver that ClickHouse maintains. It's the tool early-stage SaaS teams reach for when they need something more polished than Superset but don't want to pay enterprise BI prices.
The Metabase ClickHouse driver handles common cases well. Live-query is the default. Pushdown is competent for the kinds of queries Metabase generates. The interface is friendly to non-technical users in a way Superset isn't. Question-building feels approachable.
Limitations show up at scale and in customer-facing scenarios. Semantic layer is basic. Writeback isn't a feature. Embedding works but customization is shallow. Governance is functional but not enterprise-grade. If you're a five-person startup adding internal dashboards on your ClickHouse instance, Metabase is a reasonable choice. If you're building a multi-tenant customer-facing analytics product, you'll outgrow it.
Pros
- Native ClickHouse driver maintained by ClickHouse, live-query with reasonable pushdown
- Approachable for non-technical users — question-builder UI lowers the SQL bar
- Open-source core with a paid cloud option — gentle commercial entry compared to Tableau or Looker
- Active development, frequent releases, good documentation
- Basic embedding works for internal use cases and lightweight SaaS scenarios
Cons
- No writeback — read-only by design, no operational workflows
- Weak semantic layer — metric definitions don't centralize the way they do in Looker or Astrato
- Embedding customization is shallow — white-labeling at the product level is limited
- Multi-tenant governance is basic — fine for small deployments, friction at scale
- Visualization library is narrower than Tableau's or Astrato's
Looker
Looker has a ClickHouse connector and Google's brand behind it. LookML provides a semantic modeling layer that's genuinely useful for teams investing in metric governance. If you're a Google Cloud shop already running BigQuery alongside ClickHouse, Looker can pull both into one analytics layer through LookML models.
Live-query is the default behavior, though Looker can also use persistent derived tables (PDTs) — materializations written back to your warehouse on a schedule. On ClickHouse, the PDT pattern works but you're effectively asking ClickHouse to manage another set of materialized tables, which can get awkward alongside your own materialized views.
Where Looker fits ClickHouse: enterprise teams with significant LookML investment, multi-warehouse environments where BigQuery is primary and ClickHouse is one of several sources, and organizations where governed metric definitions matter more than embedded analytics polish. Where it doesn't fit as cleanly: pure ClickHouse-native deployments where the team doesn't already use LookML, customer-facing analytics with serious branding requirements, and operational data app patterns.
Pros
- LookML provides a strong semantic layer — governed metric definitions across teams
- Live-query default mode, with the option to materialize through PDTs
- Multi-warehouse support including ClickHouse alongside BigQuery, Snowflake, Redshift, and others
- Enterprise governance, access controls, and audit logging
- Google Cloud integration for shops already standardized there
Cons
- LookML is a heavy investment — productive teams have a dedicated analytics engineering function, smaller teams find it overwhelming
- ClickHouse is less common in Looker's enterprise customer base — fewer ClickHouse-specific patterns documented
- Embedded analytics requires Looker Embed, which adds licensing and architectural complexity
- No writeback — read-only by design
- Pricing scales steeply for embedded and customer-facing deployments
Tableau
Tableau has a ClickHouse connector — actually two, one maintained by ClickHouse via JDBC and another by Altinity supporting both ODBC and JDBC. The JDBC connector has a 97-98% TDVT compatibility score, which is high. You can connect Tableau to ClickHouse and it works.
The issue isn't whether the connector works. It's that Tableau's architecture and culture default to extracts. Tableau Hyper is engineered to make slower warehouses feel fast — it pulls data into a local engine and serves dashboards from there. On ClickHouse, this inverts the value proposition. You're paying for ClickHouse's speed and then bypassing it by extracting into Hyper. You can configure Tableau to use live connections instead — and many guides for ClickHouse + Tableau recommend exactly that — but the moment a workbook gets complex, Tableau's performance heuristics push you back toward extracts. Calculated fields, blends, complex filters: all of them perform better on Hyper than on a live ClickHouse query, even when that live query would be plenty fast.
For shops where Tableau is already deeply deployed and ClickHouse is being added as one of several data sources, the connector is a reasonable bridge. For green-field BI selection on ClickHouse, Tableau's architectural assumptions work against you.
Pros
- Mature ClickHouse connector with strong TDVT compatibility — most Tableau features work
- Strong visualization library — among the broadest in the BI category
- Massive enterprise install base, well-known to BI consulting firms
- Live mode is supported — you can configure Tableau to query ClickHouse directly
- Useful when Tableau is already deployed and ClickHouse is being added as a source
Cons
- Extract-first culture undermines ClickHouse's speed advantage — complex workbooks push you toward Hyper extracts even when live would work
- Embedded customization is limited — pixel-perfect white-labeling is harder than in tools built for embedding
- Pricing scales steeply for embedded use cases — per-viewer and per-creator licensing adds up
- No writeback to ClickHouse — Tableau is read-only for the warehouse
- ClickHouse is a less-common Tableau pairing in practice — fewer community-maintained patterns, less ecosystem support
Choosing by use case
The framework is one lens. The other lens is what you're building. Use case maps to platform more directly than capability checkboxes do.
- Observability and time-series monitoring on ClickHouse → Grafana. Nothing else is competitive here. ClickHouse plus Grafana is the canonical observability pattern.
- Internal analyst-led exploratory dashboards on a budget → Apache Superset. Free, mature, trusted by the ClickHouse community, capable for SQL-comfortable analysts. Operational overhead is real, but for many teams it's worth it.
- Lightweight commercial BI for small teams → Metabase. Friendly UI, native ClickHouse driver, gentle pricing. Caps out before customer-facing or enterprise multi-tenant.
- Enterprise-incumbent BI with ClickHouse as one source → Looker, if you already have LookML investment. Tableau, with the architectural caveats about extracts. Neither is purpose-built for ClickHouse.
- Customer-facing analytics, multi-tenant SaaS, writeback, operational data apps → Astrato. Live-query against ClickHouse, pixel-perfect embedding, writeback supported, multi-warehouse from one platform. The strongest fit on the criteria framework for this use case.
Most ClickHouse deployments don't end up using just one BI tool. Observability runs on Grafana because nothing else is as good at it. Internal analyst exploration runs on Superset because it's free and mature. Customer-facing analytics or operational data apps run on a commercial tool that handles embedding and writeback. The question isn't “what's the one BI tool for ClickHouse” — it's “what's the right tool for this use case on ClickHouse, given the other tools we already run.”
How live-query architecture actually maps to ClickHouse
Worth being concrete about what's happening underneath. Two architectural paths sit between a user action and the data.
Live-query path. User opens dashboard → BI tool generates SQL → SQL hits ClickHouse over the native protocol or HTTP interface → ClickHouse uses MergeTree primary keys and materialized views to skip irrelevant data → result returns to BI tool → dashboard renders. Three components, one network round-trip, current data. This is what Astrato, Superset, Grafana, Metabase, and Looker do by default.
Extract path. Scheduled job runs SQL against ClickHouse → result lands in BI tool's local engine (Hyper for Tableau, cubes for legacy BI) → user opens dashboard → BI tool queries its own engine → dashboard renders from cached copy. Four components, two layers of state to manage, data staleness equal to your refresh interval. This is what Tableau defaults to once workbooks get complex.
Two things to take from those paths. First, the live-query path is shorter — fewer components between user action and ClickHouse query. Less to maintain, less to debug, less to keep refreshed. Second, the extract path treats ClickHouse as a source of nightly data dumps, which is the opposite of what ClickHouse is engineered for. ClickHouse wants to be queried. Extract-and-refresh BI tools want to be insulated from the source. The tension is structural.
A note on Sigma
Sigma announced ClickHouse support in private beta. Worth flagging for completeness, but not yet a peer comparator. Per Sigma's beta documentation, ClickHouse connections currently don't support: OAuth and SAML authentication, private link connections, SSH connections, input tables and writeback (no CSV uploads, no Python), stored procedures, warehouse views, export to cloud storage, the result cache, user attributes for role and warehouse switching, sample connections, non-UTF-8 strings, and all Geography, Array, and System functions. Plus a handful of Aggregate and Date functions.
That's a lot of substantial features missing. For a team currently evaluating Sigma + ClickHouse seriously, the beta is worth watching. For the decision today, the gaps are too wide for production deployment, particularly if writeback, SSO, or private networking are non-negotiable.
What this means for your decision
If you're running ClickHouse and choosing BI:
The single highest-value decision is whether your BI tool queries ClickHouse live or extracts data and serves stale snapshots. Most of the other criteria collapse out of that one. Live-query, pushdown SQL, ClickHouse-aware optimization — these are the architectural baseline. Without them, ClickHouse's speed never reaches the end-user.
For pure open-source on a budget, Superset and Grafana cover internal analyst exploration and observability respectively. They're the right answers in their slots, and the article would lose credibility pretending otherwise. For commercial customer-facing analytics with embedding, writeback, and multi-warehouse support, Astrato is the strongest fit on the criteria framework. Looker and Metabase fit specific situations. Tableau's connector works but its architectural assumptions don't.
If you're evaluating Astrato specifically: the ClickHouse Playground integration lets you build a real dashboard on real ClickHouse data without setting up infrastructure first. The 14-day trial gives you enough time to test live-query performance against your own queries, evaluate embedded analytics against your product, and decide whether the data-app patterns matter to your roadmap. Start there if you want to see the architecture in action rather than read about it.
FAQ
What's the difference between live-query BI and extract-based BI on ClickHouse?
Live-query BI sends SQL directly to ClickHouse every time a user interacts with a dashboard — every filter change, every drill-down. Extract-based BI runs a scheduled query, copies the result into its own engine, and serves dashboards from the cached copy. Live-query exposes ClickHouse's speed; extract-based BI hides it behind a refresh schedule. For ClickHouse specifically, live-query is almost always the right architecture, because ClickHouse was engineered to answer queries fast and that speed is the reason you chose it.
Is Apache Superset still the best free option for ClickHouse?
For internal analyst-led dashboards on ClickHouse, yes. Superset has the most mature open-source ClickHouse integration, an active community, and trust within the ClickHouse user base. It's free under Apache 2.0, runs live-query against ClickHouse by default, and handles ad-hoc exploration well. Where it stops being the right answer is customer-facing analytics with serious embedding requirements, writeback and operational workflows, and managed-service simplicity. For those, you're looking at commercial tools.
Can I use Tableau with ClickHouse?
Yes — Tableau has an official ClickHouse connector with 97-98% TDVT compatibility. The technical connection works. The architectural question is whether Tableau's extract-first culture squanders the reason you chose ClickHouse. Live connections are supported and recommended for ClickHouse, but Tableau's performance heuristics push complex workbooks toward Hyper extracts. If Tableau is already deployed in your shop and you're adding ClickHouse as a source, the connector is a reasonable bridge. If you're choosing BI fresh, the architectural mismatch is real.
Does Astrato support writeback to ClickHouse?
Yes. Writeback to ClickHouse is supported in Astrato, which means dashboards can become data apps — users submit forecasts, approve records, flag exceptions, and those actions write to ClickHouse tables under governed SQL. This moves Astrato beyond read-only dashboards into operational workflows on ClickHouse, which most BI tools (including Superset, Grafana, Metabase, Looker, Tableau, and Sigma's current ClickHouse beta) don't support.
What's the best BI tool for customer-facing analytics on ClickHouse?
For customer-facing analytics — multi-tenant SaaS, white-labeled embedded dashboards, branded exports, per-customer governance — you're looking at a commercial tool that was built for embedding. Astrato is the strongest fit across the six evaluation criteria for this use case: live-query against ClickHouse, pushdown SQL, multi-tenant capability, pixel-perfect embedding, custom domains, an SDK for deep product integration. Superset and Grafana don't have the embedding maturity. Metabase embedding is shallow. Tableau and Looker have embedded products but their pricing and architectural assumptions favor enterprise internal use over SaaS customer-facing.
Ready to experience next-gen analytics?
See how Astrato runs natively in your warehouse.