Astrato vs Tableau: Which BI Platform To Choose in 2026?
Still on Tableau extracts while your data lives in Snowflake or Databricks? See how Astrato's warehouse-native architecture compares on self-service, embedding, writeback.

Business intelligence is at a crossroads. Most data teams have already moved to cloud data warehouses — Snowflake, Databricks, BigQuery. That's the modern cloud infrastructure they run on. But a surprising number of teams are still using business intelligence tools built for a different era.
Tools that extract data, cache it in a proprietary format, and run dashboards off a copy — and treat data analytics as a reporting exercise rather than a live operational capability.
Tools where non technical users still need to route requests to analysts. Tools that weren't designed for embedded analytics, writeback, or the kind of self service BI that business teams actually need in 2026.
Astrato vs Tableau is one of the most common comparisons data teams make when they're evaluating whether to modernize their stack. This article covers both platforms honestly — architecture, data visualization, self service analytics, embedded analytics, writeback, pricing, and where each tool is genuinely the better fit.
TL;DR
Astrato is likely the better fit if:
- Your data lives in Snowflake, Databricks, BigQuery, or another modern cloud warehouse and you want a BI layer that lives natively there too
- Non technical users need to analyze data and share insights without analyst support and self service BI needs to scale without governance breaking
- You're building a SaaS product and need embedded analytics that feel native to the user interface instead of being sandboxed inside a third-party tool
- You need row-level security and governance that stays in the warehouse instead of being duplicated in a separate BI layer
- You want analytics to become operational and enable teams to approve, update, and log decisions inside dashboards with writeback to the warehouse
Tableau is likely the better fit if:
- Your team has a large investment in certified Tableau analysts, existing Tableau workbooks, and built workflows around Tableau Desktop
- You're embedded in the Salesforce ecosystem and want native CRM data integration as a core part of your analytics
- Your primary use case is polished, complex data visualization for board-level presentations and you need all the features of a mature chart library
- You need on-premises deployment for strict compliance reasons and have IT resources to support Tableau Server
- Your data sources include many legacy on-premises databases, flat files, Google Sheets, or Excel, and you need a broad connector ecosystem to access all of them
Quick comparison: Astrato vs Tableau
|
Capability |
Tableau |
Astrato |
|
Architecture |
Extract-based by default. Live Connection available but slower at heavy load |
✓ Warehouse-native, 100% live query — no extracts, no data copies |
|
Data freshness |
Dependent on extract refresh schedule. Live mode requires manual view refresh for absolute latest data |
✓ Always current — dashboards reflect the latest warehouse state at query time |
|
Row-level security |
Configured separately in the BI layer — governance duplicated outside the source |
✓ Inherited from warehouse — defined once, enforced everywhere |
|
Self-service BI |
Intuitive at basic level; advanced features require trained analysts or IT support |
✓ Semantic layer + no-code builder — non-technical users explore without SQL |
|
Data visualization |
Best-in-class chart range; highly customizable; strong for polished presentation dashboards |
✓ 70+ chart types, geospatial, interactive dashboards, pixel-perfect embedded layouts |
|
AI / natural language |
Tableau Pulse & Agent require Salesforce or Tableau+ tier to reach full functionality |
✓ Included — grounded in semantic layer for consistent, accurate answers |
|
Embedded analytics |
Sandboxed; limited UI customisation; per-impression pricing at scale; multi-tenancy requires workarounds |
✓ Built-in by default — single iframe, white-label, multi-tenant, usage-based pricing |
|
Writeback |
Read-only by default. Writeback via dashboard extensions with added security overhead |
✓ Native — update records, submit decisions, persist changes to warehouse instantly |
|
Data apps |
Not a primary design goal — dashboards are primarily view-only outputs |
✓ Build low-code operational workflows and data apps on live warehouse data |
|
Data preparation |
Tableau Prep — separate product, Creator licence only; Explorers and Viewers excluded |
✓ Integrated — works natively with dbt and warehouse-layer prep; no separate tool needed |
|
Pricing model |
Creator licence mandatory per deployment; add-ons, impression fees, and training costs stack quickly |
✓ Usage-based and per-user options — no mandatory licence floor, no impression overages |
|
Salesforce dependency |
AI features and login increasingly tied to Salesforce licences — friction for non-SF orgs |
✓ None — works with any data stack, no Salesforce account required |
|
Data connectivity |
Broad connector ecosystem including legacy on-premises databases, flat files, Excel, and Google Sheets |
✓ Native to Snowflake, BigQuery, Databricks, Redshift, PostgreSQL, ClickHouse, Supabase |
What is Astrato?
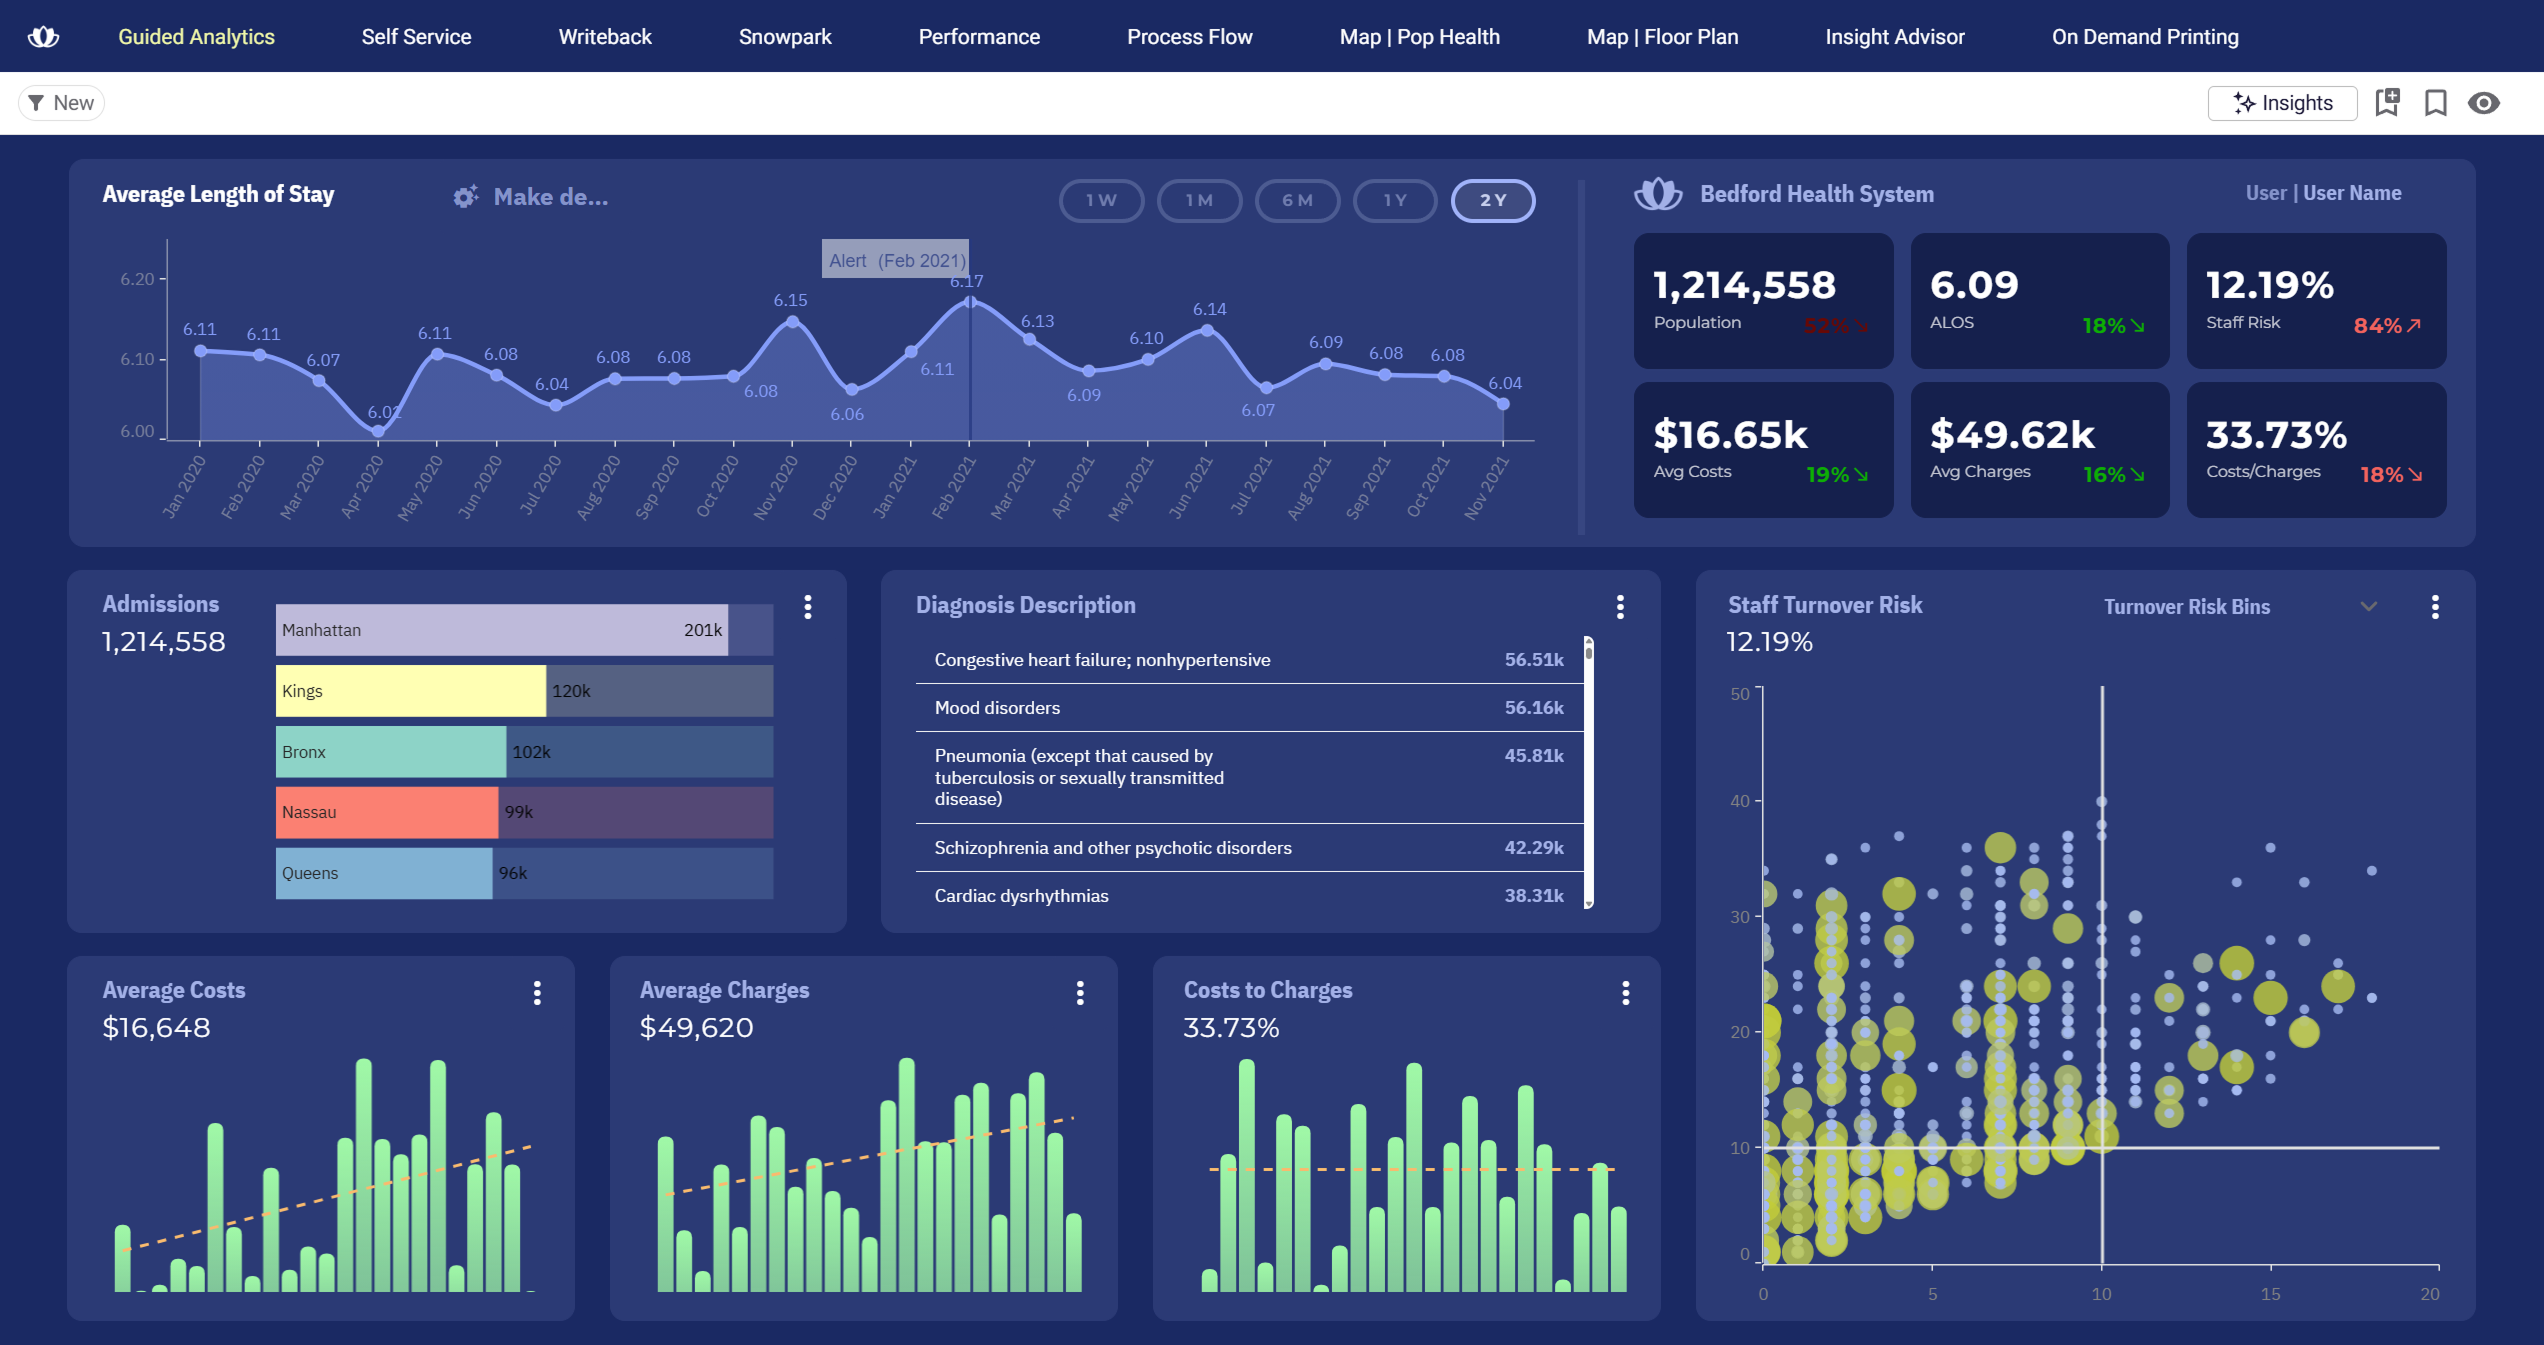
Astrato is a warehouse-native business intelligence platform. It's built for teams who've moved to Snowflake, Databricks, BigQuery, Amazon Redshift, PostgreSQL, ClickHouse, or Supabase and need a BI layer that works natively with that architecture.
Astrato runs analytics directly on the warehouse. There are no extracts, no data copies, no staged layers between your data and your dashboards. Data connectivity is live — every query goes to the source, and row-level security is inherited directly from the warehouse.
The platform is built around three primary use cases: guided self-service BI for internal teams who want to analyze data without depending on analysts, customer-facing embedded analytics for SaaS and data products, and operational data apps with native writeback.
Astrato is the platform for teams that have modernized their data stack and want a BI layer built for it — not retrofitted to it.

What is Tableau?
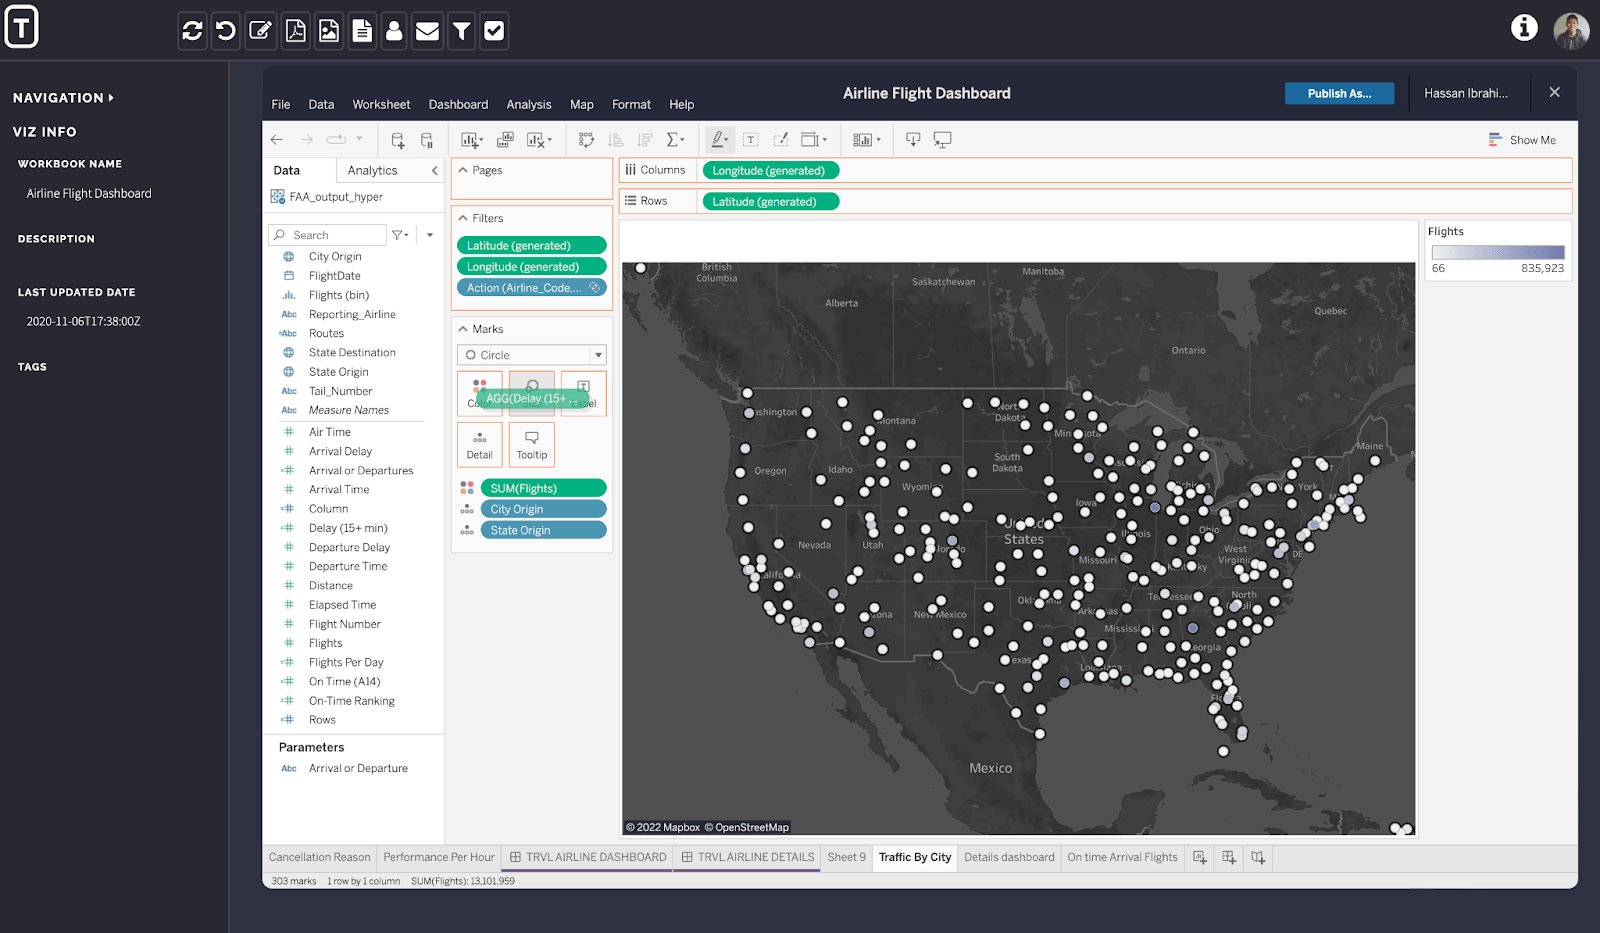
Tableau is one of the most recognized names in business intelligence. Founded in 2003 and acquired by Salesforce in 2019, it's used by over 115,000 organizations globally. Its core strength is data visualization — a drag-and-drop user interface that lets analysts build sophisticated, interactive dashboards across a wide range of chart types and data sources.
Tableau's product portfolio includes Tableau Desktop (installed client for authoring), Tableau Cloud (hosted SaaS), Tableau Server (self-hosted), and Tableau Next (an emerging agentic analytics tier). It connects to a broad range of multiple data sources including legacy on-premises databases, flat files like Excel and Google Sheets, and modern cloud warehouses.
Tableau's default data execution model relies on Hyper extracts — copies of data loaded into an in-memory format for fast querying. A live connection mode exists but many teams default to extracts for performance and stability at scale. Since the Salesforce acquisition, Tableau's roadmap for new features has become increasingly integrated with Salesforce infrastructure — which benefits Salesforce customers but creates friction for teams outside that ecosystem.
It's worth acknowledging what Tableau does well. Its data visualization capabilities are genuinely best-in-class. The breadth of chart types, formatting options, and the ability to create polished, presentation-ready dashboards is one of the reasons Tableau built such a large following among data scientists and BI professionals. Adoption has historically been strong in organisations with large analyst communities who built their workflows around Tableau Desktop.
Architecture: live query vs extract-based BI
Architecture is the most fundamental difference between these two platforms which shapes everything downstream: data freshness, governance, performance, and the total cost of maintaining the stack.
How Tableau handles data execution
Tableau's default mode copies data from multiple sources into its own Hyper format on a schedule. This extract-based approach works well for many reporting use cases — Hyper is fast for querying pre-cached datasets, and Tableau Prep gives data teams tools to clean and reshape data before it lands in the extract.
Live Connection mode is available and queries the warehouse directly. But at heavy load and with complex data, many teams find it slower than extract mode. In practice, most organisations end up managing a mix — extracts for performance, live connections where freshness matters. The problem is that maintaining both creates overhead.
The deeper issue is governance. When business logic lives in both the warehouse and the Tableau layer, definitions drift. Two analysts build dashboards that seem to answer the same question but return different numbers. The data team ends up spending time explaining the discrepancy instead of building new features.
Tableau Prep is Tableau's answer to data preparation — but it's a separate product, included only with the Creator licence, and unavailable to Explorer and Viewer users. Teams that need data preparation capabilities across user roles end up with a fragmented workflow.
How Astrato handles data execution
Astrato runs every query directly against the data warehouse using pushdown SQL. There are no extracts, no refresh schedules, no cached copies. For teams on Snowflake Databricks BigQuery or Redshift, when data changes, dashboards reflect it immediately at query time. This is what warehouse-native actually means — the data lives in the warehouse, and that's where analytics happens.
This matters most when data freshness is a real requirement. Operational dashboards, customer-facing analytics, and any decision making context where a stale number creates a real problem benefit directly from Astrato's live-query architecture. But the simplification goes further: no extract pipeline to build or maintain, no staging layer, no data preparation overhead for the BI layer itself.
Row-level security and governance stay in the warehouse, defined once and enforced everywhere — across internal dashboards, embedded analytics, and AI queries. When a permission changes in Snowflake, it takes effect across all of Astrato automatically. There's no separate governance layer to keep in sync.
Because Astrato pushes computation down to the warehouse, performance on complex data and large datasets scales with your warehouse compute — which Snowflake, BigQuery, and Databricks were purpose-built to handle.
“Our customers are already thrilled by the improvement in user experience we have seen from switching to Astrato, which is enabling their non-technical users to self-serve for the insights they need to make informed decisions and be far more productive. This is helping us win and retain more customers.”
Chief Operating Officer & EVP, Product
Semantic layer and data modelling
In traditional BI, business logic lives in dashboards. Each workbook defines its own metric calculations, filters, and data modeling. When teams work across multiple dashboards, definitions drift. 'Revenue' in the sales team's dashboard doesn't match 'revenue' in finance. Everyone asks the same question and gets different answers.
Astrato's semantic layer solves this at the source. Metrics are defined once centrally, and reused across every dashboard, every user, and every AI query. Business logic is consistent by design — not by coordination. When a definition changes, it changes everywhere, without touching individual workbooks.
This approach also enables version control over metric definitions — changes are tracked at the semantic layer level, not scattered across individual dashboard files. For analytics engineering teams running dbt and managing governance in the warehouse, Astrato's semantic layer fits naturally into that workflow.
Self-service BI: who can actually use it?
Both platforms market self-service BI. The difference is in who can realistically achieve it — and how much analyst support is needed to get there.
Tableau's self-service — only for power users or data teams
Tableau's drag-and-drop user interface is approachable for basic use. Allowing users to build a bar chart from an existing data source is genuinely accessible. The steep learning curve begins when users need to go beyond pre-built content.
Calculated fields, Level of Detail expressions, table calculations, and data blending require a meaningful investment in learning — and often formal training. G2 reviewers cite the steep learning curve as the top complaint with 282 verified mentions. Capterra reviewers note that non technical users in marketing, operations, and sales regularly hit a wall and route requests back to the data team. That's not self-service BI. That's IT dependency in a different form.
Tableau's AI features — Tableau Pulse and Tableau Agent — are designed to help non technical users get answers through natural language queries without needing SQL. But these features require the Salesforce or Tableau+ tier, and full functionality depends on Salesforce Data Cloud infrastructure. For teams outside the Salesforce ecosystem, the ability to access these features is significantly limited in practice.
Astrato's self-service — ready for business users
Astrato's self-service is built on a different foundation. The semantic layer means business users explore data using governed business metrics — not raw table columns and SQL syntax they don't know. A marketing analyst exploring campaign performance doesn't need to understand the underlying data modeling or join logic. The metric is already defined and trusted.
The no-code dashboard builder provides an intuitive drag-and-drop interface that non-technical users can use to build dashboards, analyze data, and share insights without raising a ticket. This is genuine self service BI — not a simplified viewer sitting on top of analyst-built content.
AI-powered querying is grounded in the semantic layer, so natural language queries return answers consistent with business logic, not column-name guesses. Ask 'what was our best-performing product last quarter?' and you get the answer your semantic layer defines — not a hallucination based on raw database column names.
Adoption of self-service analytics typically rises when the tool doesn't require technical expertise to access. When non-technical users can explore data independently, the BI team's backlog drops and data teams can focus on higher-value work.
“Our customers are already thrilled by the improvement in user experience we have seen from switching to Astrato, which is enabling their non-technical users to self-serve for the insights they need to make informed decisions and be far more productive. This is helping us win and retain more customers.”
Chief Operating Officer & EVP, Product
Data visualization: charts, dashboards, and design
Data visualization is where Tableau has historically built its reputation. It's worth being direct about this: Tableau's range of chart types, formatting controls, and ability to create polished, pixel-perfect dashboards is genuinely impressive. If your primary use case is building presentation-ready charts for board decks, Tableau's data visualization capabilities are among the best available.
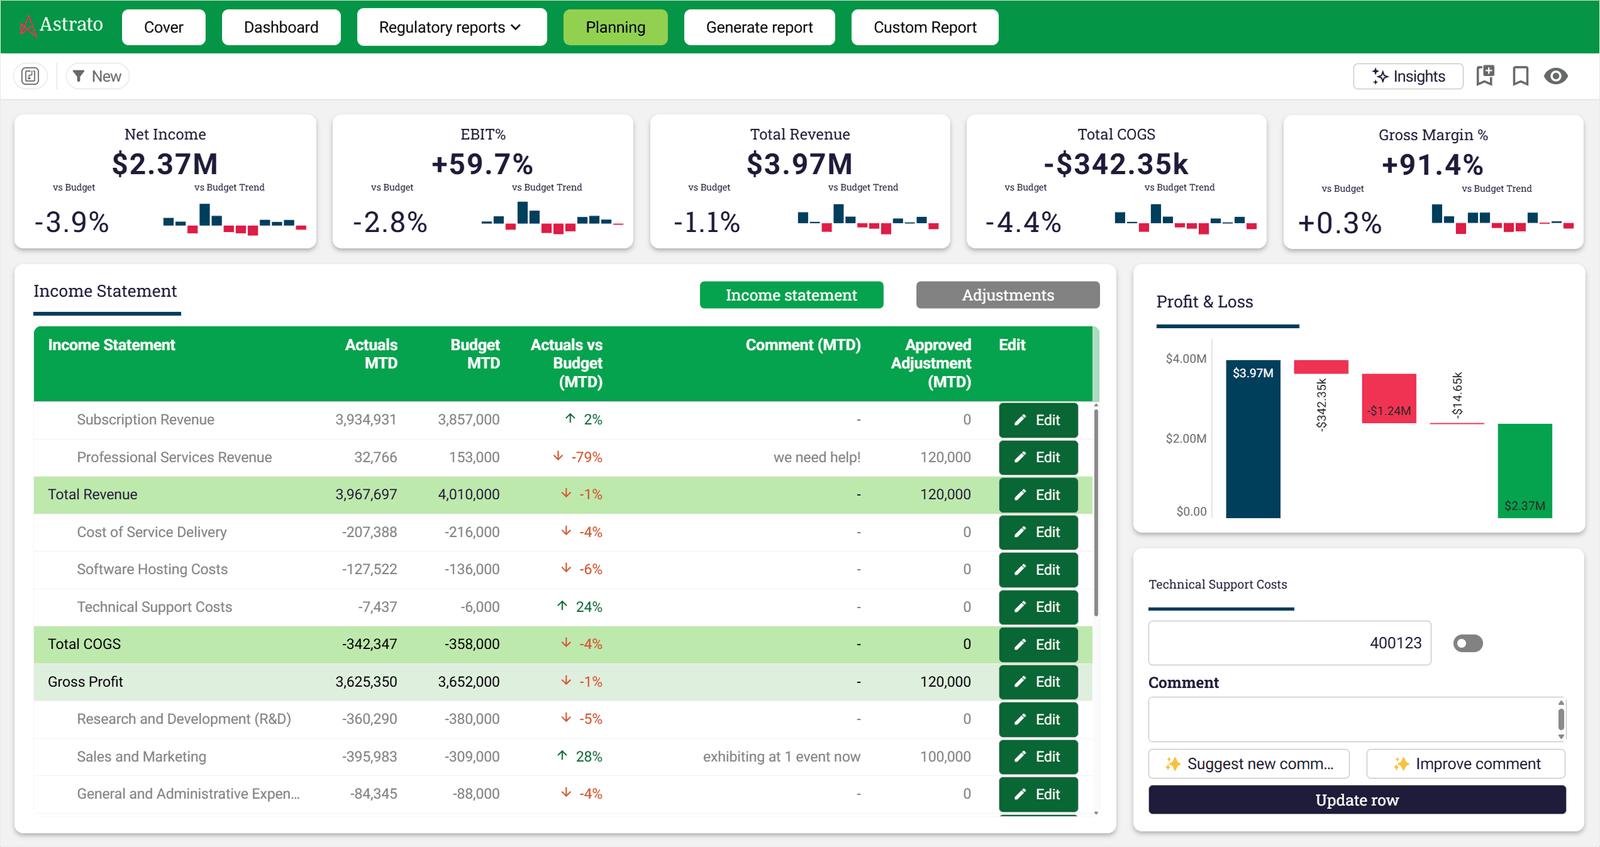
Astrato offers 70+ chart types, interactive dashboards with drill-downs and dynamic filters, geospatial analysis, and scheduled reporting that automatically exports branded reports in PDF, Excel, or PowerPoint. The design philosophy is more product-oriented — Astrato's dashboards are built to live inside applications, portals, and products, not just standalone BI environments.
- In Tableau, dashboards are primarily read-only outputs.
- In Astrato, a dashboard can also accept inputs, trigger workflows, and write changes back to the warehouse — turning charts into operational tools rather than static reports.
For teams that need dashboarding and data visualization embedded into a product or operational workflow, Astrato's approach allows users to build dashboards that feel native to their product environment — fully branded, fully interactive, and connected to live warehouse data.
Embedded analytics: building vs bolting on
If you're a SaaS company or building a data product, the embedded analytics question is probably the most important one on this list. The two platforms approach it very differently — and the difference shows up quickly when you try to ship.
Tableau's embedded approach
Tableau has embedding capabilities. Developers can embed dashboards using the JavaScript API or iframe. White-labelling is possible but requires significant development effort — Tableau's layout elements, toolbar, and navigation are difficult to fully remove or restyle. The result often feels like a Tableau dashboard inside a product rather than analytics that feel native to the user interface.
Pricing for customer-facing applications uses viewer licences and per-impression fees above an included threshold. With 100 clients and 3 users each, viewer licences alone cost $540 per client per year. For high-traffic applications with sporadic usage patterns, costs become difficult to forecast. Multi-tenancy — isolating one customer's data from another — requires complex workarounds that are hard to manage at scale.
Astrato's embedded approach
Embedded analytics is a core design goal for Astrato — not an add-on. The entire embedded analytics layer is built for this from the ground up, enabling seamless integration into SaaS products, customer portals, and internal tools.
You embed with a single iframe. White-labelling is the default — fonts, colours, layouts, and components are fully customisable with zero Astrato branding. The multi-tenant architecture isolates customer data natively. JWT-based SSO and row level security are inherited from the warehouse, so there's no separate permission layer to configure for each tenant.
Pricing is usage-based, not per-viewer. You're not paying for each customer who opens a dashboard. This makes the economics of customer-facing analytics predictable as the user base grows — which is the model that allows organisations to turn analytics into a revenue stream rather than a cost centre.
“The ease of implementation and integration to our Snowflake platform allowed us to go from design to a fully operational SaaS platform within 60 days.”
Co-Founder & CEO, Impensa
The customer-facing analytics capability is what SaaS teams use when they want analytics to feel like a native part of how users interact with the product — not a separate page that nobody uses.
Writeback: from dashboards to action
Most BI tools stop at the chart. Data comes in, gets visualized, and that's the end of the workflow. Decisions still happen in spreadsheets, emails, and Slack threads — disconnected from the data that informed them.
Tableau's writeback situation
Tableau is primarily read-only by design. Writeback is possible through dashboard extensions, but these add security and compliance overhead and require third-party integrations or custom development. It's not a native capability and wasn't part of Tableau's original design intent. For teams wanting to close the loop between insight and action inside one platform, this creates a real gap.
Astrato's writeback capability
Astrato's writeback is native. Users can update records, submit inputs, adjust forecasts, approve budgets, and log decisions directly from dashboards — and those changes persist immediately to the warehouse with full audit trails. No APIs. No plugins. No workarounds.
This turns analytics into operational infrastructure. A sales manager updates a pipeline estimate. A finance team approves a budget line. An operations team flags an anomaly and assigns ownership. All of it happens inside the dashboard, writes to the warehouse, and is traceable.
Data apps: the layer beyond dashboards
Dashboards help teams understand what happened. Data apps let them act on it without switching tools.
Astrato's BI Workflows capability lets teams build low-code operational applications on warehouse data.
This is the concept of an operational data app: not a dashboard with a button, but a live interface where business users interact with data and drive change.
Tableau was not designed for this. Its design philosophy centres on visual exploration and reporting. For teams whose analytical needs stop at dashboards and data analysis, that's a reasonable fit. For teams who want analytics to become part of how the business operates, Tableau's read-only architecture creates friction at every step.
AI-powered analytics: grounded vs gated
Both platforms have invested in AI capabilities. The difference is in how they're grounded, who can access them, and whether they work without additional infrastructure.
Tableau's AI features
Tableau Pulse delivers proactive metric summaries and trend narratives for non technical users. Tableau Agent brings conversational AI to the analytics experience. Einstein Discovery provides predictive modelling capabilities. These are genuinely capable features and represent real investment in AI-powered analytics.
The catch is access. Full capability requires the Salesforce or Tableau+ tier. Einstein Discovery depends on Salesforce CRM Analytics. Tableau Pulse at full functionality requires Salesforce Data Cloud integration. For teams not already deeply in the Salesforce ecosystem, accessing all the features requires additional infrastructure investment that may not be part of the original budget.
Astrato's AI approach
Astrato's GenAI is grounded in the semantic layer from the start. When a user asks a question in natural language, the AI uses governed metric definitions to generate the query. The answer is consistent with business logic because it's built on the same semantic foundation as every other dashboard in the platform.
Astrato supports native LLM integration with Snowflake Cortex (Meta, Claude, DeepSeek, Mistral models), Google Gemini for BigQuery, OpenAI, or bring your own LLM, allowing teams to use the models that already exist in their data cloud environment. Data never needs to leave the warehouse to power AI features.
There is no Salesforce dependency. No separate tier. No premium capacity requirement. The AI works because the semantic layer gives it business context — and that context is available to all users by default.
Pricing: what you actually pay
Tableau's pricing structure
Tableau's pricing is tiered by user role. Training costs $1,200–$2,000 per official Tableau course and is not included in the standard tier. For embedded analytics, per-impression fees apply above the included threshold, which makes Tableau far from the cheapest option for customer-facing applications at scale.
A 150-person deployment with Tableau can reach a six-figure number annually before infrastructure. That's before embedded analytics, which adds per-impression pricing on top. Tableau is not designed to be cost-competitive for teams building customer-facing analytics at scale — it was designed as an enterprise internal BI platform, and its pricing reflects that.
Astrato's pricing model
Astrato offers usage-based and per-user pricing models that scale with actual usage — not with how many people view a dashboard. There is no mandatory Creator floor. There are no per-impression overages for embedded analytics. Pricing is transparent and designed to scale with the use case.
Customers who switch from legacy BI tools — including Tableau, Qlik, and Power BI — consistently report 50–75% cost savings. The economics are particularly compelling for teams building customer-facing analytics, where Tableau's viewer-licence-per-customer model becomes unsustainable as the user base grows.
Data preparation and integration
Getting data into a usable state is one of the most time-consuming parts of any analytics workflow. How each platform handles data preparation says a lot about its underlying philosophy.
Tableau Prep is Tableau's dedicated data preparation tool. It offers a visual interface for cleaning, reshaping, and combining data from multiple data sources before it reaches dashboards — filling a similar role to Power Query in the Microsoft ecosystem, but gated behind the Creator licence. The limitation is structural: Tableau Prep is only available with the Creator licence. Explorers and Viewers cannot access it, which creates a gap in teams with multiple sources and mixed user roles.
Astrato approaches data preparation differently. Because Astrato queries live from the warehouse, data preparation typically happens upstream in the data stack — in dbt, in SQL, or in the warehouse itself. Astrato's semantic layer then exposes cleaned, governed metrics to all users without requiring a separate preparation tool. For teams already running a modern data stack with dbt and analytics engineering workflows, this fits naturally.
“Astrato acts as the shop window for everything happening in Snowflake, while all computation and governance remain in code within our data warehouse. That means anyone can access insights without relying on complex BI tools.”
Head of Data Products
Final verdict: Astrato vs Tableau
Tableau and Astrato serve different architectural visions of what business intelligence should be in the modern cloud era.
Tableau was built when on-premises databases were the norm. It has evolved significantly — adding live connections, semantic concepts, AI features, and Tableau Next. For teams with large analyst communities, complex legacy data connectivity needs, deep Salesforce integration, or a requirement for on-premises deployment, Tableau still delivers real value. Its data visualization capabilities remain best-in-class.
Astrato was built for the cloud warehouse era. It starts with the assumption that your data already lives in Snowflake, Databricks, or BigQuery — and builds the entire analytics layer on that foundation without moving data, without extract pipelines, and without replicating governance outside the source.
Astrato stands out for teams that want self service BI, embedded analytics, writeback, and AI to all run on one platform, on the same warehouse-native foundation.
If you're asking which platform fits a modern cloud data team that has already moved to a cloud warehouse and needs BI that works with that architecture, Astrato is purpose-built for exactly that transition. The implementation path is faster, the pricing is more predictable, and the architecture eliminates the extract-based overhead that makes traditional BI increasingly difficult to justify.
FAQ
Is Astrato a direct Tableau alternative?
Yes, for most BI use cases. Astrato covers self-service BI, data visualization, embedded analytics, AI-powered natural language queries, scheduled reporting, and writeback. The key architectural difference is that Astrato runs live queries on your warehouse — there are no extracts or data copies. For teams on modern cloud warehouses, Astrato is designed as a like-for-like replacement with a warehouse-native foundation. Tableau has a broader connector ecosystem and stronger support for legacy data sources and on-premises deployments.
Does Astrato work with the same data sources as Tableau?
Astrato connects natively to Snowflake, BigQuery, Databricks, Amazon Redshift, PostgreSQL, ClickHouse, Supabase, and Dremio — covering all major cloud warehouses and analytical databases. Tableau connects to a broader range of multiple sources including legacy on-premises databases, flat files, Excel, Google Sheets, and a wide connector library. If your primary data sources are cloud warehouses, Astrato's native data connectivity covers your needs fully. For teams with complex multi-source legacy environments, Tableau's connector breadth may be a practical advantage.
How does Astrato handle row-level security compared to Tableau?
Astrato inherits row-level security directly from the warehouse — defined once in Snowflake, BigQuery, or Databricks, and enforced everywhere, including embedded dashboards and AI queries. Tableau implements row-level security in the BI layer, which means governance must be configured separately and kept in sync with the warehouse. For teams where governance is already built into the warehouse, Astrato's approach eliminates a maintenance overhead and reduces the risk of discrepancies between the warehouse and BI layer permissions.
Is the steep learning curve really a problem with Tableau?
For basic dashboard building, Tableau's user interface is approachable. The steep learning curve begins with advanced features — Level of Detail expressions, calculated fields, table calculations, and data blending all require dedicated training to use effectively. G2 reviewers cite this as the top negative theme with 282 verified mentions. For non technical users who need to analyze data independently, the practical ceiling of unaided self service BI is lower than Tableau's marketing suggests. Astrato's semantic layer removes much of this complexity by exposing governed business metrics rather than raw data structures — enabling more users to explore data without technical expertise.
How do the two platforms compare on embedded analytics pricing?
Tableau's embedded analytics uses viewer licences and per-impression fees above an included threshold. For customer-facing applications with large numbers of external users, these costs scale unpredictably. Astrato's embedded analytics is usage-based — you pay for warehouse compute, not per-viewer fees. For SaaS companies and data product builders, this makes Astrato's economics significantly more predictable as the user base grows, and removes the pricing dynamic that makes Tableau far from the cheapest option for embedded use cases at scale.
How does Astrato handle data preparation compared to Tableau Prep?
Tableau Prep is a separate product for data preparation, included only with the Creator licence. Explorers and Viewers cannot use it, which creates a gap in teams with mixed user roles who need to prepare data from multiple data sources. Astrato is designed to work with data that's already been prepared in the warehouse — typically through dbt, SQL, or analytics engineering workflows. The semantic layer then exposes cleaned, governed metrics to all users without requiring a separate preparation tool. For teams on modern data stacks, this fits naturally into the workflow where data preparation happens upstream, not inside the BI tool.
Can Astrato handle large datasets and complex queries?
Yes — because Astrato pushes all computation down to the warehouse using pushdown SQL. Complex data and large dataset performance is handled by Snowflake, BigQuery, or Databricks compute, which is purpose-built for scale. Astrato also leverages warehouse caching, so repeat queries run almost instantly without additional compute cost. This makes performance on complex data predictable in a way that extract-based BI cannot match — because the warehouse handles the compute, and the warehouse scales.
Does Astrato require Salesforce?
No. Astrato has zero Salesforce dependency and works with any cloud data warehouse or database it connects to. Tableau's AI features — Tableau Pulse and Einstein Discovery at full functionality — require Salesforce Data Cloud or Salesforce CRM Analytics licences. For teams not in the Salesforce ecosystem, this creates a meaningful constraint on which features are accessible without additional infrastructure investment.
How long does migration from Tableau to Astrato take?
Faster than the original Tableau implementation. Because Astrato connects directly to the existing cloud warehouse without extract pipelines, the data connectivity layer is already in place. Customers regularly go from first connection to fully operational analytics in 60 days. The semantic layer and metric definitions can be built incrementally — most teams start with their highest-priority dashboards and migrate additional content over time.
See Astrato on your data warehouse
Astrato runs a 30-minute demo tailored to your stack — Snowflake, Databricks, BigQuery, or Redshift. You'll see live queries running against your data architecture, self service BI in action for non technical users, embedded analytics in a product context, and what writeback looks like for operational decision making workflows. Book a demo today.
Ready to experience next-gen analytics?
See how Astrato runs natively in your warehouse.