The Complete Guide to Embedded Analytics for SaaS Products (2026)

How to Deliver Fully Branded, Real-Time Dashboards Your Users Actually Use
A few years ago, adding analytics to a SaaS product meant embedding a dashboard tab somewhere in the navigation and hoping customers would find it useful. Today, that approach reads like a relic from a different era – the software equivalent of a flip phone in a world of foldables.
Talk to enough SaaS teams – founders, PMs, data leaders – and you start noticing the same gravitational pull: products aren’t judged on feature breadth anymore. They’re judged on how quickly they turn information into understanding.
Embedded analytics sits right at the center of that shift.
Not because dashboards are glamorous, but because they quietly change how users behave, how teams operate, and how companies grow.
But there’s a reason so many teams still struggle: most BI tools were built for analysts, not for embedding into SaaS products. The result? The three most common challenges we hear about:
- “Our dashboards feel bolted-on.”
- “Branding is impossible in our current tool.”
- “We can’t scale multi-tenancy without duplicating dashboards.”
In this guide, we cover what “embedded analytics” actually means in 2026 – and how to implement it properly.
What Is Embedded Analytics? (the 2026 definition)
For years, “embedded analytics” has been treated as a simple idea: take a dashboard, drop it into a product, and call it a feature.
But in 2026, that definition is wildly outdated. Modern SaaS teams expect analytics that behave like part of the product – not a rented window into another tool.
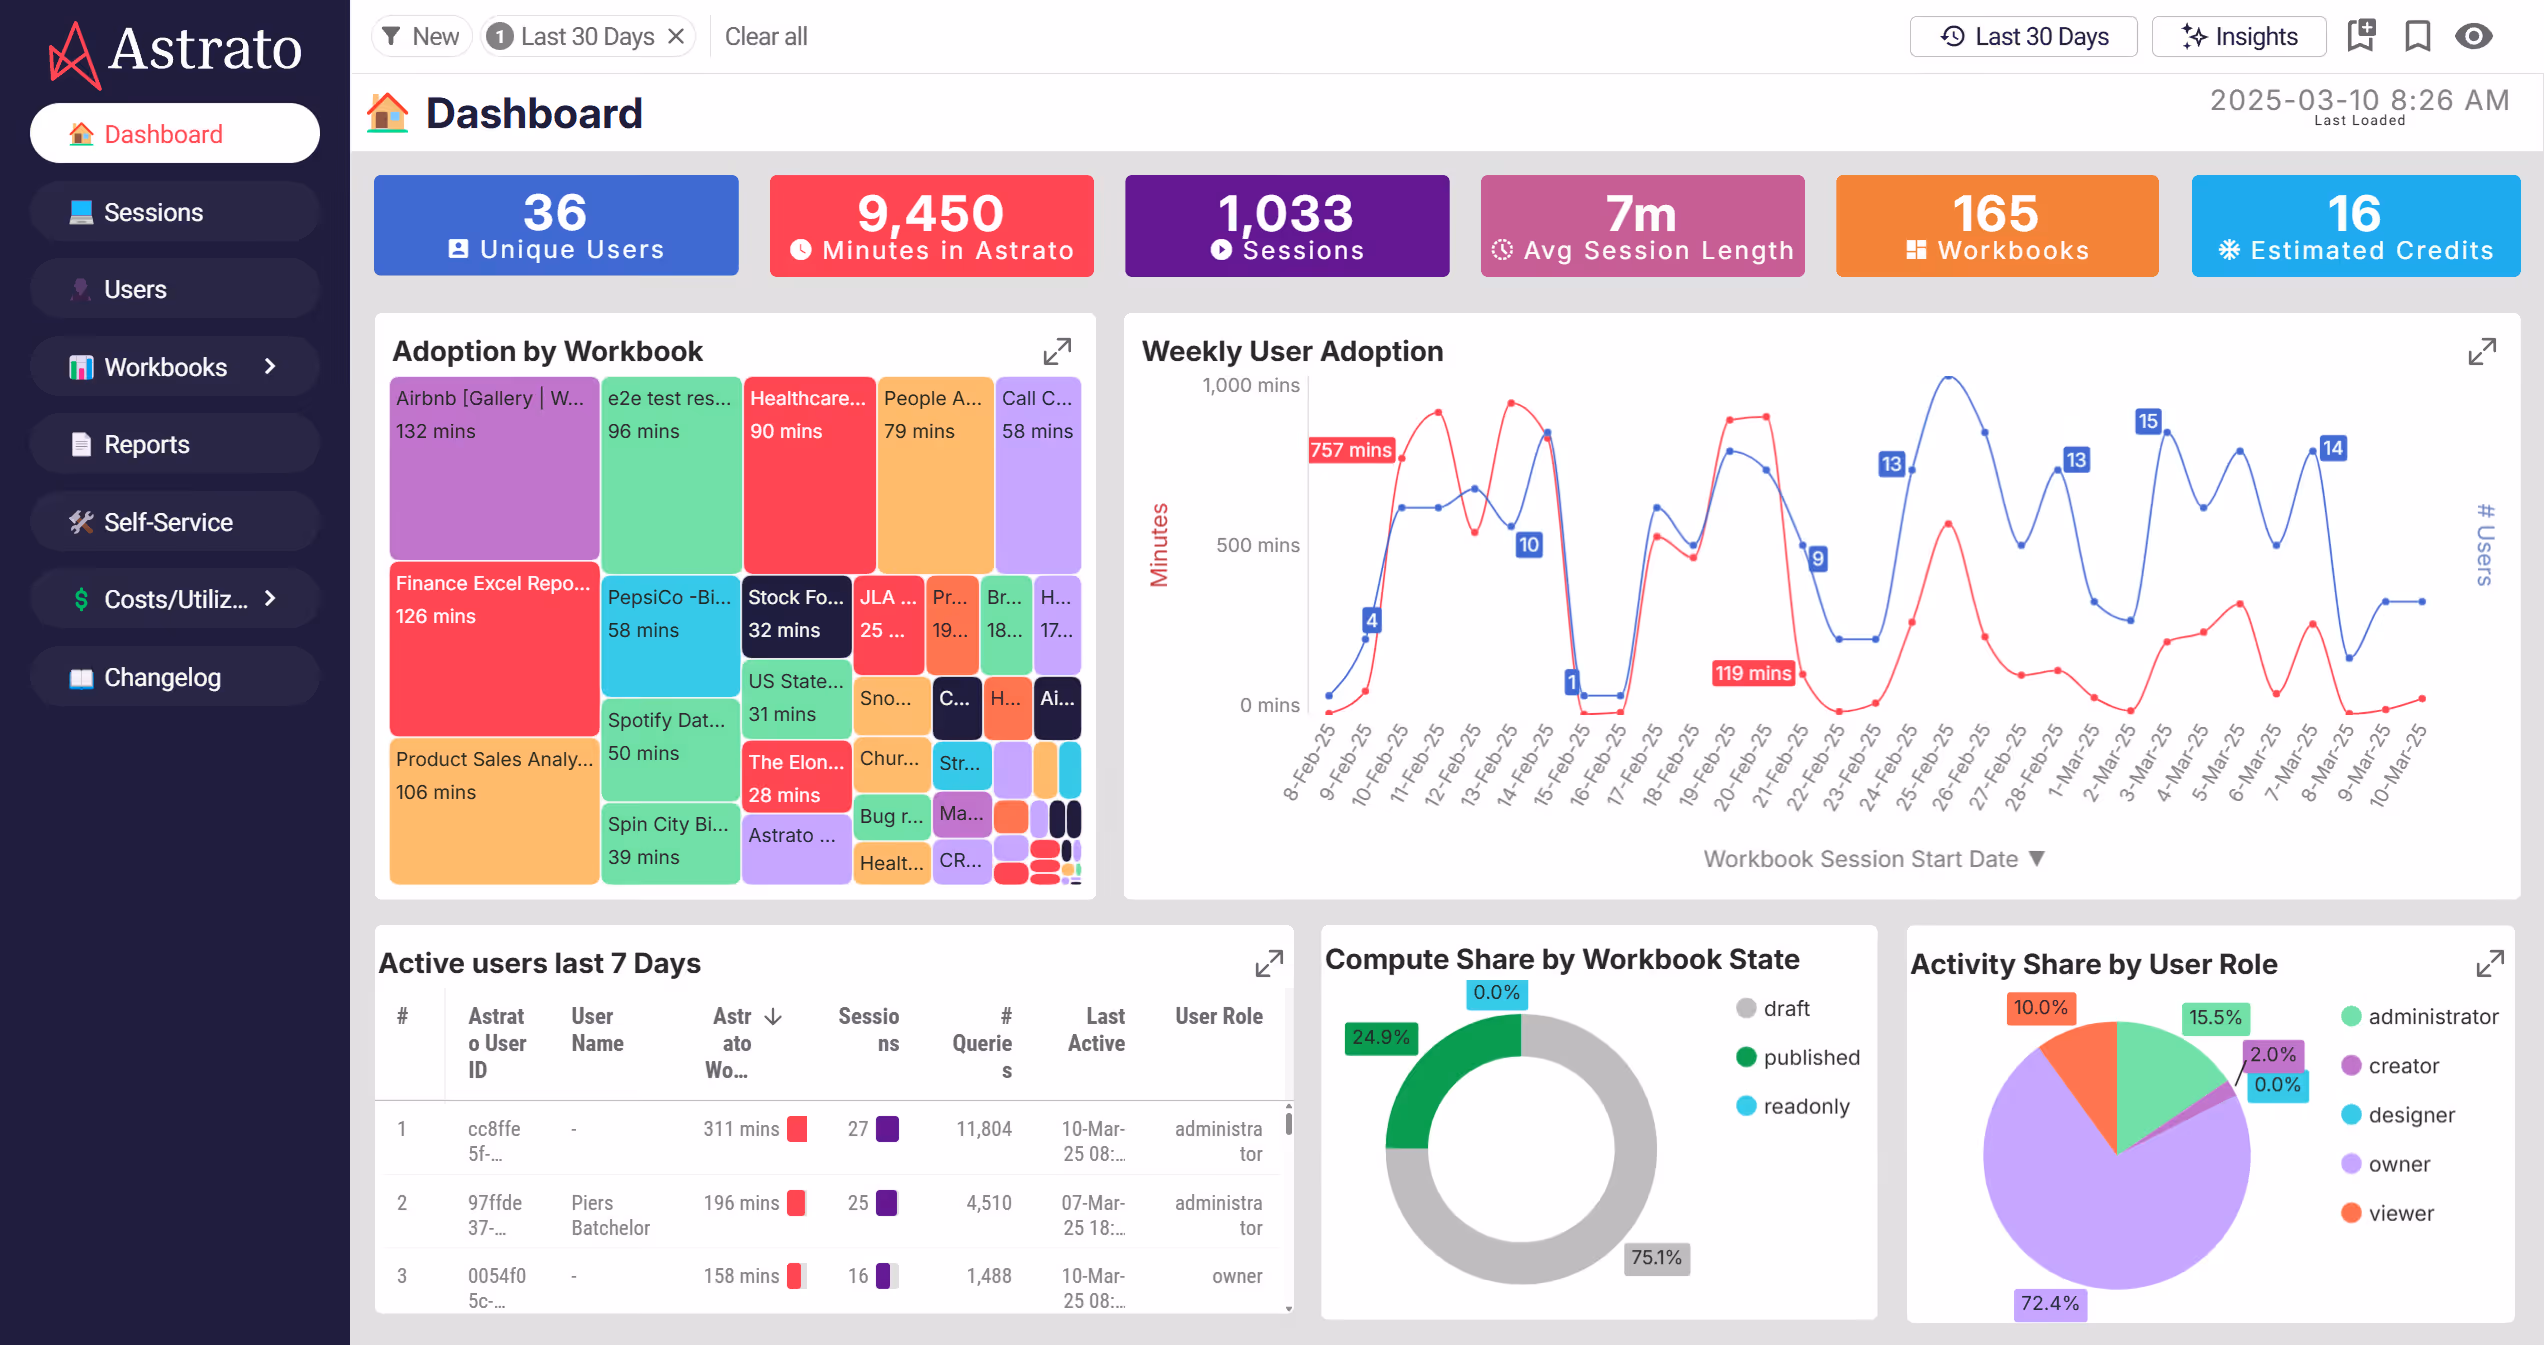
Today, embedded analytics means delivering real-time, governed insights directly inside a SaaS application’s UI, in a way that feels native, secure, and deeply integrated with how users work. It’s analytics designed for software, not dashboards designed for analysts.
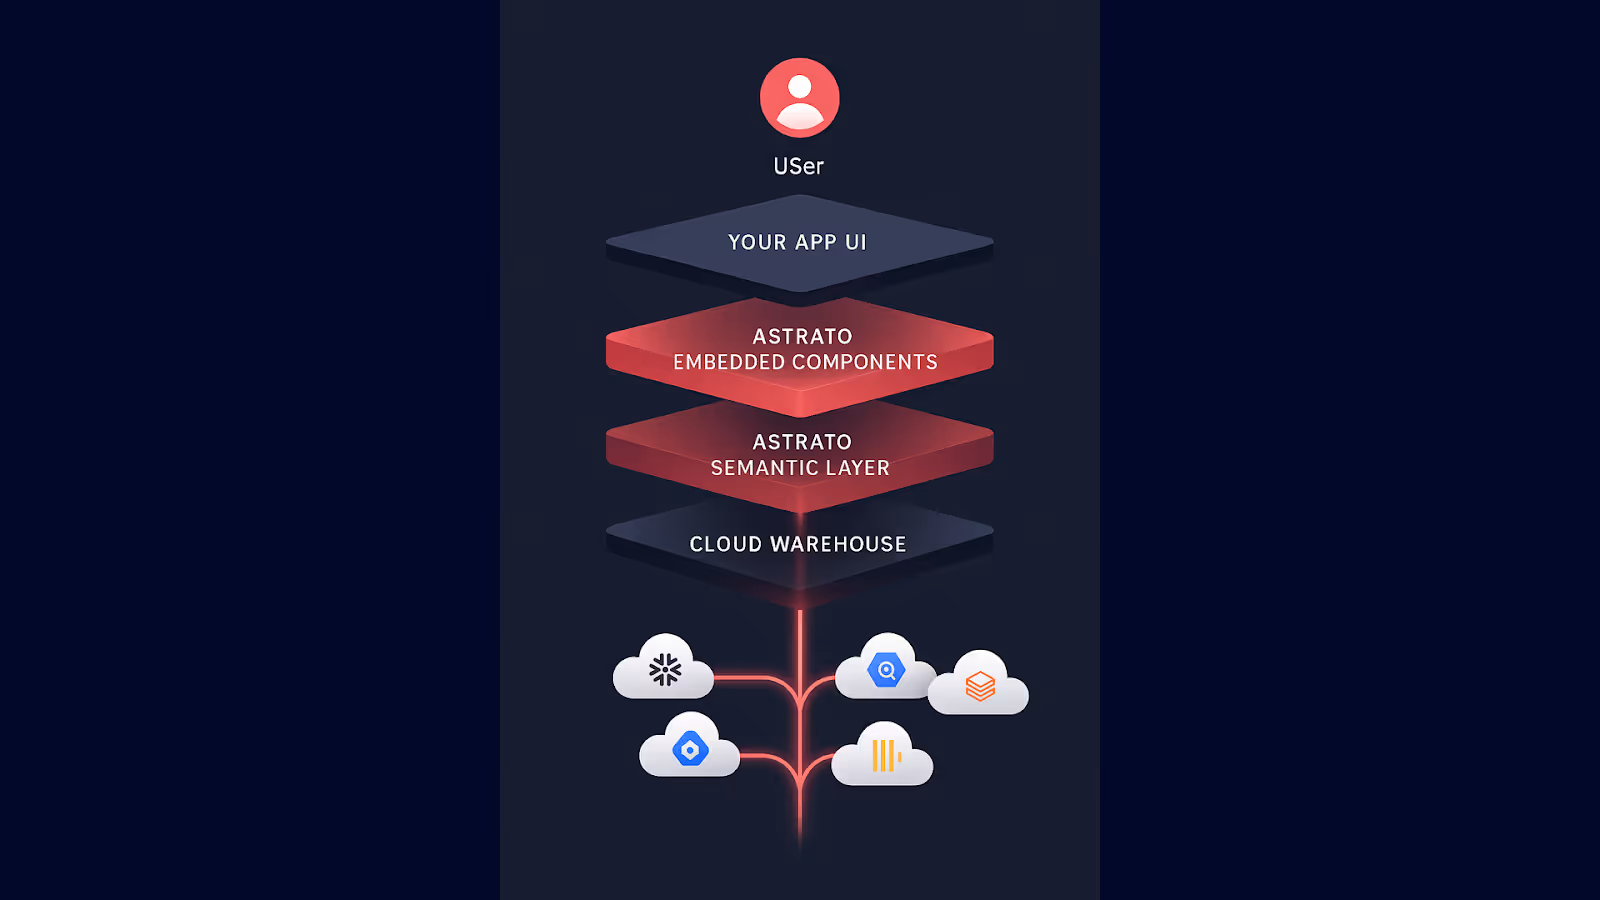
At a high level, embedded analytics unites four layers:
1. The Experience Layer (what users see)
Analytics is no longer a separate destination. It sits inside workflows: the onboarding funnel, the payments screen, the operations panel, the scheduling view.
Instead of asking users to “go check the dashboard”, insights appear where decisions happen – with your product’s styling, fonts, interactions, and tone.
This is where SaaS teams win adoption: when analytics feels as intentional as every other part of the interface.
2. The Data Layer (where the truth lives)
Modern embedded analytics connect directly to cloud data warehouses – Snowflake, Databricks, BigQuery, ClickHouse, Redshift – without extracts, pipelines, or lag.
Insights reflect what’s happening right now, not whatever the last scheduled refresh allowed.
For SaaS users, the difference is night and day. They stop seeing analytics as a static report and start seeing it as a living part of the product.
3. The Security & Governance Layer (how trust is maintained)
Multi-tenant SaaS environments cannot rely on improvisation.
Embedded analytics inherits the product’s authentication (SSO, JWT) and enforces its permissions model – down to row-level and column-level access.
This is where modern platforms stand apart from legacy BI: governance isn’t an afterthought, it’s part of the architecture.
Users only see the data they’re meant to see, and every interaction respects warehouse policies automatically.
4. The Workflow Layer (where insight turns into action)
The old BI model ended at visualizing the numbers.
Embedded analytics now goes further: letting users write back, comment, update parameters, launch automations, or trigger decisions directly from the visualization.
This turns analytics from “a place where things are observed” into “a place where things happen”.
So what is embedded analytics in 2026?
It’s a native part of the SaaS product that:
- surfaces insight at the exact moment users need clarity
- reflects real-time warehouse data
- respects every security layer of a multi-tenant architecture
- looks, feels, and behaves like the rest of the product’s UI
- supports exploration without exposing complexity
- enables actions, not just observations
- scales across customers with zero dashboard duplication
In practice, embedded analytics is the layer that connects your product to your users’ understanding of what’s happening inside it. It turns data from something customers export…into something they experience.
And as buyers increasingly expect software to explain itself, this definition has become the new baseline.
Why Embedded Analytics Drives SaaS Growth
In conversations with SaaS founders, PMs, and data teams, five growth levers appear again and again:
1. Higher product adoption
A revealing pattern appears across countless SaaS platforms: analytics hidden in a separate “Reports” tab get polite, occasional clicks. Analytics placed directly inside the workflow – styled to look like they belong there – get used constantly.
Users don’t consciously think, “I’m now entering analytics”. They simply interact with information while doing their work.
But here’s the deeper effect product teams often underestimate: embedded analytics keeps users in your product longer.
When data is woven directly into the experience, users stop:
- exporting CSVs
- screenshotting dashboards
- switching to spreadsheets
- jumping into external BI tools
- copy-pasting charts into decks
- building their own workarounds
Instead, the product becomes the place where they understand what’s happening and the place where they act on it.
This is how adoption turns into stickiness. Usage stops being a series of disconnected touchpoints and becomes a continuous loop of see → understand → act → repeat — all inside your platform.
Products that embed insights next to actions see those insights become part of the muscle memory of the product. That’s when analytics stop being “a feature” and start being the way users understand what’s happening.

2. Lower Churn
Churn rarely starts with dissatisfaction – it starts with uncertainty.
When customers can’t clearly see the outcomes your product delivers, they begin to question its value. Embedded analytics attacks that uncertainty at its source by making value visible, continuously, and in context.
Instead of sending reports, exporting spreadsheets, or relying on CSM walkthroughs, in-product analytics shows customers their progress, their improvements, their wins – right where the work happens.
When a customer opens your app and immediately sees trends improving, alerts calming down, inefficiencies shrinking, or productivity climbing, the product stops being a tool and becomes a feedback loop. It tells them, without interpretation, “This is working”.
And perhaps most importantly: customers who understand their own progress don’t shop for alternatives. They don’t need reassurance from a CSM. The product itself becomes its own retention mechanism.
3. Clear Product Differentiation
In software evaluations, analytics often become the moment where a product either stands apart… or falls flat.
The pattern isn’t subtle. During demos, prospects routinely gravitate toward anything that surfaces clarity: a real-time trend, a personalized summary, a metric that answers a question before they need to ask it.
In competitive categories, this is often the difference between “sounds great” and “this solves our problem.”
Embedded analytics becomes the quiet amplifier of product value – the part that shows, rather than tells, what your platform can do.
4. New Revenue Opportunities
As SaaS companies mature, one universal discovery emerges: customers are willing to pay for deeper insight.
Not for more dashboards, but for:
- richer context around their performance
- forward-looking forecasts
- industry or portfolio benchmarks
- deeper, more powerful breakdowns
- automated summaries and insights
- highly specialized views tailored to their workflow
Advanced analytics consistently becomes one of the easiest ways to unlock higher ARPU. It’s not an add-on but a premium data experience – and customers immediately feel the difference.
This is why so many SaaS products build “Pro Analytics”, “Advanced Reporting”, or “Intelligence Packs” into their pricing structure.
Because insights sit close to business value, customers naturally attach more willingness to pay. Embedded analytics turns understanding into a revenue line without requiring new core features. And can often become the reason why customers choose to pay for a higher tier.
5. A Smaller Analytics Backlog (and a faster product team)
Every SaaS company recognizes this one: the endless queue of requests for custom reports, variant dashboards, tenant-specific filters, and “quick views”.
This backlog grows until users can explore safely on their own.
The moment a product introduces governed self-service – the kind that lets users drill, filter, compare, pivot, and annotate without breaking anything – support load drops, engineering distractions evaporate, and product teams regain momentum.
You can almost watch the bottleneck disappear as users move from “Can you pull this for me?” to “I’ve got what I need”.
The 8 Capabilities Every SaaS Product Needs in Embedded Analytics
Why most embedded dashboards fall short – and what modern SaaS teams now demand.
For SaaS products, embedded analytics isn’t just another feature. It’s part of the user journey, part of the trust equation, and increasingly part of the product’s competitive edge. But most BI tools were never designed to sit inside software; they were built for analysts running reports, not customers interacting with live data.
To deliver analytics that feel like a real part of your product, not an afterthought, you need eight core capabilities. Think of them as the architectural foundations of an analytics experience that customers actually use – and rely on.
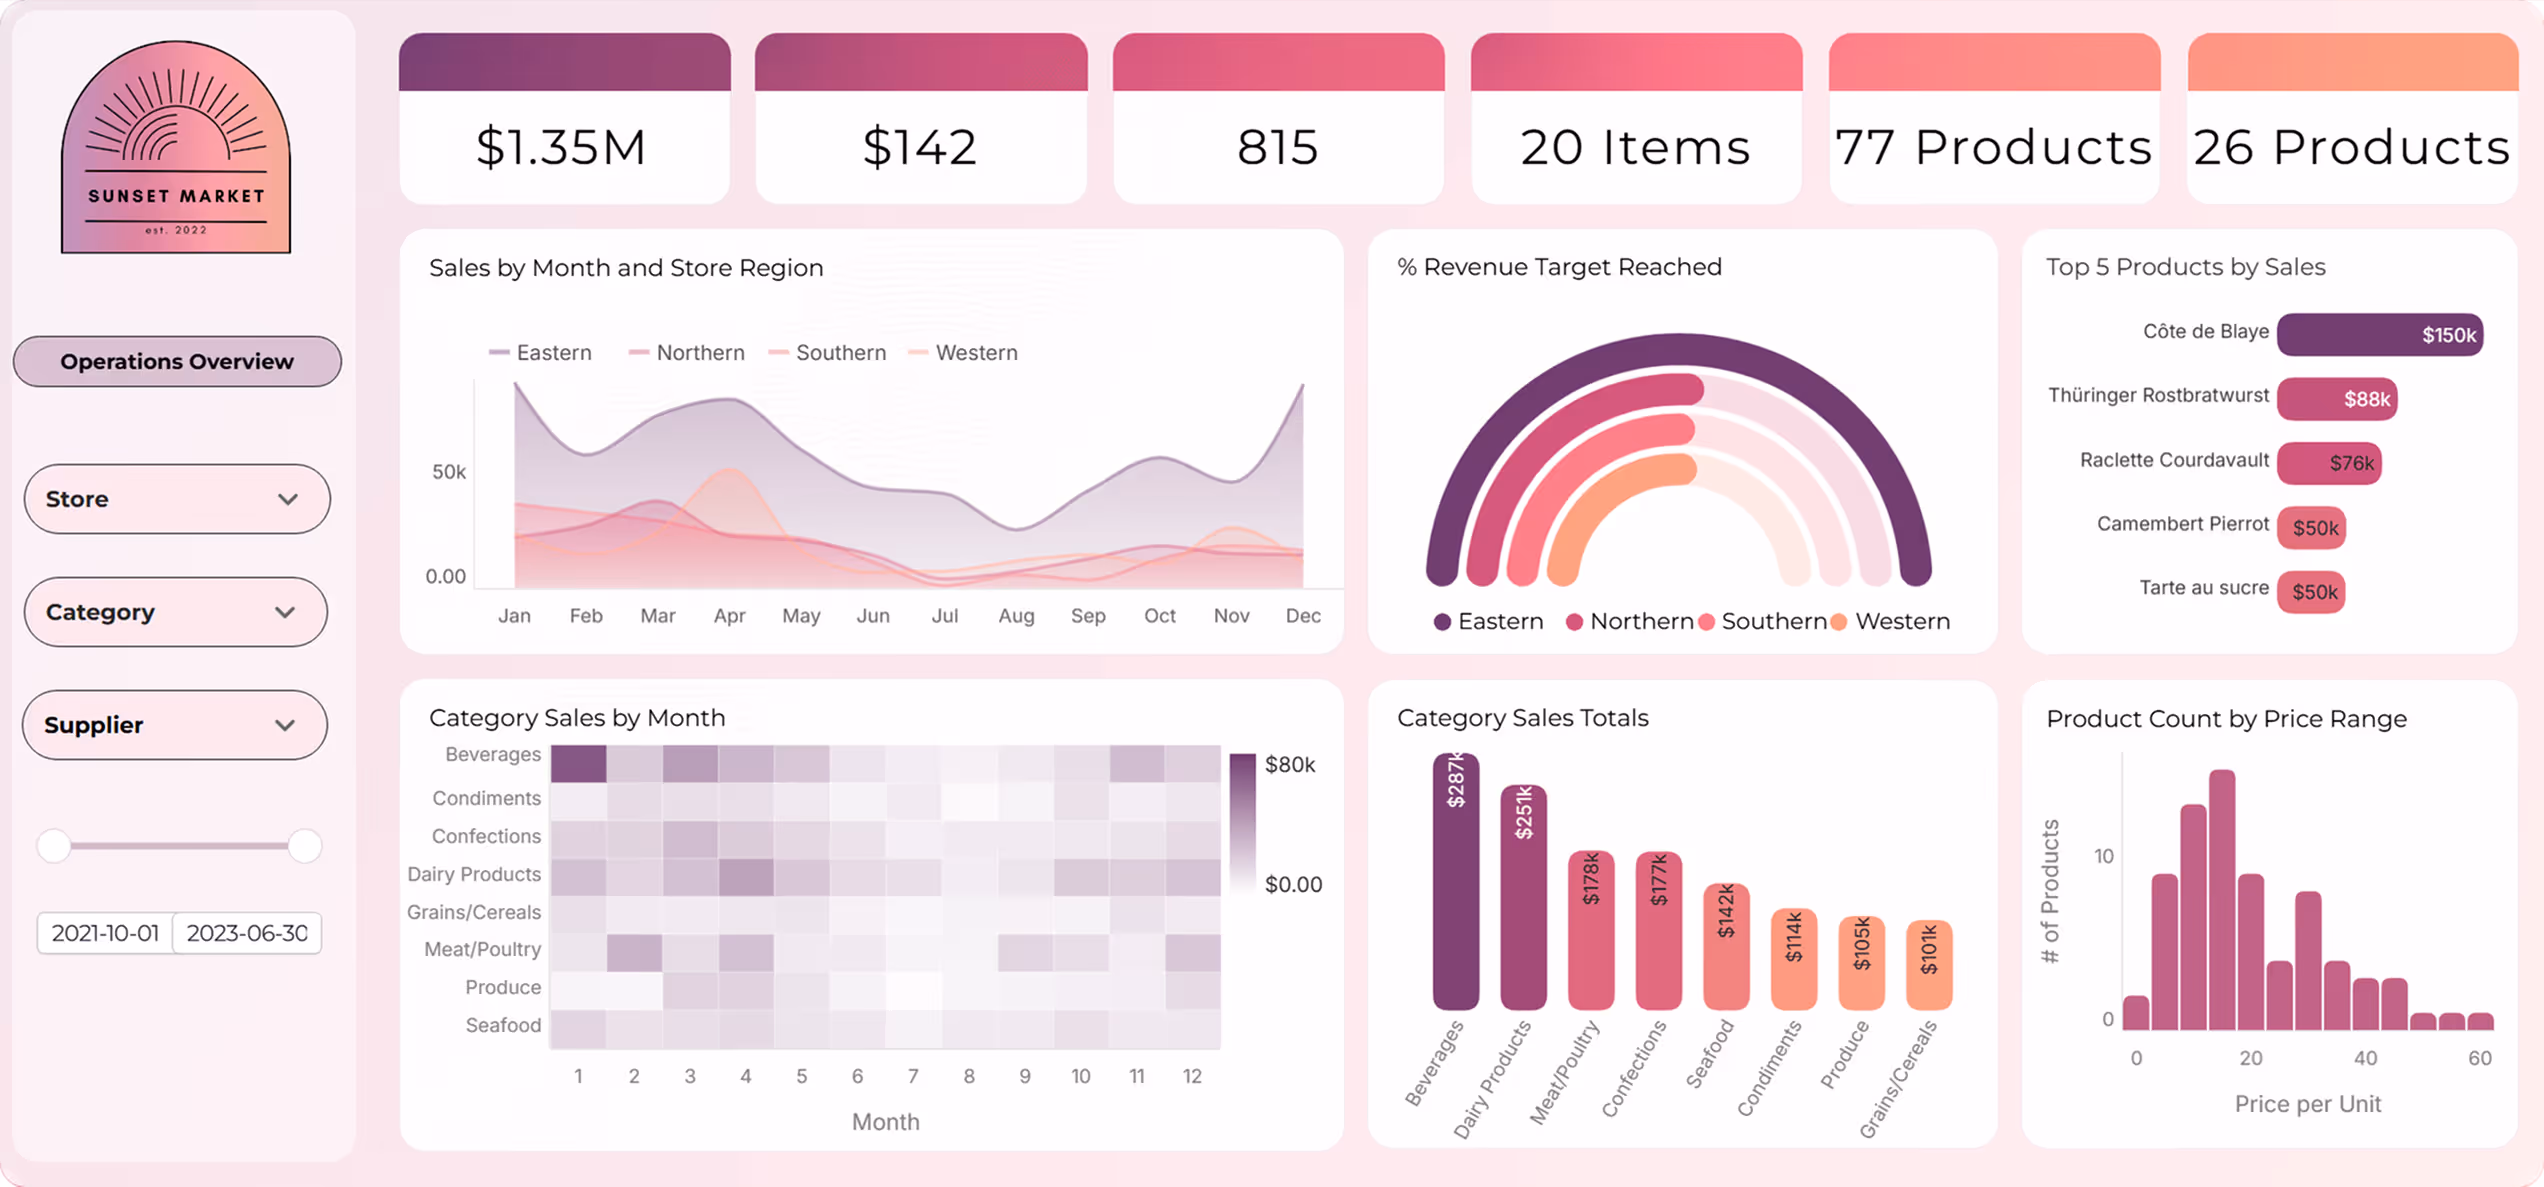
1. Full Branding & Pixel-Perfect Customization
Great embedded analytics blend into your product so naturally that users never question what belongs to whom.
Typography, spacing, color tokens, hover states – all of it should feel native. When dashboards don’t match your UI system, users instantly sense they’re looking at something external. Confidence drops, and so does adoption.

What you need to look for in an embedded analytics platform:
- Full control over fonts, colors, shadows, borders, and spacing
- Layouts that match your design system (including responsive behavior)
- Light and dark mode support that adapts to your app
- Component-level embedding for placing KPIs, charts, or filters anywhere in your UI
- UX patterns that feel consistent with your product’s interactions
Users judge analytics the same way they judge any other part of your experience: by its coherence and craft.
2. Real-Time Performance (no extracts)
SaaS products move in real time – your analytics should too.
Customers expect dashboards to reflect their latest activity, not a delayed data snapshot. Extract-based BI architectures, which rely on scheduled refreshes, batch pipelines, or multiple caching layers, simply can’t keep up.
Real-time matters because it makes analytics feel like part of the product, not a reporting system bolted onto it. It eliminates the cognitive dissonance users feel when they see something in the app that doesn’t match the numbers in the dashboard.
What you need to look for:
- Direct live-query access to Snowflake, Databricks, BigQuery, ClickHouse, and other warehouses
- Smart caching that accelerates performance without compromising freshness
- Fast query response times, even on large datasets
- Ability to personalize data per tenant without pre-processing or extracts
Real-time isn’t a performance feature, it’s a trust feature.
3. Secure Multi-Tenancy (SSO, JWT, RLS with seamless user provisioning)
Multi-tenancy is where most legacy BI tools break down. SaaS products need one analytics experience that safely serves every customer, without duplicating dashboards, maintaining separate workspaces, or manually configuring user access.
Great multi-tenant analytics starts with identity. Your app needs to pass who the user is, which tenant they belong to, and what they can see into the analytics layer. That context should flow automatically through SSO (SAML/OIDC), continue through a signed JWT, and land in the warehouse where row- and column-level security enforce the final rules.
But the real unlock is seamless user provisioning: new users, new tenants, and role changes inherit the right analytics access the moment they authenticate – with no manual setup inside the BI tool. No syncing. No drift. No risk of users seeing too much (or too little).
When authentication, authorization, and warehouse-level governance all work together, you get multi-tenant analytics that’s secure, scalable, and maintenance-light.
What you need to look for in an embedded analytics platform:
- SSO support (SAML/OIDC) that flows cleanly through your login
- JWT-based context that passes tenant, user, and role information
- Seamless user provisioning with automatic access assignment
- Row- and column-level security enforced natively at the warehouse
- A semantic layer that applies consistent rules across all surfaces
- One dashboard capable of securely serving every tenant
Secure multi-tenancy helps prevent data leakage and is the foundation that makes embedded analytics scalable – one model, one dashboard, infinite personalization.
4. Flexible Embedding Options (from full dashboards to individual components)
Embedding isn’t one-size-fits-all. Different parts of your product demand different embedding strategies.
A high-level overview might use a full-page dashboard. A mission-critical workflow might require a single embedded KPI or table that blends seamlessly with your UI.
Modern embedded platforms offer a full spectrum of embedding options – and your product will likely need all of them.
What you need to look for:
- iFrame embedding for simple full-dashboard surfaces
- A JavaScript SDK for deeper integration, two-way communication, and event handling
- Object-level embedding (charts, KPIs, filters, tables) that fit into your native layout
- Ability to control your analytics (such as variables and filter states), from your own UI
- Responsive, fluid resizing that adapts to product surfaces
The more flexible the embedding model, the more “part of the product” your analytics will feel.
5. Governed Self-Service Exploration
Your customers want to explore data – but they want to do it without breaking anything, creating chaos, or logging into a separate BI tool.
Embedded analytics must strike a balance: users should be able to investigate, pivot, drill down, and adjust, but always within the boundaries of your definitions and governance.

This is where the semantic layer becomes your ally: a centralized, consistent definition of metrics and logic that gives users freedom and protects your product from inconsistencies.
What you need to look for:
- Governed measures and logic defined in a semantic layer
- Exploration modes that offer flexibility without exposing raw schemas
- Role-based permissioning that limits what different users can do
- Drilldowns, pivots, and filters that respect RLS and warehouse policies
- An experience intuitive enough for business users, not only analysts
When self-service is done well, it reduces support tickets and deepens engagement.
6. Actions, Writeback & Workflow Support
Dashboards that only display information miss the point.
SaaS users want to take action while they’re in the product – adjust budgets, update scenarios, change thresholds, add commentary, or approve requests. The future of embedded analytics is interactive: analytics that support workflows, not just reporting.
This is where embedded analytics evolves into data applications.
What you need to look for:
- Secure writeback directly into your warehouse tables
- Editable tables with validation rules
- Buttons, actions, and triggers that call external APIs
- Persistent comments, annotations, and notes
- Support for multi-step workflows (e.g., review → update → recalc)
Analytics becomes exponentially more valuable when it drives decisions, not just describes them.
7. Governance & Auditability with telemetry for product usage
For many SaaS categories – FinTech, PropTech, healthcare, supply chain – governance is a core requirement. Embedded analytics must inherit the same governance policies as your warehouse. If the analytics layer can override those rules, you introduce inconsistencies, compliance concerns, and unnecessary risk.
Governance isn’t only about protecting data – it’s about ensuring every metric, every export, every drilldown, and every scheduled report reflects the same trusted definitions.
Telemetry adds another layer: the ability to see how customers actually use each dashboard, KPI, and workflow. This helps product teams understand adoption patterns, guide feature decisions, and validate which insights create the most value.
What you need to look for in an embedded analytics platform:
- SQL lineage that shows exactly how every metric is calculated
- Version-controlled semantic logic to keep definitions consistent
- Audit logs for access, changes, and usage behavior
- Row-, column-, and masking policies enforced natively at the warehouse
- Integration with Snowflake governance (tags, masking), Databricks Unity Catalog, BigQuery IAM
- Consistent application of logic across dashboards, embedded components, and scheduled reports
- Telemetry to understand how users interact with analytics, enabling true product analytics and better roadmap decisions
Governance isn’t a layer you add later. It’s what makes embedded analytics reliable, compliant, and enterprise-ready from day one.
8. Reporting & Delivery (still critical in 2026)
Despite real-time dashboards becoming the norm, reporting has not gone away – it has evolved. Executives still expect polished PDFs, PowerPoint decks, or Excel exports that summarize the state of the business. What’s changed is the expectation that these reports are branded, governed, and personalized.

Reports shouldn’t require recreating logic. They should inherit everything from the live dashboard.
What you need to look for:
- Fully branded PDF, PPT, and Excel exports
- Scheduled delivery that applies row-level security automatically
- “Run as each recipient” execution for per-user personalization
- AI-assisted summaries or anomaly highlights
- Reports that always match the live dashboards (no forks, no duplicates)
Reporting isn’t “old”. It’s part of how decisions circulate across an organization – and it needs to reflect your product’s quality.
10 Tips on How to Make Embedded Analytics Feel Like Part of Your Product
Most embedded dashboards fail for the same reason: they look like visitors. They don’t speak your design language, they don’t follow your interaction patterns, and they definitely don’t obey your layout grid. Users spot the mismatch instantly – and once they do, the illusion of a unified product collapses.
The good news? Modern embedded analytics platforms (especially Astrato) now give SaaS teams everything they need to make analytics feel like it was built in-house. Here’s how to create an experience so seamless that users forget there’s a BI tool under the hood at all.
1. Match the micro UI details users expect
Color palettes are the easy part. What actually makes analytics feel native are the tiny design signals:
- spacing and padding that match your layout grid
- corner radiuses identical to your cards and components
- hover states that feel like your product’s hover states
- typography set to your scale (not the BI vendor’s)
- shadows that match your elevation system
- dark and light modes that flip in sync with your app
Astrato lets you control all of this: color tokens, CSS variables, fonts, rounding, border styles, even drop-shadow intensity. When these micro-details line up, analytics stops feeling “embedded” and starts feeling “designed”.
2. Place Insights Where Users Make Decisions
The biggest mistake SaaS teams make is thinking embedded analytics means “one place” users go to see data. Modern products distribute insight across the experience.
With Astrato’s component-level embedding, you can mix:
- single KPIs embedded directly into product pages
- small clusters of charts in mission-critical workflows
- inline tables with writeback enabled
- workflow cards with live data
- full dashboards for deep exploration
This blend – tiny embeds where quick insight matters, fuller embeds where context matters – is what makes analytics feel essential rather than optional.
3. Use your own layout grid and breakpoints
Legacy BI tools force their own grid, spacing, and page structure. Astrato reverses the relationship.
You control the container and Astrato adapts to it.
Use:
- your grid
- your breakpoints
- your responsive behavior
- your spacing rhythm
This is how analytics melts into the product instead of sitting in a visually separate box.
4. Let your UI control filters, variables, and state
Your product already teaches users how to interact with it. Embedded analytics should follow those same patterns.
With Astrato’s no-code action blocks, your UI can control:
- filters
- time ranges
- drilldowns
- segment toggles
- selected variables
- page navigation
- dark/light mode
This two-way communication creates the illusion that analytics is just another part of your UI kit because, in practice, it is.
5. Surround embedded analytics with your own components
The most convincing embedded analytics surfaces combine:
- your cards
- your tab system
- your buttons
- your panels and sidebars
- your modals
- your dropdowns
…with Astrato’s charts, KPIs, filters, grids, or workflows embedded inside them.
Because Astrato can embed at the component level, you can surround analytics elements with your own UI components. The visual boundary dissolves instantly.
6. Use a Semantic Layer to keep definitions consistent
Nothing breaks trust like different parts of a product calculating metrics differently.
Astrato’s semantic layer centralizes metric definitions and enforces them everywhere:
- dashboards
- embedded components
- writeback workflows
- scheduled reports
- per-user exports
- AI insight blocks
When the semantic layer drives everything, users get one definition of “retention”, “margin”, or “utilization”. Brand consistency is important. Metric consistency is essential.

7. Make analytics actionable and operational with Writeback
If users can only look at the data, it’s not embedded analytics – it’s a read-only dashboard in a different skin.
Astrato’s writeback and actions turn static charts into interactive workflows:
- editable tables
- budget adjustments
- scenario updates
- approvals
- threshold changes
- comments and annotations
- API-triggered actions
When users can take action without leaving the product, analytics stops being “reporting” and becomes part of the workflow.
8. Make reports look like your product, not a BI tool
When executives share reports, they should look and feel like they came from your product – not your BI vendor.
Astrato supports:
- fully branded PDF, PPT, and Excel exports
- custom templates
- live data snapshots
- per-user personalization with “Run as each recipient”
- scheduled delivery that respects row-level security
- AI-generated insight summaries
This extends your product brand beyond the app, into inboxes, boardrooms, and quarterly reviews – exactly where it needs to be.
9. Remove every trace of BI tool’s UI elements
The fastest way to break immersion?
Toolbars, menus, icons, or UI elements that clearly belong to another tool.
Astrato lets you hide or restyle:
- toolbars
- chart elements
- panel frames
- menu icons
- generic controls
Users shouldn’t know a BI engine exists. They should believe your team built everything in-house.
10. Embed insights into flows, not pages
Modern SaaS UX is flow-driven. The question isn’t “Where should the dashboard go?”
It’s: “Where does the user need clarity?”
Ask that, and analytics naturally threads into the product:
- usage analytics in billing
- performance stats in settings
- workflow health on overview screens
- live trends in workspace views
- anomalies surfaced as inline alerts
Astrato’s flexible embedding makes this trivial – the product dictates where analytics lives.
Final thoughts
Embedded analytics isn’t a feature anymore – it’s the layer that makes a SaaS product make sense. Users expect software to show them what’s happening, why it matters, and what to do next. And they expect that clarity inside the product, not in a detached dashboard or a weekly export.
The teams that get this right see the difference immediately: higher adoption, lower churn, clearer differentiation, and customers who understand the value they’re getting without needing it explained.
The teams that don’t? Their analytics feel bolted-on, outdated, or disconnected – and users notice.
If you’re ready to deliver analytics that feel native, real-time, and truly part of your product experience, it’s time to rethink what you embed.
👉 See how Astrato makes modern embedded analytics possible – book a demo.
Ready to experience next-gen analytics?
See how Astrato runs natively in your warehouse.


.avif)