7 Best Power BI Alternatives and Competitors for 2026
Looking for Power BI competitors in 2026? Compare the 7 best Power BI alternatives — Astrato, Tableau, Sigma, ThoughtSpot, Looker, Qlik, Metabase.

For most of the last decade, choosing Power BI wasn't really a choice. It was bundled into Microsoft 365, it worked with Excel, and it cost less than anything else that called itself enterprise business intelligence. Teams standardized on it because the math was obvious — $10 a user for something that plugged into the stack you already paid for. That pragmatism made Microsoft Power BI the default BI tool for over 250,000 organizations worldwide.
That default has cracked in 2026, and three things cracked it at once. In April 2025, Microsoft raised Power BI Pro from $10 to $14 per user per month — a 40% increase with no grandfathering. Power BI itself is no longer positioned as a standalone product; it's now "a workload within Microsoft Fabric," and the Copilot AI features competitors are winning with require Fabric F64+ capacity at roughly $5,258 per month. The $14/user entry point has become a loss-leader into a $60,000+/year platform decision, while Power BI Desktop remains Windows-only — a structural gap Microsoft hasn't closed since 2015.
This article is for teams evaluating what the alternatives actually look like in 2026 — the BI tools that solve specific cost, architecture, or use-case gaps Power BI has opened. Whether you're doing Fabric budget planning and realizing Copilot requires F64+ capacity, pushing back on the 2025 price hike at renewal, hitting Power BI Embedded cost walls at scale, or running Mac-first and tired of virtual machine workarounds, the seven Power BI alternatives below each threaten Power BI on a specific angle worth understanding.
Why Teams Look for Power BI Alternatives
Comparison at a Glance
Before the deep dives, here's how the seven Power BI alternatives stack up on the architectural and commercial dimensions that matter most for a 2026 BI decision. The table is intentionally narrow on rows and wide on columns — the trade-offs between warehouse-native architecture, embedded capability, writeback, and AI features are what separate these business intelligence platforms in practice.
The deep dives below follow a specific ordering. Astrato comes first with the expanded treatment — it's the platform most directly engineered against Power BI's warehouse and embedded gaps. The remaining Power BI competitors are ordered by how directly each threatens Microsoft on a specific angle: visualization depth (Tableau), spreadsheet-native self service (Sigma), AI-first analytics (ThoughtSpot), governance depth (Looker), deployment flexibility (Qlik Sense), and open-source economics (Metabase).
1. Astrato — Best for warehouse-native BI without the Fabric tax or DAX overhead
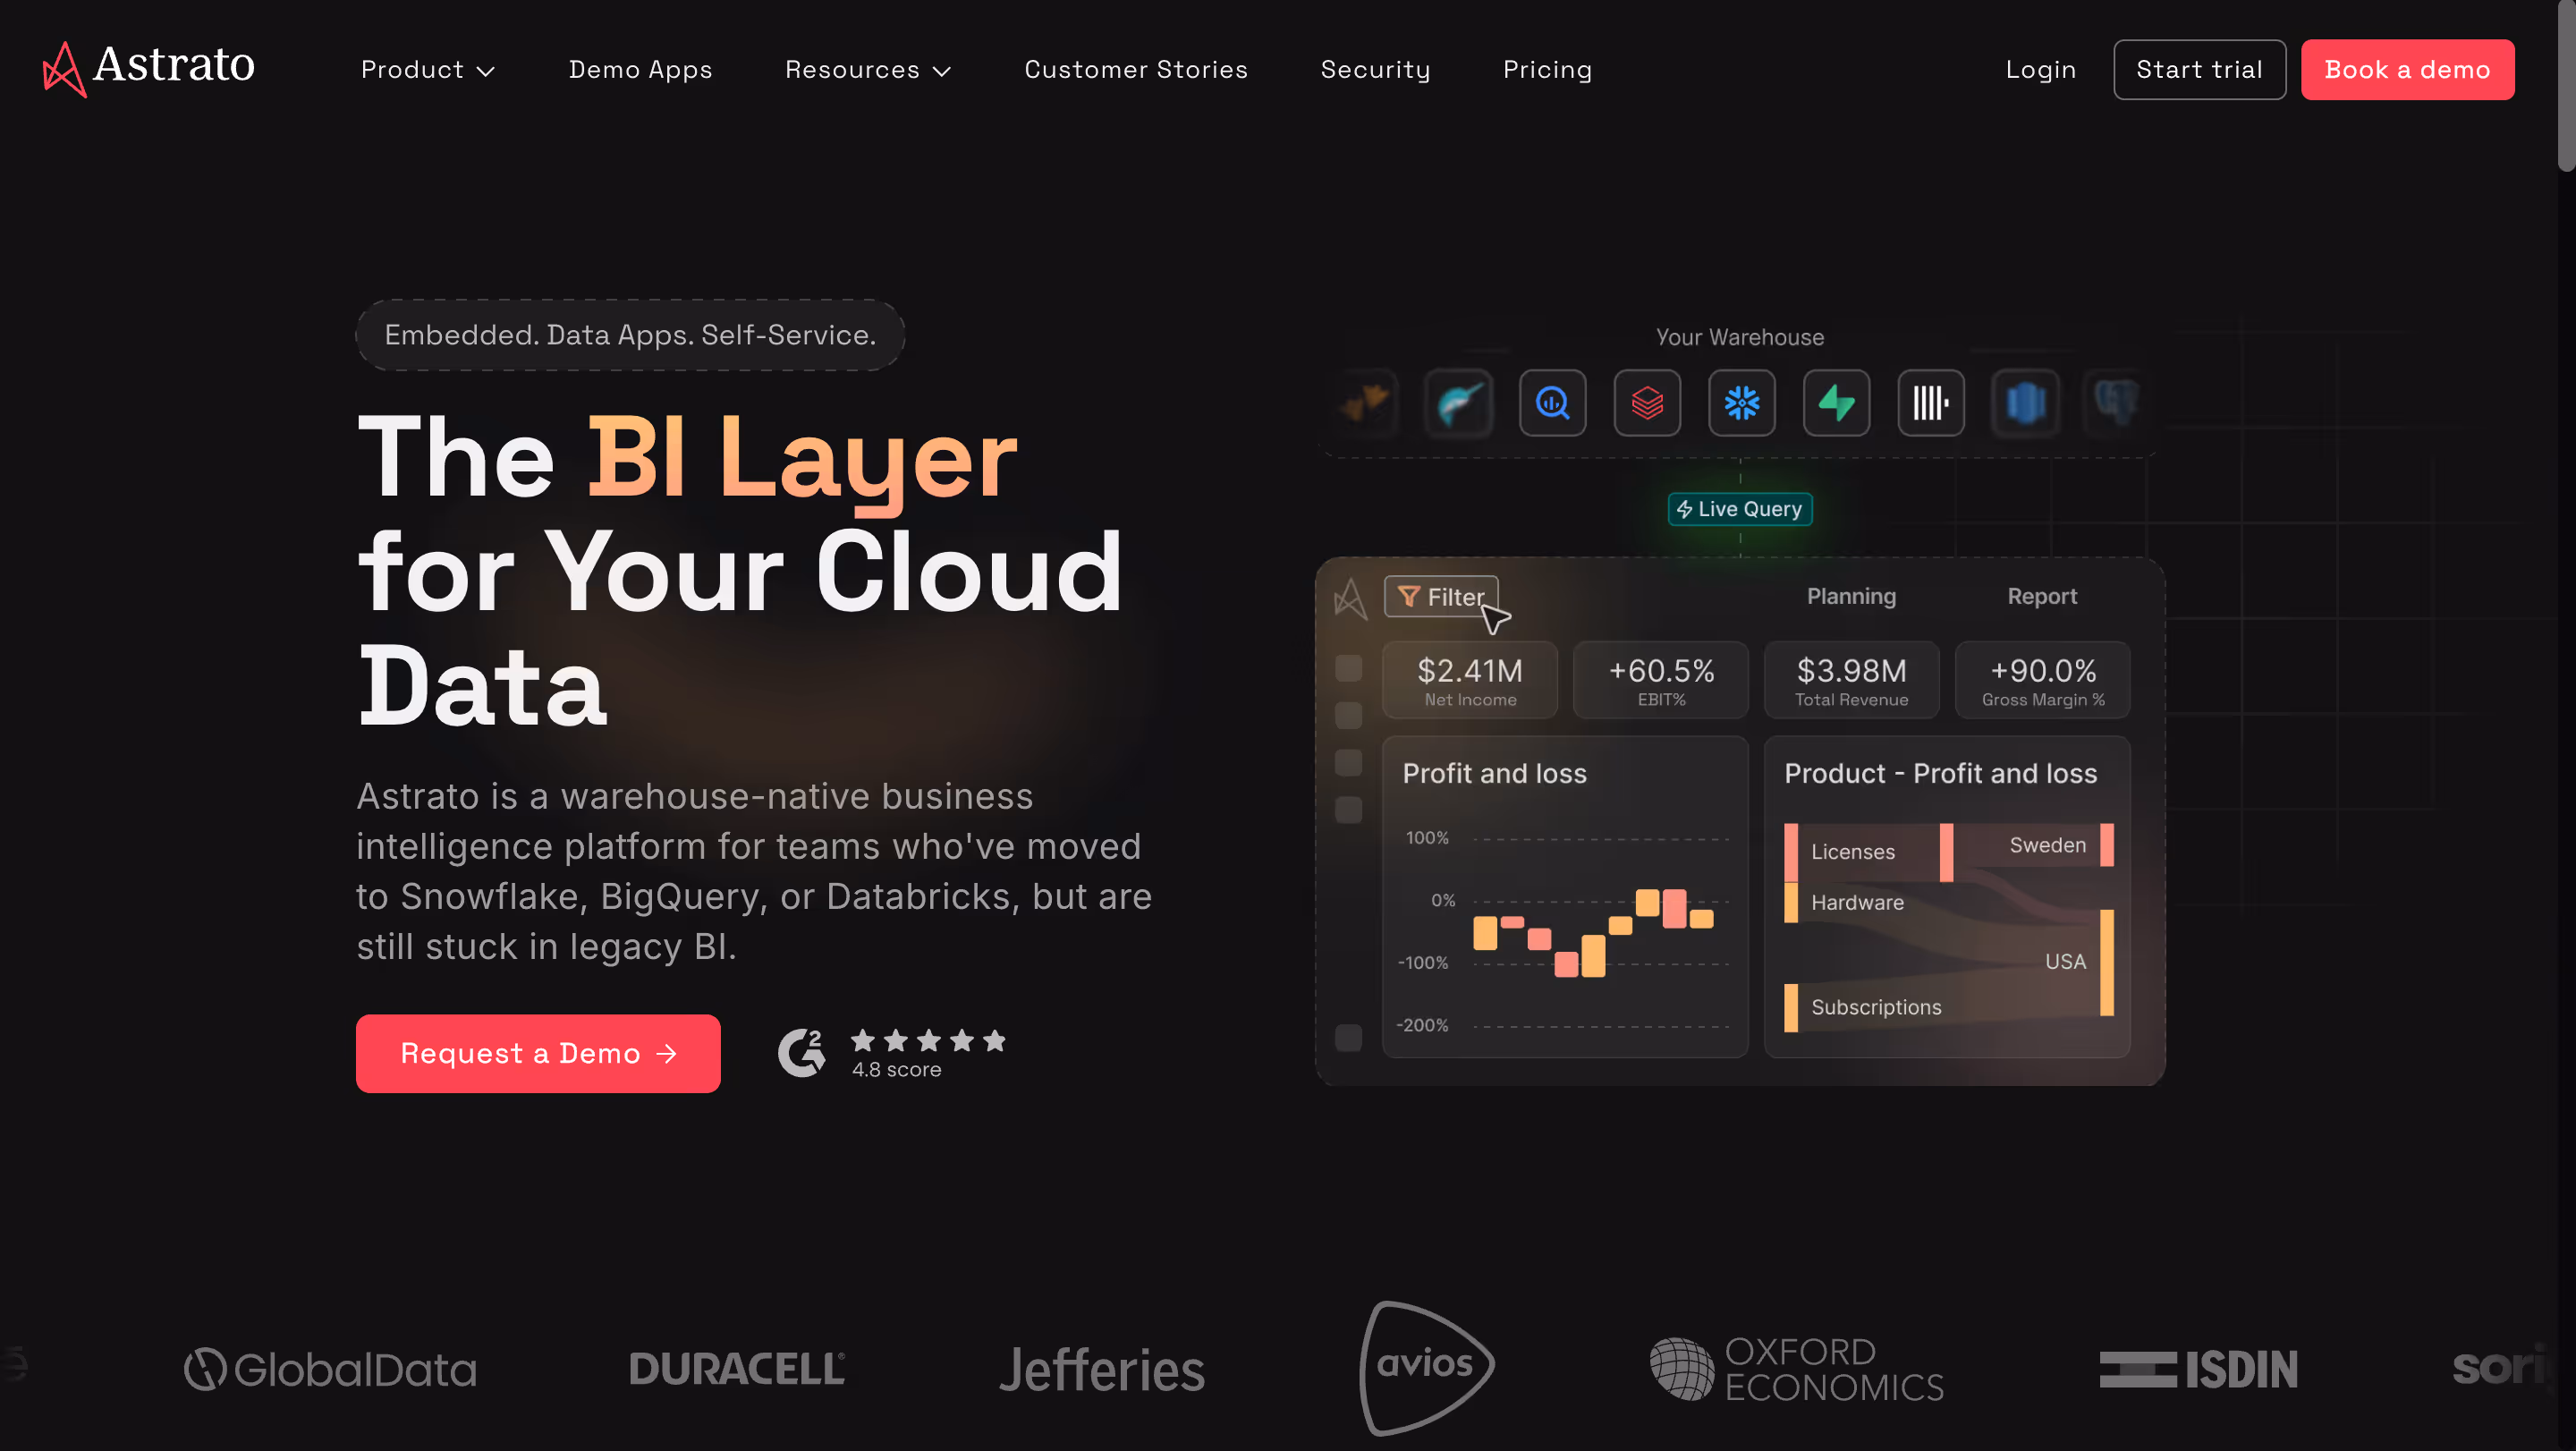
Astrato is a warehouse-native business intelligence platform that queries your cloud data warehouse directly — no extracts, no refresh schedules, no data copies. It's purpose-built for teams running on Snowflake, BigQuery, Databricks, ClickHouse, Redshift, or PostgreSQL who want modern BI without the Microsoft Fabric tax or DAX learning curve. Where Power BI treats the warehouse as a source to pull data from, Astrato treats it as the source of truth to query live. That distinction changes the architecture, the governance model, and the economics of running BI at scale.
Why Astrato?
- Live-query, pure pushdown architecture — no data duplication. Every dashboard executes live against your warehouse. There are no extracts, no Power Query import mode, no refresh schedules to babysit. Where Power BI's default path imports data into its own columnar engine — creating storage costs, governance drift, and scheduled-refresh failures — Astrato keeps your Snowflake, BigQuery, or Databricks warehouse as the single source of truth. You only pay for user queries, with full cost transparency.
- Browser-based, no Windows dependency. Power BI Desktop is Windows-only in 2026, forcing Mac-first organizations into virtual machine workarounds. Astrato runs entirely in the browser on any operating system. There's no desktop app to install, no OS requirement to engineer around, no DAX compiler to keep in sync across Mac and Windows boundaries. Hiring and onboarding stop being constrained by the laptop someone uses.
- No-code semantic layer without DAX. Power BI's advanced data modeling depends on DAX, a formula language that looks like Excel but works fundamentally differently. Teams describe it as the new LookML — a specialist bottleneck that takes months to learn. Astrato's semantic layer is defined once and reused everywhere without requiring analysts to learn a new language. Business users build interactive dashboards without writing DAX measures or Power Query M code.
- Pixel-perfect embedded analytics with usage-based pricing. Where Power BI Embedded layers capacity costs on top of per-user licensing — making customer-facing SaaS analytics economically painful at scale — Astrato's usage-based pricing is purpose-built for embedded deployments serving thousands of end users. Full white-labeling is included without a premium upsell for logo removal, and multi-tenant security is built in from day one.
- Native writeback for operational workflows. Power BI has no native writeback — you extend it through Power Apps integration or third-party tools. Astrato turns dashboards into operational applications: users update forecasts, approve budgets, or enter data corrections directly, with changes syncing back to the warehouse under full governance. Built-in conflict handling prevents two users from acting on the same record at the same time.
- Multi-cloud warehouse support with no ecosystem gravity. Astrato connects equally well to Snowflake, BigQuery, Databricks, Redshift, ClickHouse, and PostgreSQL. There's no Fabric capacity dependency, no Azure assumption, no OneLake integration required. For organizations whose cloud decision shouldn't be dictated by their BI decision, this matters — especially as Fabric deepens Power BI's Microsoft-only gravity.
Astrato's Edge Over Power BI
Power BI's trajectory is the opposite of Astrato's. Microsoft is pulling Power BI deeper into Fabric, deeper into OneLake, deeper into Azure — and pricing AI features behind Fabric capacity that starts at roughly $5,258 per month. Astrato goes the other direction: it stays architecturally neutral on top of whichever warehouse you've already chosen, and it puts AI features on the platform itself rather than behind a capacity paywall.
For organizations that have invested in Snowflake, BigQuery, or Databricks as their warehouse of record, that difference shows up in four specific ways:
- Warehouse-native vs. Fabric-native. Power BI's roadmap increasingly assumes OneLake, Direct Lake mode, and Fabric capacity. Astrato queries your warehouse directly without routing through Microsoft's unified data layer — avoiding architectural and cost pressure to migrate data into OneLake.
- No per-seat compounding. Power BI's per-user licensing turns every dormant viewer into a recurring cost. Astrato's usage-based model pays for actual analytics work, not seats that check a dashboard quarterly. For large internal deployments and customer-facing embedded analytics, this is a materially different cost structure.
- No Copilot paywall. Power BI Copilot requires Fabric F64+ capacity for full functionality. Astrato's AI features work with bring-your-own LLM — Snowflake Cortex, Gemini, OpenAI — without a gating capacity tier. AI comes with the platform, not as a $60K/year upgrade path.
- Platform-independent vs. Windows-only. Power BI Desktop remains Windows-only in 2026. Astrato is browser-based on any OS, which removes a hiring and adoption constraint Microsoft still hasn't addressed after a decade.
What Users Are Saying
Teams migrating from Power BI, Tableau, and Qlik consistently highlight Astrato's warehouse-native architecture, the speed of dashboard deployment, and the quality of live-query performance against cloud data warehouses. Customers cite 50–75% cost savings compared to legacy BI tools and 25–50% faster dashboard development. Organizations evaluating Astrato alongside Sigma, ThoughtSpot, and Power BI consistently call out embedded analytics capability and native writeback as deciding factors.
"Astrato also goes beyond reporting by supporting interactive and embedded analytics, making it well suited for both internal teams and customer-facing applications. Overall, it's an incredibly strong choice for organizations looking for fast, reliable, and actionable analytics at scale."
Giuseppe L. — Enterprise Customer Success Manager
"The ability to write back to Snowflake and Databricks, and to change the semantic layer on the fly. Additionally, built in version control for dashboards saves so much time and work and allows us to quickly rollback to previous versions as needed."
Christopher A. — Founder
"Very flexible tool with a lot of potential to create new tools beyond simple dashboards. Application customization opens the possibility of building different types of data application allowing a new type of interactive analytics. Semantic layers are always useful and powerful in most cases. The team behind it is always available to help and improve the product as well as being very capable."
Jose V. — Data Analytics Manager
Pricing
Astrato uses a usage-based pricing model tied to warehouse compute consumption, with one license type and no distinction between viewers, creators, and developers. There's no feature gating across tiers — every user gets the same capabilities, whether they're building dashboards or just consuming them. This means predictable costs whether you're serving ten analysts or ten thousand embedded end users, a structural contrast to Power BI's per-user model that compounds with distribution. Warehouse compute costs (Snowflake, BigQuery, and the like) are separate and billed by your cloud provider.
Astrato Is Best For
Astrato is best for teams that have invested in a modern cloud data warehouse and want their BI layer to match — particularly organizations needing embedded customer-facing analytics, operational workflows with writeback, or an escape from Power BI's Fabric capacity requirements and DAX learning curve without giving up governance or AI capability.
Watch Out For
Astrato is purpose-built for cloud data warehouses, so if your primary data sources aren't Snowflake, BigQuery, Databricks, ClickHouse, Redshift, or PostgreSQL, it won't be the right fit. As a newer platform it also doesn't yet match Power BI's brand recognition in enterprise procurement conversations — something to factor in if your evaluation process is committee-driven.
For a more comprehensive side-by-side comparison, here's our Astrato vs. Power BI review.
2. Tableau — Best for visualization-heavy teams outside Microsoft ecosystems
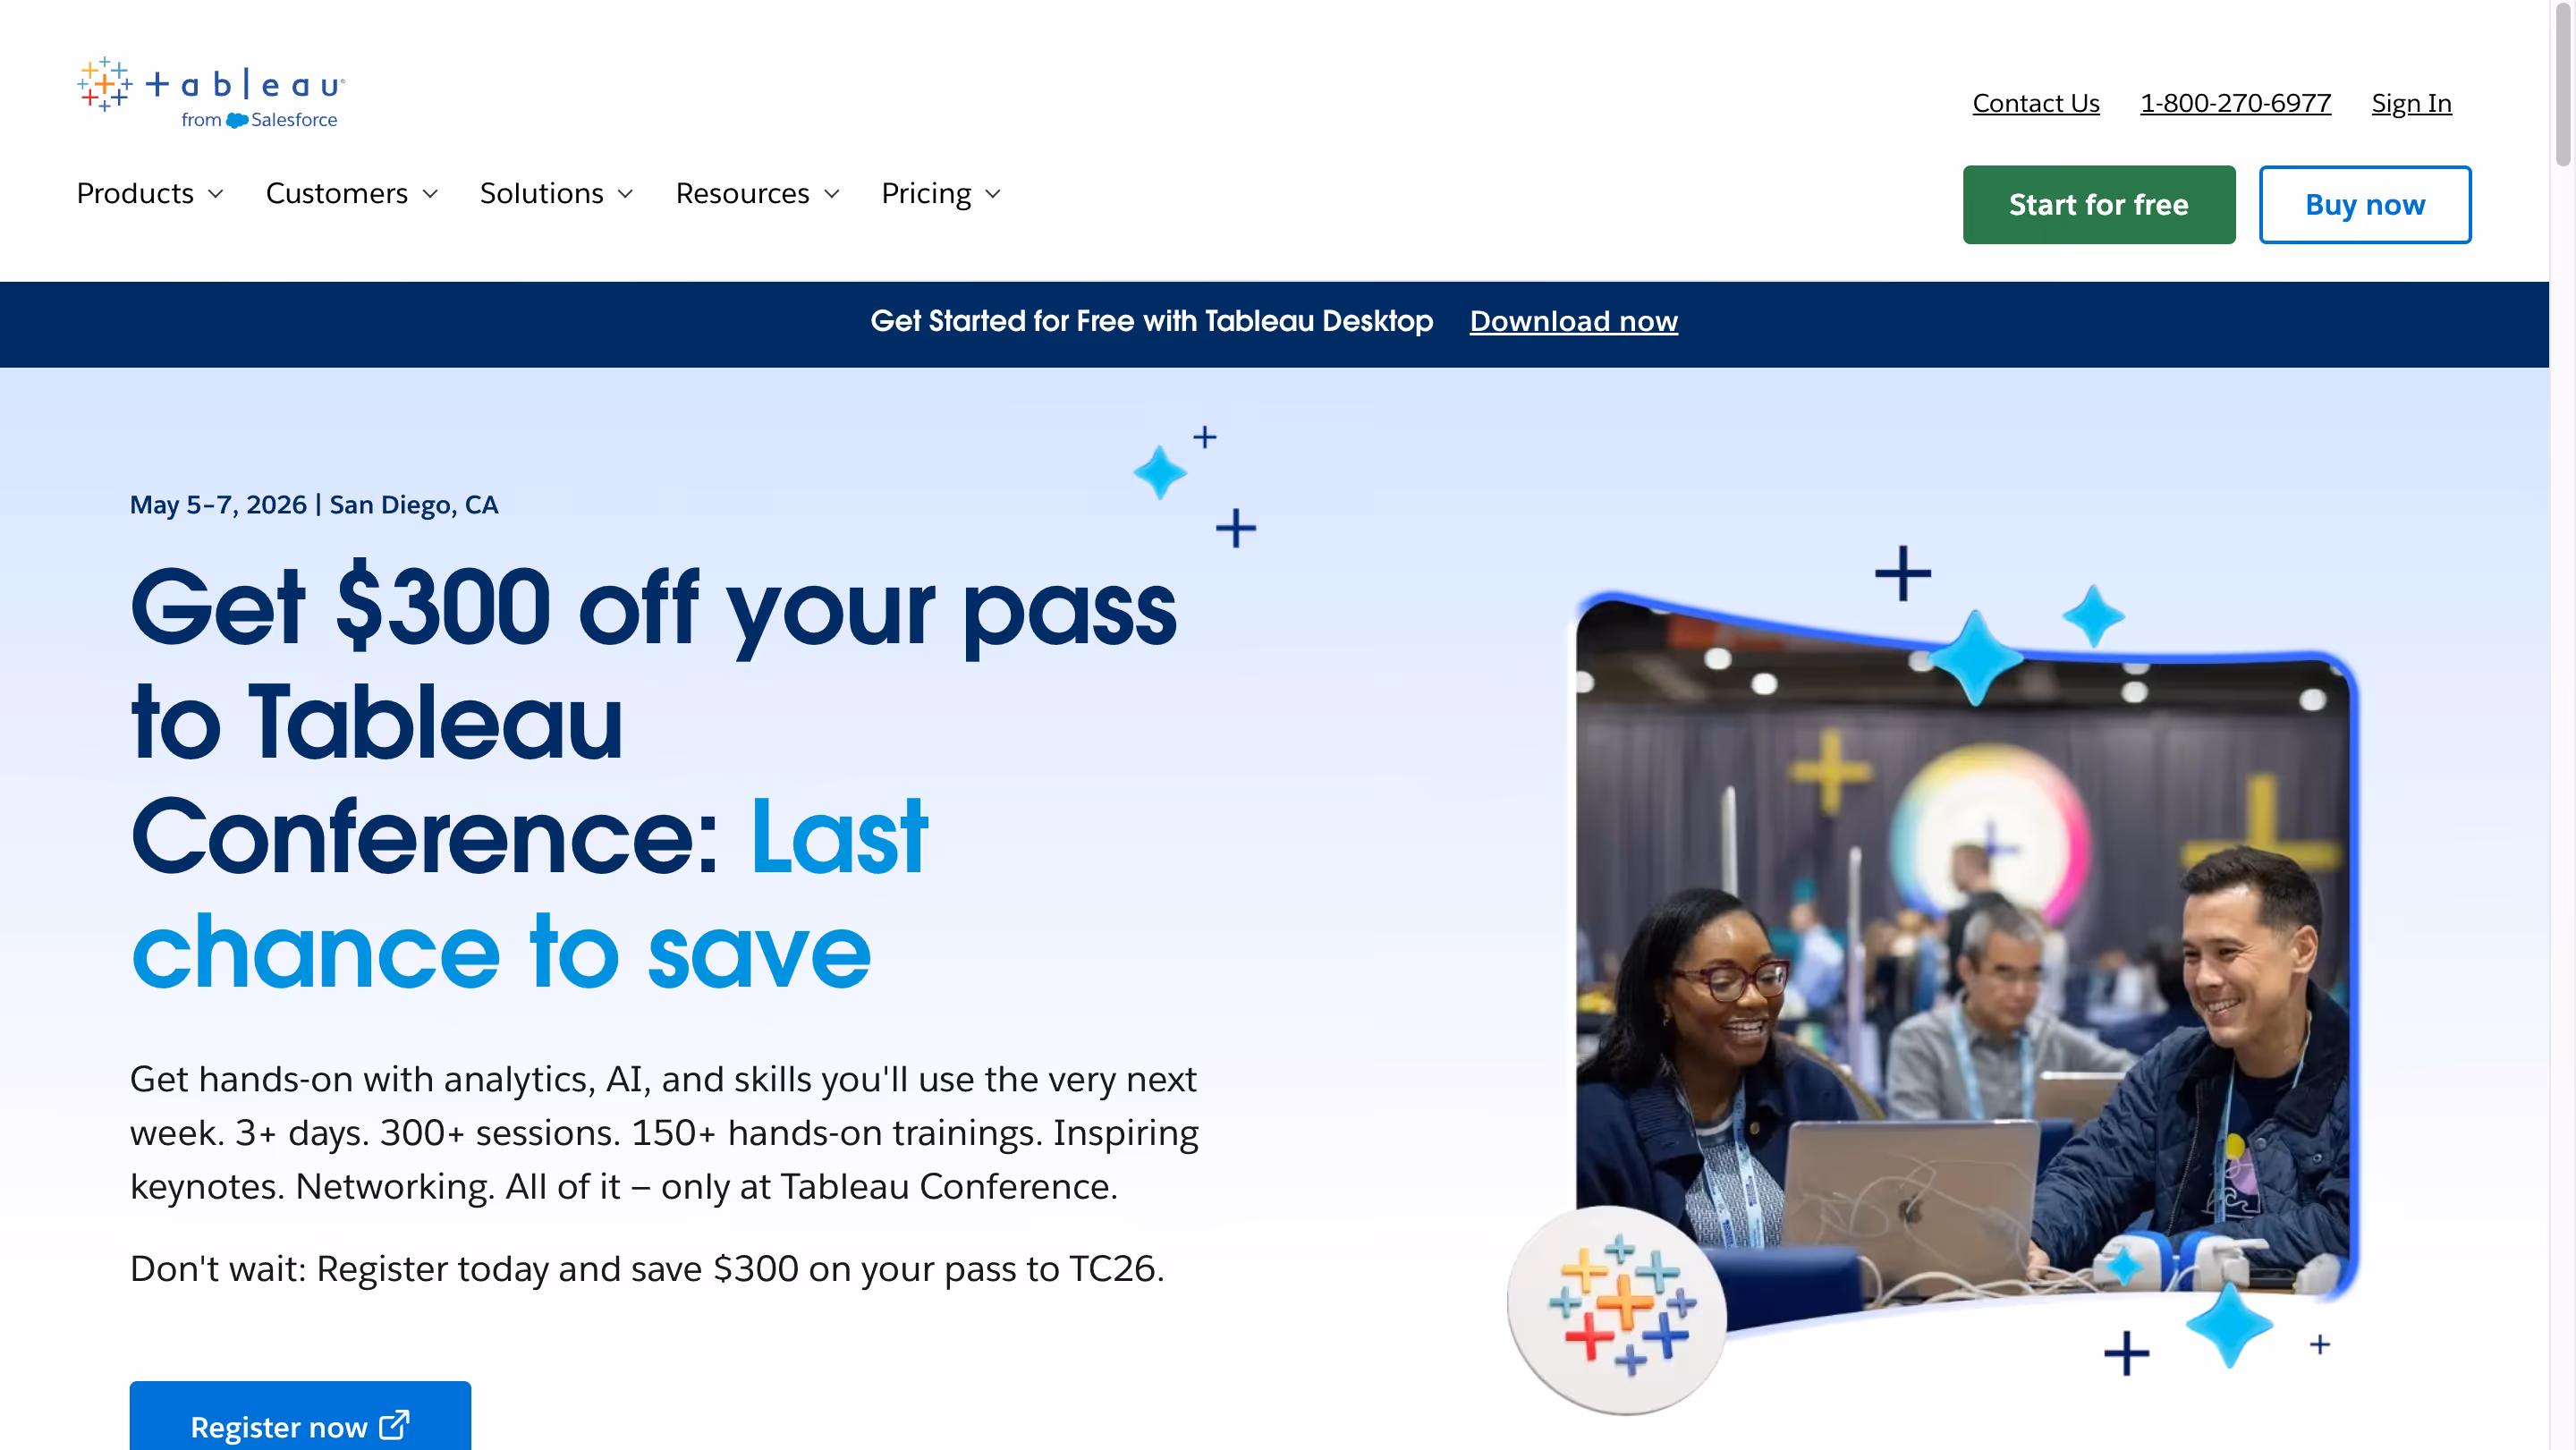
Acquired by Salesforce in 2019 and now repositioned as "the world's first agentic analytics platform" via Tableau Next, Tableau sits at a different pole of the BI market than Power BI. It's built on Salesforce Hyperforce, powered by Data 360 as the unified data layer, and natively integrated with Agentforce AI agents. The legacy visualization reputation still sets the industry benchmark — Tableau dashboards are what other BI tools are compared to when visual polish matters.
Why Tableau?
- Industry-leading visualization quality. Tableau remains the benchmark for visual polish — custom chart types, design flexibility, and dashboard aesthetics that other BI tools still struggle to match. For presentation-ready analytics, executive reporting, or any use case where the dashboard itself is the product, Tableau produces visuals Power BI's templated approach can't replicate. Advanced data visualization and data storytelling are where Tableau has always been strongest.
- Cross-platform authoring (including Mac). Tableau Desktop runs natively on both Windows and macOS — a structural advantage over Power BI Desktop's Windows-only limitation. For design agencies, consulting firms, creative industries, and any organization with significant Mac users, this removes an entire category of workflow friction. No virtual machines, no Parallels, no second-class web experience.
- Massive community and DataFam ecosystem. Tableau Public hosts thousands of community-shared dashboards, and the DataFam provides the largest active BI community globally. For organizations hiring BI talent, Tableau expertise is more abundant than DAX expertise at comparable cost — a talent-market advantage Power BI hasn't matched despite its scale.
Tableau's Edge Over Power BI
Tableau's advantage over Power BI is visualization depth and platform independence. Where Power BI's charts are functional but templated, Tableau produces genuinely custom visualizations that analysts can craft into polished, executive-ready artifacts. For organizations where dashboard quality drives adoption — marketing analytics, client reporting, executive briefings — Tableau's output quality justifies the licensing premium.
Tableau also sidesteps Power BI's structural constraints. Tableau Desktop runs on macOS; Power BI Desktop does not. Tableau sits neutrally on top of any cloud warehouse; Power BI's architecture increasingly assumes Azure and Fabric. For Mac-first organizations, creative industries, and multi-cloud enterprises, Tableau is often the only enterprise BI platform that fits their operating environment. Tableau Next's agentic analytics push — Agentforce Tableau, Concierge, Tableau Semantics — also directly counters the Copilot AI narrative for organizations outside the Salesforce ecosystem.
The risk to Power BI is specific: the buyer who needed the $14/user sticker price gravitates back to Power BI, but the buyer who actually needs visualization depth or non-Windows authoring chooses Tableau regardless of the licensing premium.
What Users Are Saying
Tableau reviews on G2 consistently praise the drag-and-drop simplicity, the quality of interactive dashboards, and the breadth of integrations with multiple data sources. The common tradeoffs cited are pricing at scale and the complexity of advanced calculated fields — themes that show up across thousands of reviews.
"A few things I especially like: Drag-and-drop simplicity – You can build dashboards just by dragging fields, which makes it very accessible even if you're not a programmer. Powerful visualizations – It creates clean, professional charts that help decision-makers quickly understand trends and patterns. Interactive dashboards – Users can filter, drill down, and explore data in real time."
Chaitu P. — Business Analyst [VERIFY: specific G2 review permalink]
"I find complex calculations to be tricky. Basic calculations are easy, but advanced table calculations are difficult to express. Tableau can be expensive, especially for small teams and individual users. Advanced calculations and customization sometimes require a steep learning curve."
Sivakumar N. — Tableau reviewer [VERIFY: specific G2 review permalink]
"Tableau is the best tool to make the graphical representation of daily tasks and also know the trend of the tasks. The selection tools need to be developed for ease of access."
Manideep V. — Project Manager [VERIFY: specific G2 review permalink]
Pricing
Creator seats run $75/user/month billed annually, with Explorer at $42/user/month and Viewer at $15/user/month. Enterprise Creator licensing runs up to $115/user/month, and Tableau+ (which includes Tableau Next and Agentforce Tableau capabilities) is licensed separately. Gotcha: every deployment needs at least one Creator license, viewers still require paid seats, and there's no free-viewer tier comparable to Microsoft 365 E5's Power BI bundling.
Tableau Is Best For
Tableau is best for organizations with trained analyst teams prioritizing visualization depth, cross-platform authoring (including Mac), and dashboard polish — particularly creative industries, consulting firms, design agencies, and companies where dashboard aesthetics drive stakeholder adoption.
Watch Out For
Tableau's per-user pricing is significantly higher than Power BI's, 60–80% of analyst time still gets spent on data preparation outside Tableau, and the post-Salesforce Tableau Next pivot is aligning the roadmap with Salesforce ecosystems in ways that may not serve non-Salesforce customers over time.
3. Sigma Computing — Best for spreadsheet-native analysts on cloud data warehouses
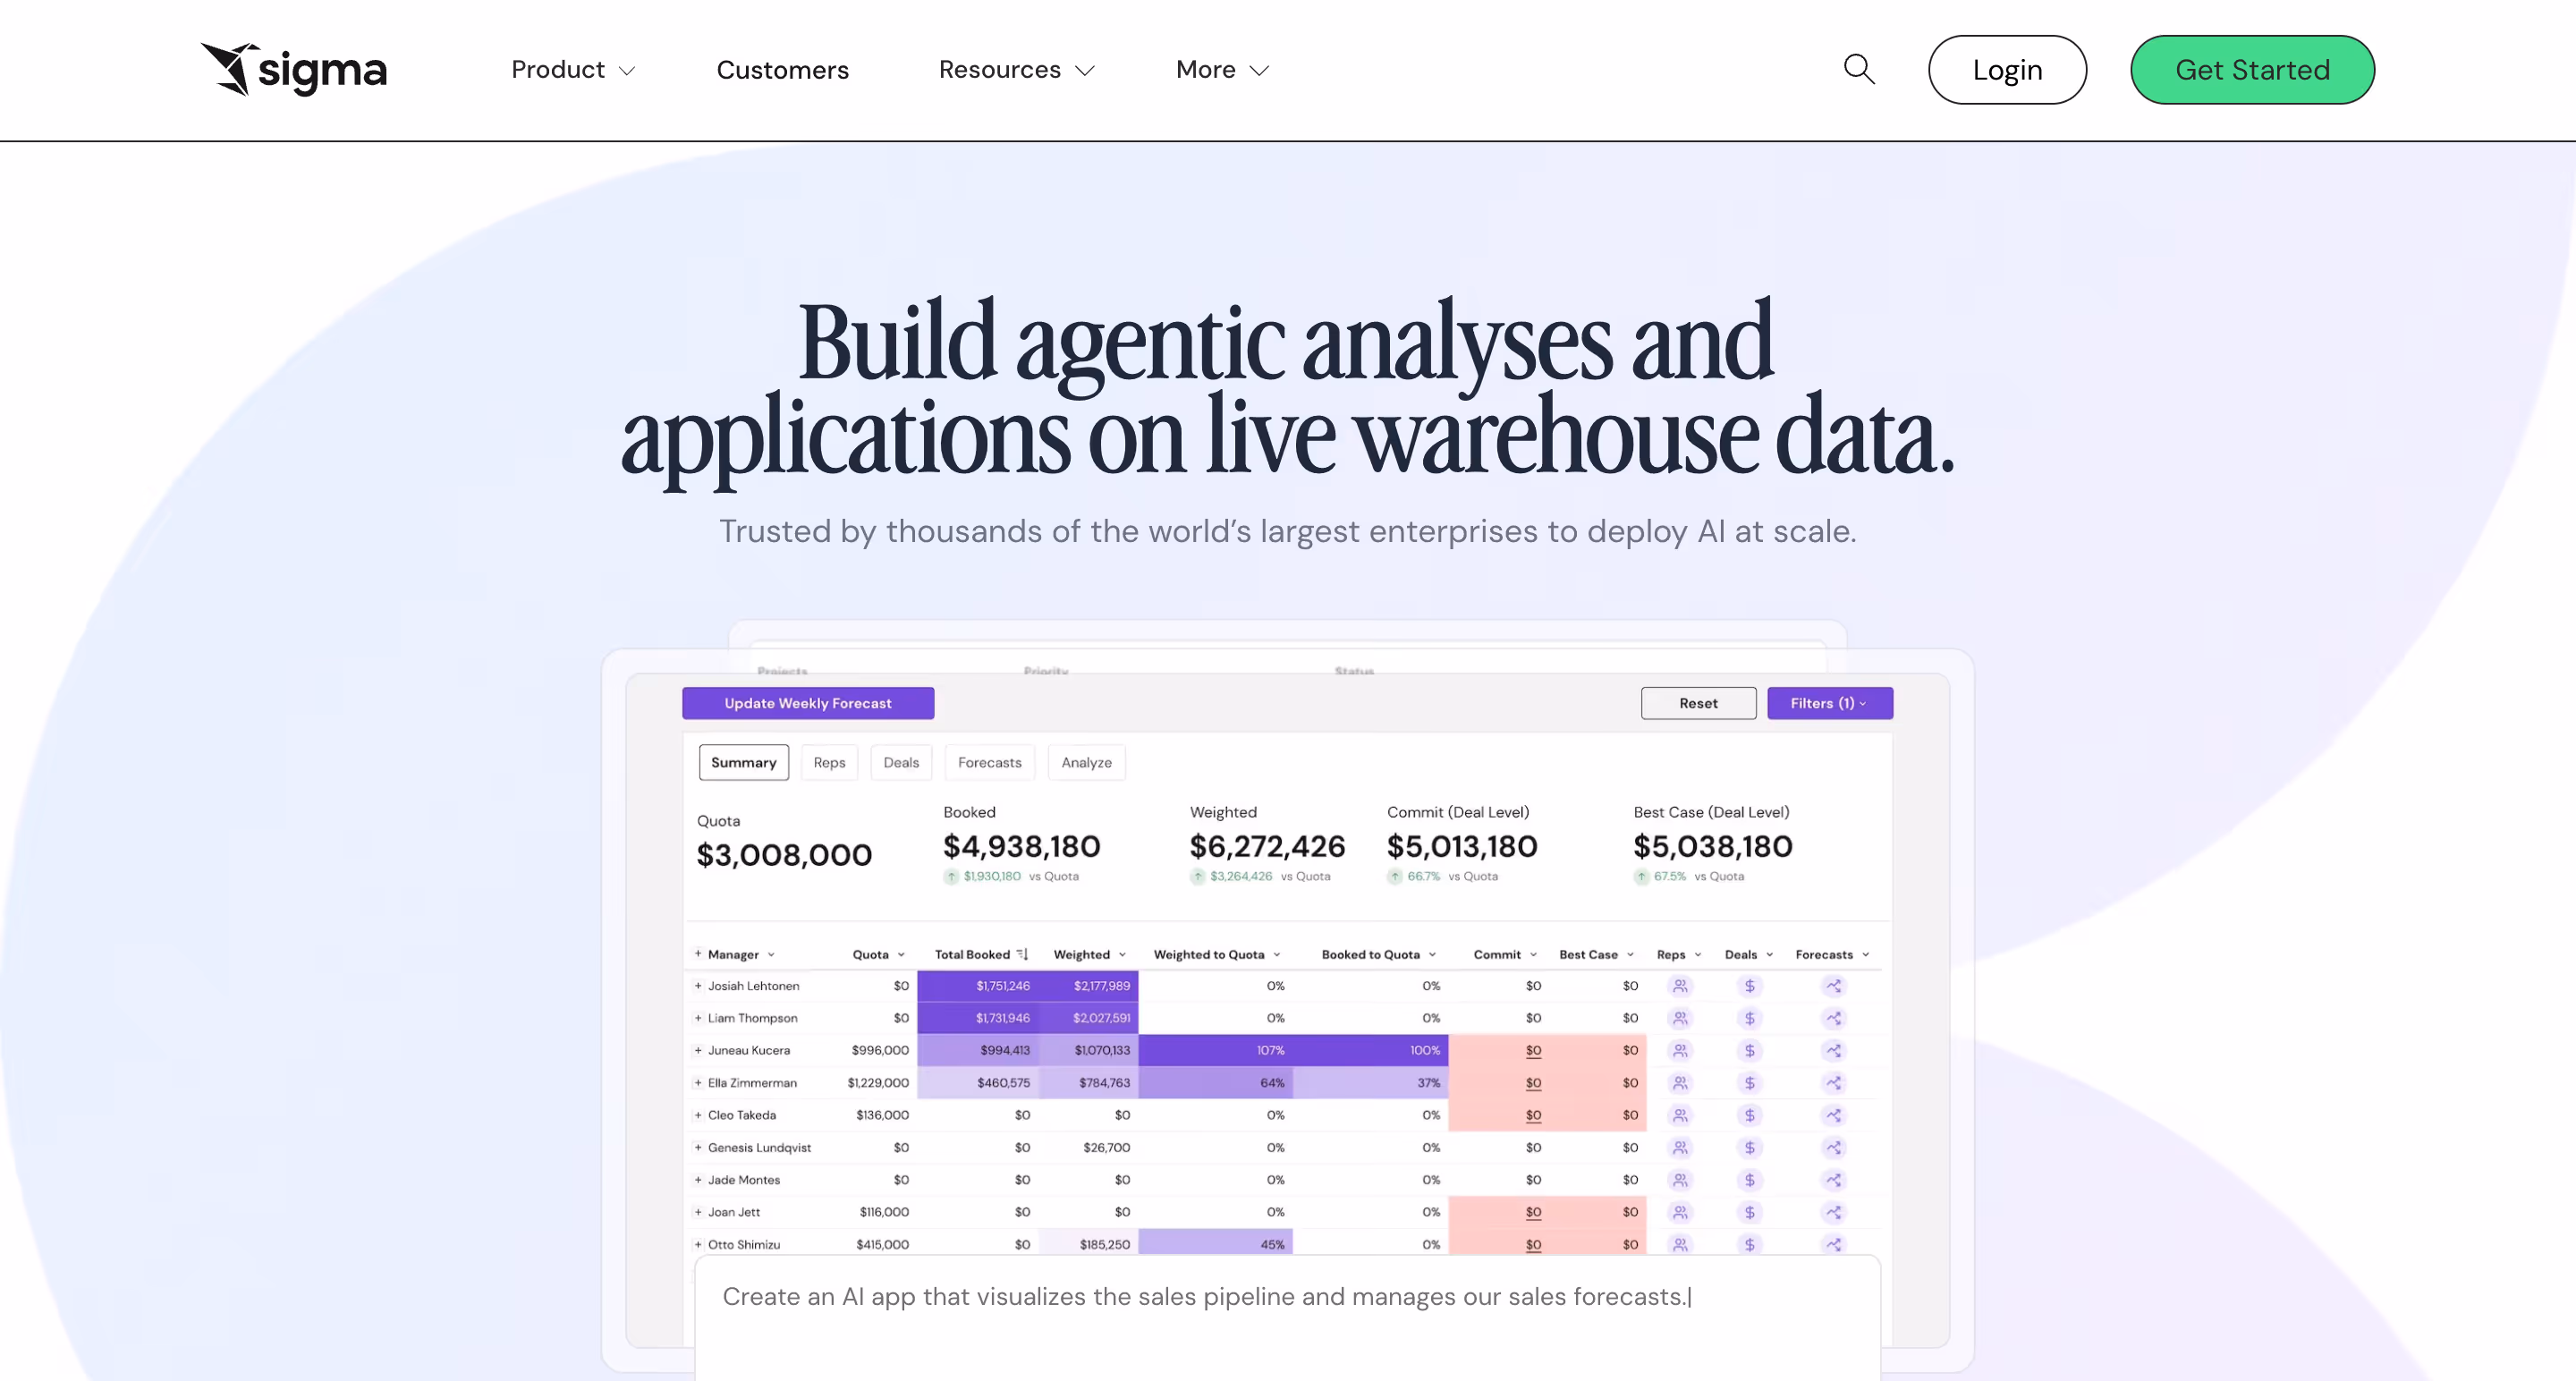
The pitch behind Sigma Computing is almost embarrassingly simple: give business analysts the spreadsheet interface they already know, put it on top of live cloud warehouse data, and skip SQL entirely. Sigma's formulas are Excel-exact syntax — not Excel-adjacent like DAX, actually Excel. That distinction is the reason Sigma has grown fastest in finance, operations, and retail teams whose default tool has always been a spreadsheet.
Why Sigma?
- Excel-style formulas on live warehouse data. Sigma's core differentiator is the spreadsheet UI that auto-generates SQL against Snowflake, BigQuery, Databricks, and Redshift. Business users who know Excel can analyze billion-row datasets without writing code or learning DAX — a direct counter to Power BI's DAX specialist bottleneck. Non-technical users can explore data at a scale that used to require coding expertise.
- Input tables enable native writeback. Users can edit data directly in dashboards via input tables, with changes syncing back to the warehouse. This is a capability Power BI doesn't match natively — writeback in Power BI requires Power Apps integration or third-party extensions, which add complexity and cost Power BI's "simple" pitch doesn't mention.
- Strong embedded analytics with full white-labeling. Sigma's embedded BI offering includes full white-label customization, multi-tenant architecture, and usage-based pricing for high-volume scenarios — directly addressing the per-user cost problem that makes Power BI Embedded economically painful for customer-facing SaaS analytics at scale.
Sigma's Edge Over Power BI
Sigma wins the exact buyer Power BI targets but doesn't fully serve — the business analyst whose default tool is Excel and whose learning ceiling is "I'll learn a formula language, but it has to actually be Excel." Power BI Desktop promises Excel-adjacency but delivers DAX and Power Query M, two languages that look familiar but work nothing like Excel. Sigma's formula syntax is Excel-exact; there's no gap between what the analyst knows and what the tool expects.
The warehouse-native architecture is also a direct counter to Power BI's import-mode default. For organizations that have invested in Snowflake, BigQuery, or Databricks, Sigma keeps those investments as the source of truth — no data copying into Power BI's VertiPaq engine, no scheduled refresh management, no "which version of the data am I looking at?" question.
The risk to Power BI is in adoption velocity and warehouse economics. Evaluations where the deciding factor is "can our business users actually be productive without months of DAX training?" increasingly end with Sigma — especially for spreadsheet-heavy domains like finance, operations, retail, and RevOps where Power BI's DAX learning curve becomes a blocker.
What Users Are Saying
Sigma users consistently highlight the spreadsheet familiarity, the speed of connecting to Snowflake, and the ability for non-technical users to build analytics without SQL. Performance on very large or complex workbooks is the most frequently cited tradeoff.
“I like that it’s very easy to integrate, whether you use iframes or the SDK, and that you don’t have to code everything from scratch—you can simply bring the power of Sigma into your application.”
Ibrahim A. — Analytics Engineer
“The dashboard/site could use with some personality and flair. The drab black/white can be somewhat monotonous. Offering classes/tutorials for how to find certain data sets, and analyze your results would be a huge bonus.”
John B. — Area Manager
Pricing
Sigma's Essentials tier starts at $300/month base with unlimited viewers, while Pro and Enterprise tiers are custom-priced by user licenses, features, and embedded deployment. Third-party data from Vendr shows typical annual contracts range from $15,000 to $250,000+. Gotcha: live queries push compute costs to your warehouse — Snowflake or BigQuery bills can spike under heavy usage, a cost that Power BI's import-mode architecture avoids at the cost of data duplication.
Sigma Computing Is Best For
Sigma Computing is best for teams with a pristine cloud data warehouse (Snowflake, BigQuery, Databricks) and business users who live in spreadsheets — particularly finance, operations, and retail analytics teams that need Excel-native self service analytics without Power BI's DAX learning curve or data-import model.
Watch Out For
Sigma requires a cloud data warehouse to function (there's no on-premises option), live queries can inflate warehouse compute bills under heavy load, and the platform's recent "AI Apps Platform" pivot has created ambiguity about whether Sigma is a BI tool, an app builder, or an analytics platform — worth clarifying in any evaluation.
4. ThoughtSpot — Best for AI-first natural-language analytics without Fabric capacity requirements

Founded in 2012 around a single contrarian idea — that BI should work like Google search instead of like Excel — ThoughtSpot has spent the last decade betting the company on natural language search. That bet paid off in the current AI wave. Spotter 3, the current generation of ThoughtSpot's AI agent, is arguably the most production-mature agentic analytics in the market in 2026, and it ships at per-user pricing rather than behind a capacity tier.
Why ThoughtSpot?
- Spotter 3 AI Agent with patented search. Users type business questions in plain English and Spotter AI translates them into optimized SQL against live warehouse data. Spotter 3 handles multi-step analysis, pulls context from external tools like Slack and Confluence via MCP, and uses human-in-the-loop governance so users can approve or refine AI-generated answers. Where Power BI's Copilot requires Fabric F64+ capacity (~$5,258/month), Spotter AI is the product at $25–$50/user/month.
- SpotIQ automated insights. Machine learning models automatically detect anomalies, trends, and patterns across your data, surfacing questions users didn't think to ask. This is proactive anomaly detection — different from Power BI's "build a dashboard to track this KPI" model — and has been shipping in production for years, long before agentic AI became a category.
- Warehouse-native live querying. ThoughtSpot connects directly to Snowflake, BigQuery, Databricks, Redshift, and Azure Synapse with live queries — no extracts, no data duplication. Performance scales with warehouse compute. The architecture is cleaner than Power BI's import-mode-as-default approach and maintains the warehouse as the single source of truth.
ThoughtSpot's Edge Over Power BI
ThoughtSpot's edge over Power BI is the AI narrative. Power BI's Copilot is a feature gated behind Fabric F64+ capacity — AI is something you pay extra for. ThoughtSpot's Spotter AI is the product itself. For the buyer evaluating "AI-powered BI" in 2026, ThoughtSpot has the more coherent, production-mature story, shipping agentic natural language search since before Power BI Copilot was generally available, and doing it at per-user pricing that doesn't require a $60K/year Fabric capacity commitment.
The architectural story also favors ThoughtSpot for warehouse-first organizations. Where Power BI's trajectory points toward deeper Fabric integration and OneLake dependency, ThoughtSpot stays cleanly on top of whichever warehouse you've already chosen — Snowflake, BigQuery, Databricks, Redshift. For non-Microsoft organizations, the alignment is natural.
The risk to Power BI is specific to AI-driven evaluations. Teams that would have defaulted to Power BI five years ago are increasingly evaluating ThoughtSpot because "AI-first BI" is the mandate, and ThoughtSpot has the more focused, more mature, more cost-transparent story in that lane.
What Users Are Saying
ThoughtSpot users consistently highlight the maturity of the AI features and the quality of Spotter's natural language queries. Common tradeoffs include access management complexity and visualization polish compared with dedicated visualization tools.
"I like the fact that ThoughtSpot has evolved impressively throughout our journey with it. Its introduction of GenAI tools like Spotter and Sage have revolutionized our manual searches and build visualizations. For example, I can simply ask plain-language questions about causes that have resulted in changes in data and get insightful answers along with visual explanations."
Maayan B. — Data Analyst
"Adding users to dashboards and granting access also feels unnecessarily drawn out. Users request access, it comes through via email, and when you click 'grant' it takes you to the dashboard—where you then have to remember the user's name and manually add them yourself. On top of that, if someone needs to use the dashboard filters, you're required to give them access to the underlying sources. Why? Overall, there are just too many steps."
Isabelle N. — Associate Data Engineer
"ThoughtSpot's auto-generated visuals often appear basic and can feel sluggish during in-depth analysis. The user interface can be tedious, making it less suitable for presentation-ready reports when compared to the pixel-perfect designs offered by competitors."
Verified User in Entertainment — G2 review
Pricing
Essentials starts at $25/user/month (up to 25M rows, 5–50 users, billed annually). Pro runs $50/user/month and includes Spotter AI with a cap of 25 queries per user per month, scaling up to 250M rows. Enterprise is custom, and embedded plans are priced separately. Third-party data from Toucan suggests average annual contracts land around $140,000 [VERIFY]. Gotcha: Spotter Pro's 25-queries-per-user-per-month cap creates overage costs for heavy AI users, so model against expected usage patterns before committing.
ThoughtSpot Is Best For
ThoughtSpot is best for organizations where the primary goal is letting non-technical users ask ad-hoc questions against existing data — particularly teams that want production-mature agentic AI without Power BI's Fabric capacity dependency, and that have the data modeling discipline to make natural language search accurate.
Watch Out For
ThoughtSpot requires significant upfront data modeling for natural language search to work accurately, visualization customization lags Power BI's chart flexibility, and consumption-based pricing can create unpredictable costs at scale — particularly for embedded deployments with high query volumes.
5. Looker (Google Cloud) — Best for Google Cloud and BigQuery teams needing governed metric modeling
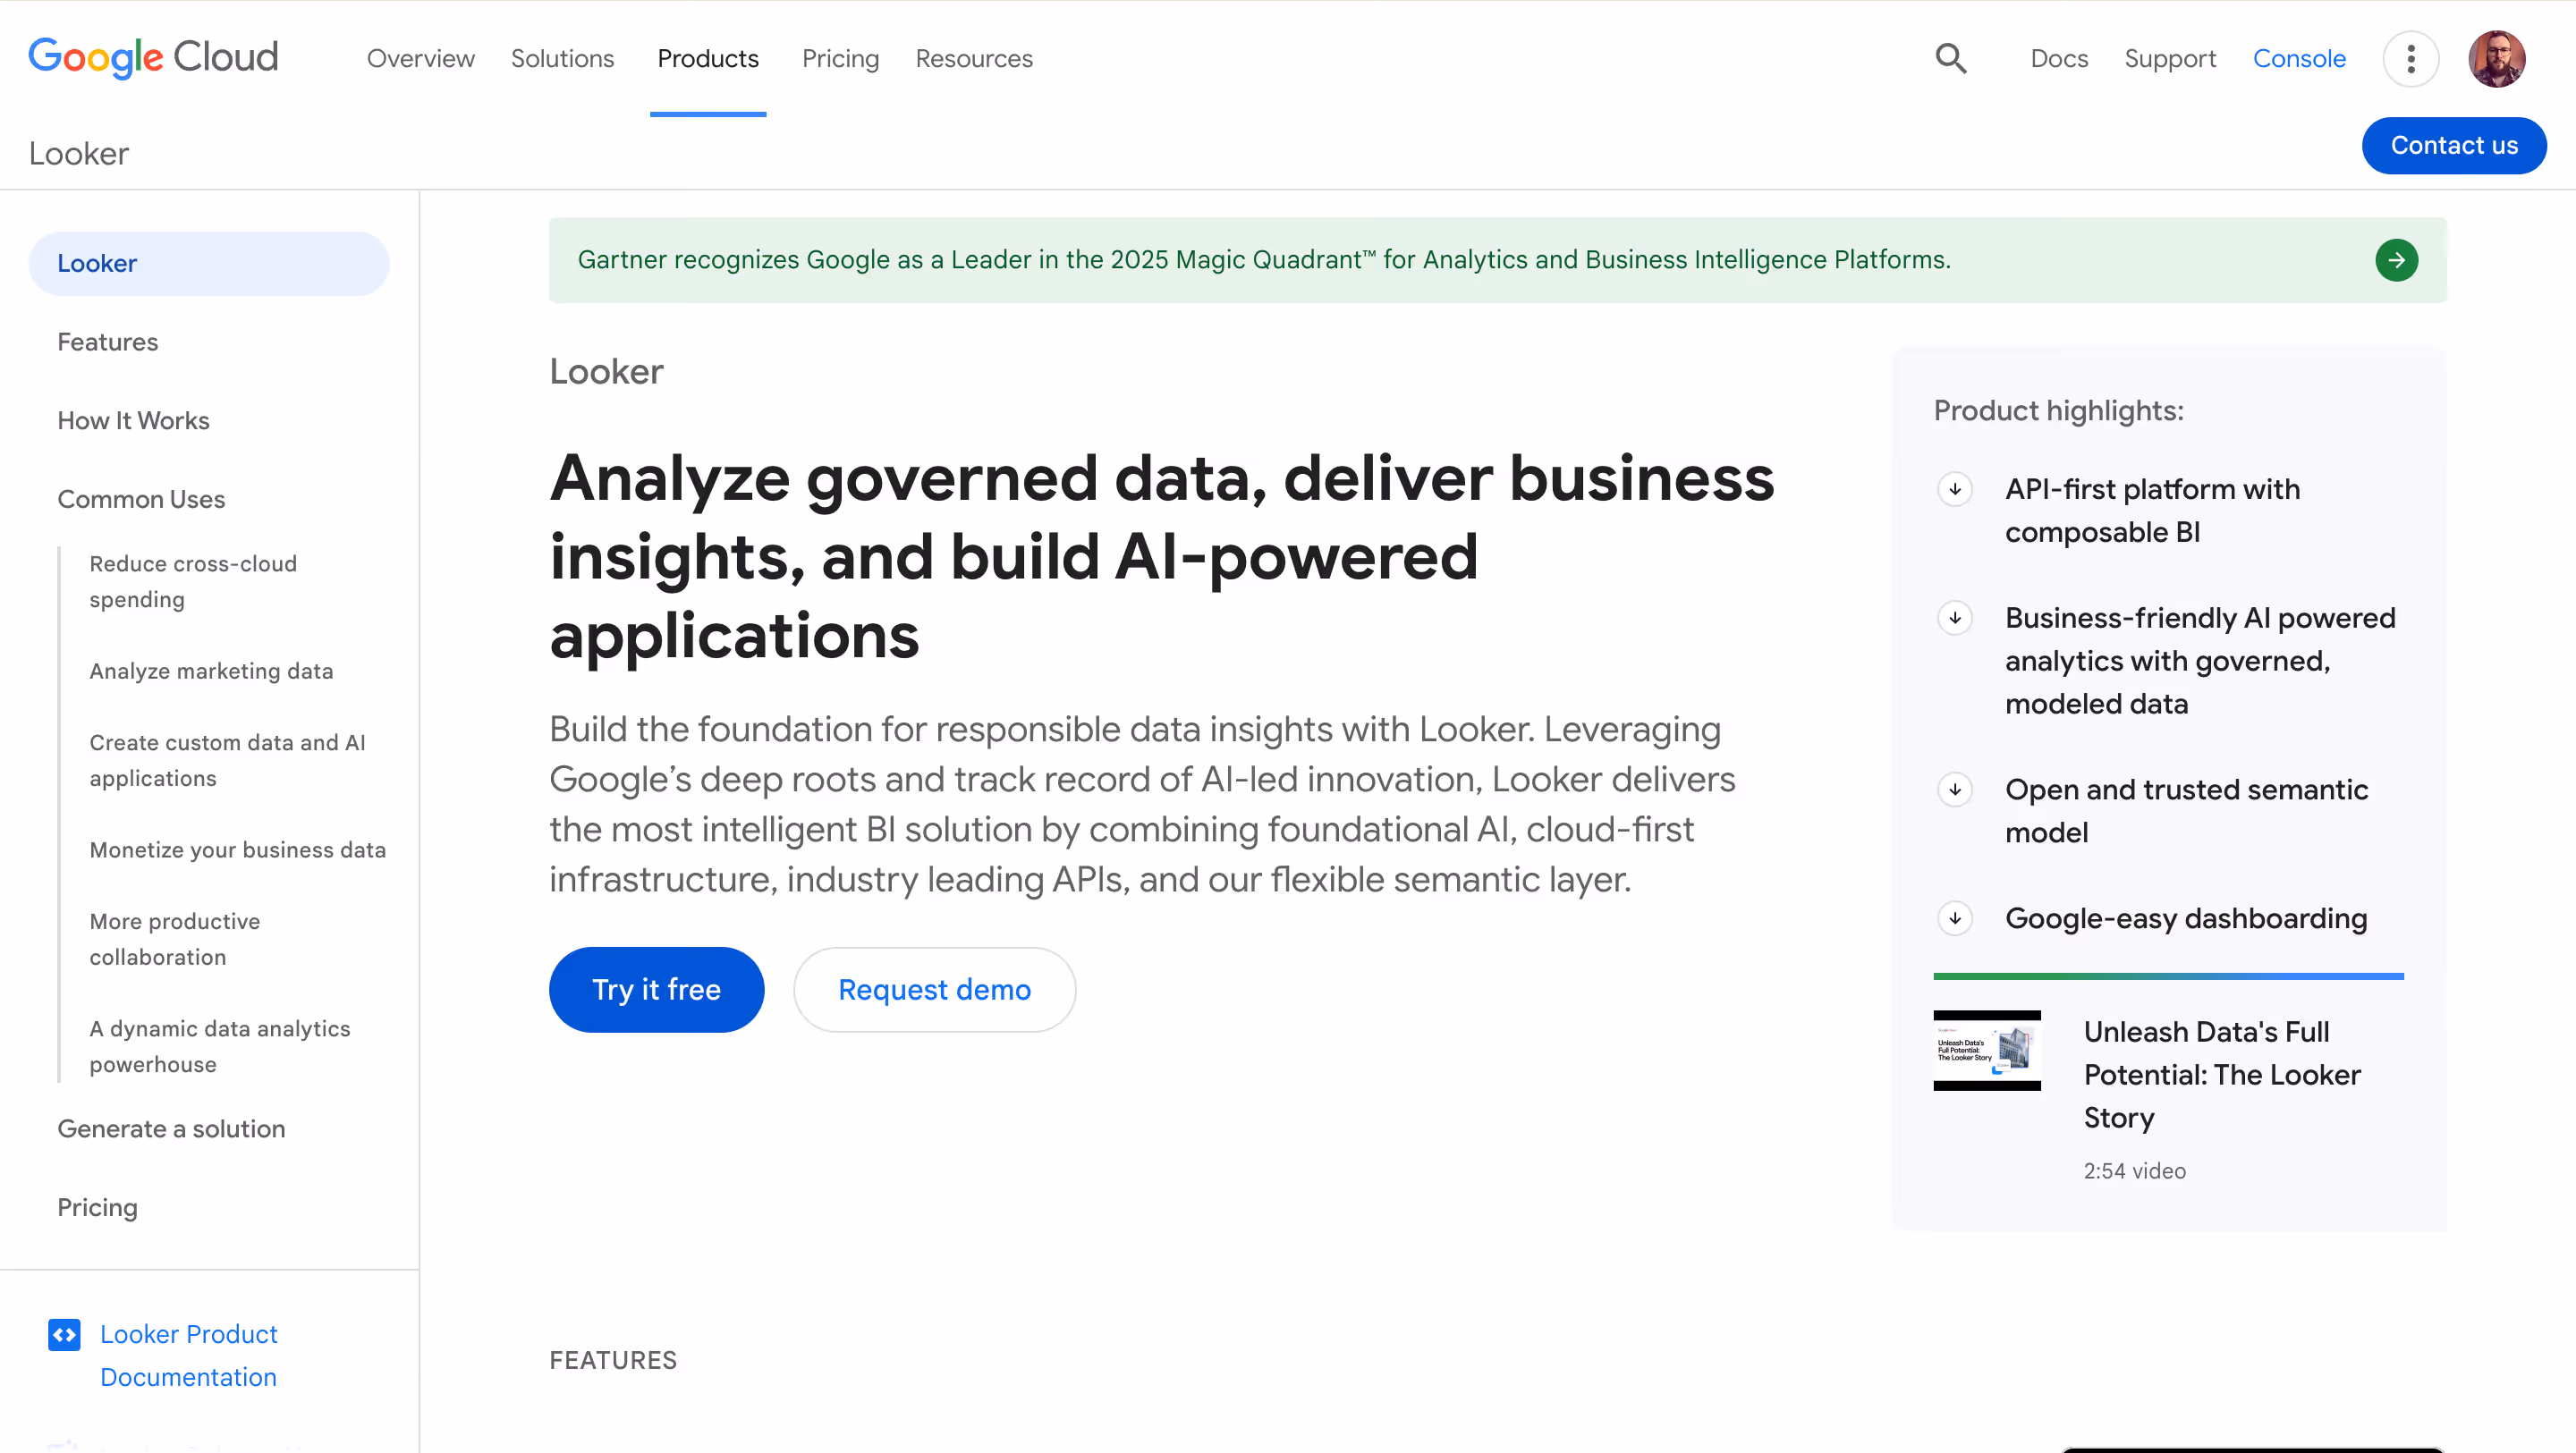
Acquired by Google in 2020, Looker now operates as Google Cloud's enterprise business intelligence platform. It's built around LookML — a proprietary modeling language that creates a centralized semantic layer — and delivers conversational analytics via Gemini AI. Looker's governance-first architecture is what separates it from Power BI: where Power BI treats DAX as the modeling layer and metric consistency as a downstream outcome, Looker inverts that relationship and defines metrics in code first.
Why Looker?
- LookML semantic layer for metric governance. LookML is the gold standard for metric consistency. Define metrics, data relationships, and business logic once in code, then reuse them across every dashboard and report. For organizations where "which revenue number is correct?" is a recurring problem, LookML's enforced consistency solves what Power BI's DAX-calculated-fields-sprawl doesn't — at the cost of requiring a specialist analytics engineering function.
- In-database architecture against BigQuery. Looker queries BigQuery and other supported warehouses directly — no extracts, no import mode, always current data. For BigQuery-first organizations, the native integration is deeper than Power BI's generic warehouse connectors, and avoids the data duplication Power BI's default import mode creates.
- Gemini in Looker for AI-powered BI. Conversational Analytics, LookML Assistant, Formula Assistant, and Visualization Assistant are all grounded in Looker's semantic model. For Google Cloud customers, this is the natural AI-BI path — built on the same Gemini models that power the rest of their GCP stack, without a separate Fabric capacity requirement.
Looker's Edge Over Power BI
Looker's edge over Power BI is governance depth and cloud alignment. Where Power BI treats DAX as the modeling layer and metric consistency as a downstream outcome, Looker inverts that — LookML defines consistent metrics in code first, visualizations flow from them. For data-mature organizations with recurring "which number is correct?" problems, this architectural difference is decisive.
The Google Cloud ecosystem alignment is also a direct counter to Power BI's Microsoft gravity. The same way Microsoft shops default to Power BI, GCP shops increasingly default to Looker — LookML governance, Gemini AI, native BigQuery optimization. For organizations where "we already use Google Cloud for everything else" is the operating reality, Looker is the first-party choice and Power BI becomes the outside vendor.
The risk to Power BI is ecosystem-specific. Power BI dominates Microsoft environments, but for Google Cloud organizations, Looker has the cloud-vendor alignment advantage that makes Power BI a harder sell. Combined with LookML's governance story for data-mature enterprises, Looker captures the exact buyer segment Power BI struggles with: GCP-native, governance-first, analytics-engineering-led teams.
What Users Are Saying
Looker reviews consistently highlight the flexibility of visual exploration and the strength of the LookML semantic layer for governance. The most common tradeoff cited is the LookML learning curve — powerful for analytics engineers, abstract for business users.
What users are saying on G2
“What I like most about Looker is how flexible it feels once you’re inside a dashboard. Creating charts, applying filters, and adjusting dimensions happens visually, which makes experimentation easy. I can quickly compare metrics like sales, quantity, and cost without rebuilding reports from scratch.”
Priyanka T. — Software Engineer
"While self-service aspect is strong onboarding non-technical users still required training: concepts like 'views', 'explores', 'joins' are slightly abstract and some stakeholders got frustrated with what does this drop-down actually mean, moments."
Avyan S. — Software Developer
"While Looker is powerful, its reliance on LookML can have a steep learning curve for new users, especially those without a technical background. Customizing complex dashboards sometimes requires developer support, which can slow down quick changes."
Karthik K. — Application Engineer
Pricing
Looker uses custom enterprise pricing — you have to contact sales. Third-party data from Vendr, Holistics, and Toucan indicates starting costs of $35,000–$60,000/year for small deployments [VERIFY], scaling well into six figures for enterprise. Viewer, Standard, and Developer user types range roughly $30 to $125/user/month, with Viewer licenses cited at around $400/year [VERIFY]. Gotcha: Looker does not publish pricing publicly, so expect negotiated enterprise contracts with real variance by account.
Looker Is Best For
Looker is best for organizations standardized on Google Cloud and BigQuery with dedicated analytics engineering resources that prioritize centralized metric governance and LookML-based semantic modeling — and for Power BI buyers considering migration driven by governance depth or GCP alignment.
Watch Out For
Looker's LookML learning curve rivals Power BI's DAX in complexity and requires a specialist analytics engineering function, viewer licensing around $400/year makes embedded BI economically unfeasible for most customer-facing SaaS scenarios, and Google Cloud dependency deepens with every Gemini-in-Looker release.
6. Qlik Sense — Best for enterprises needing associative exploration and deployment flexibility
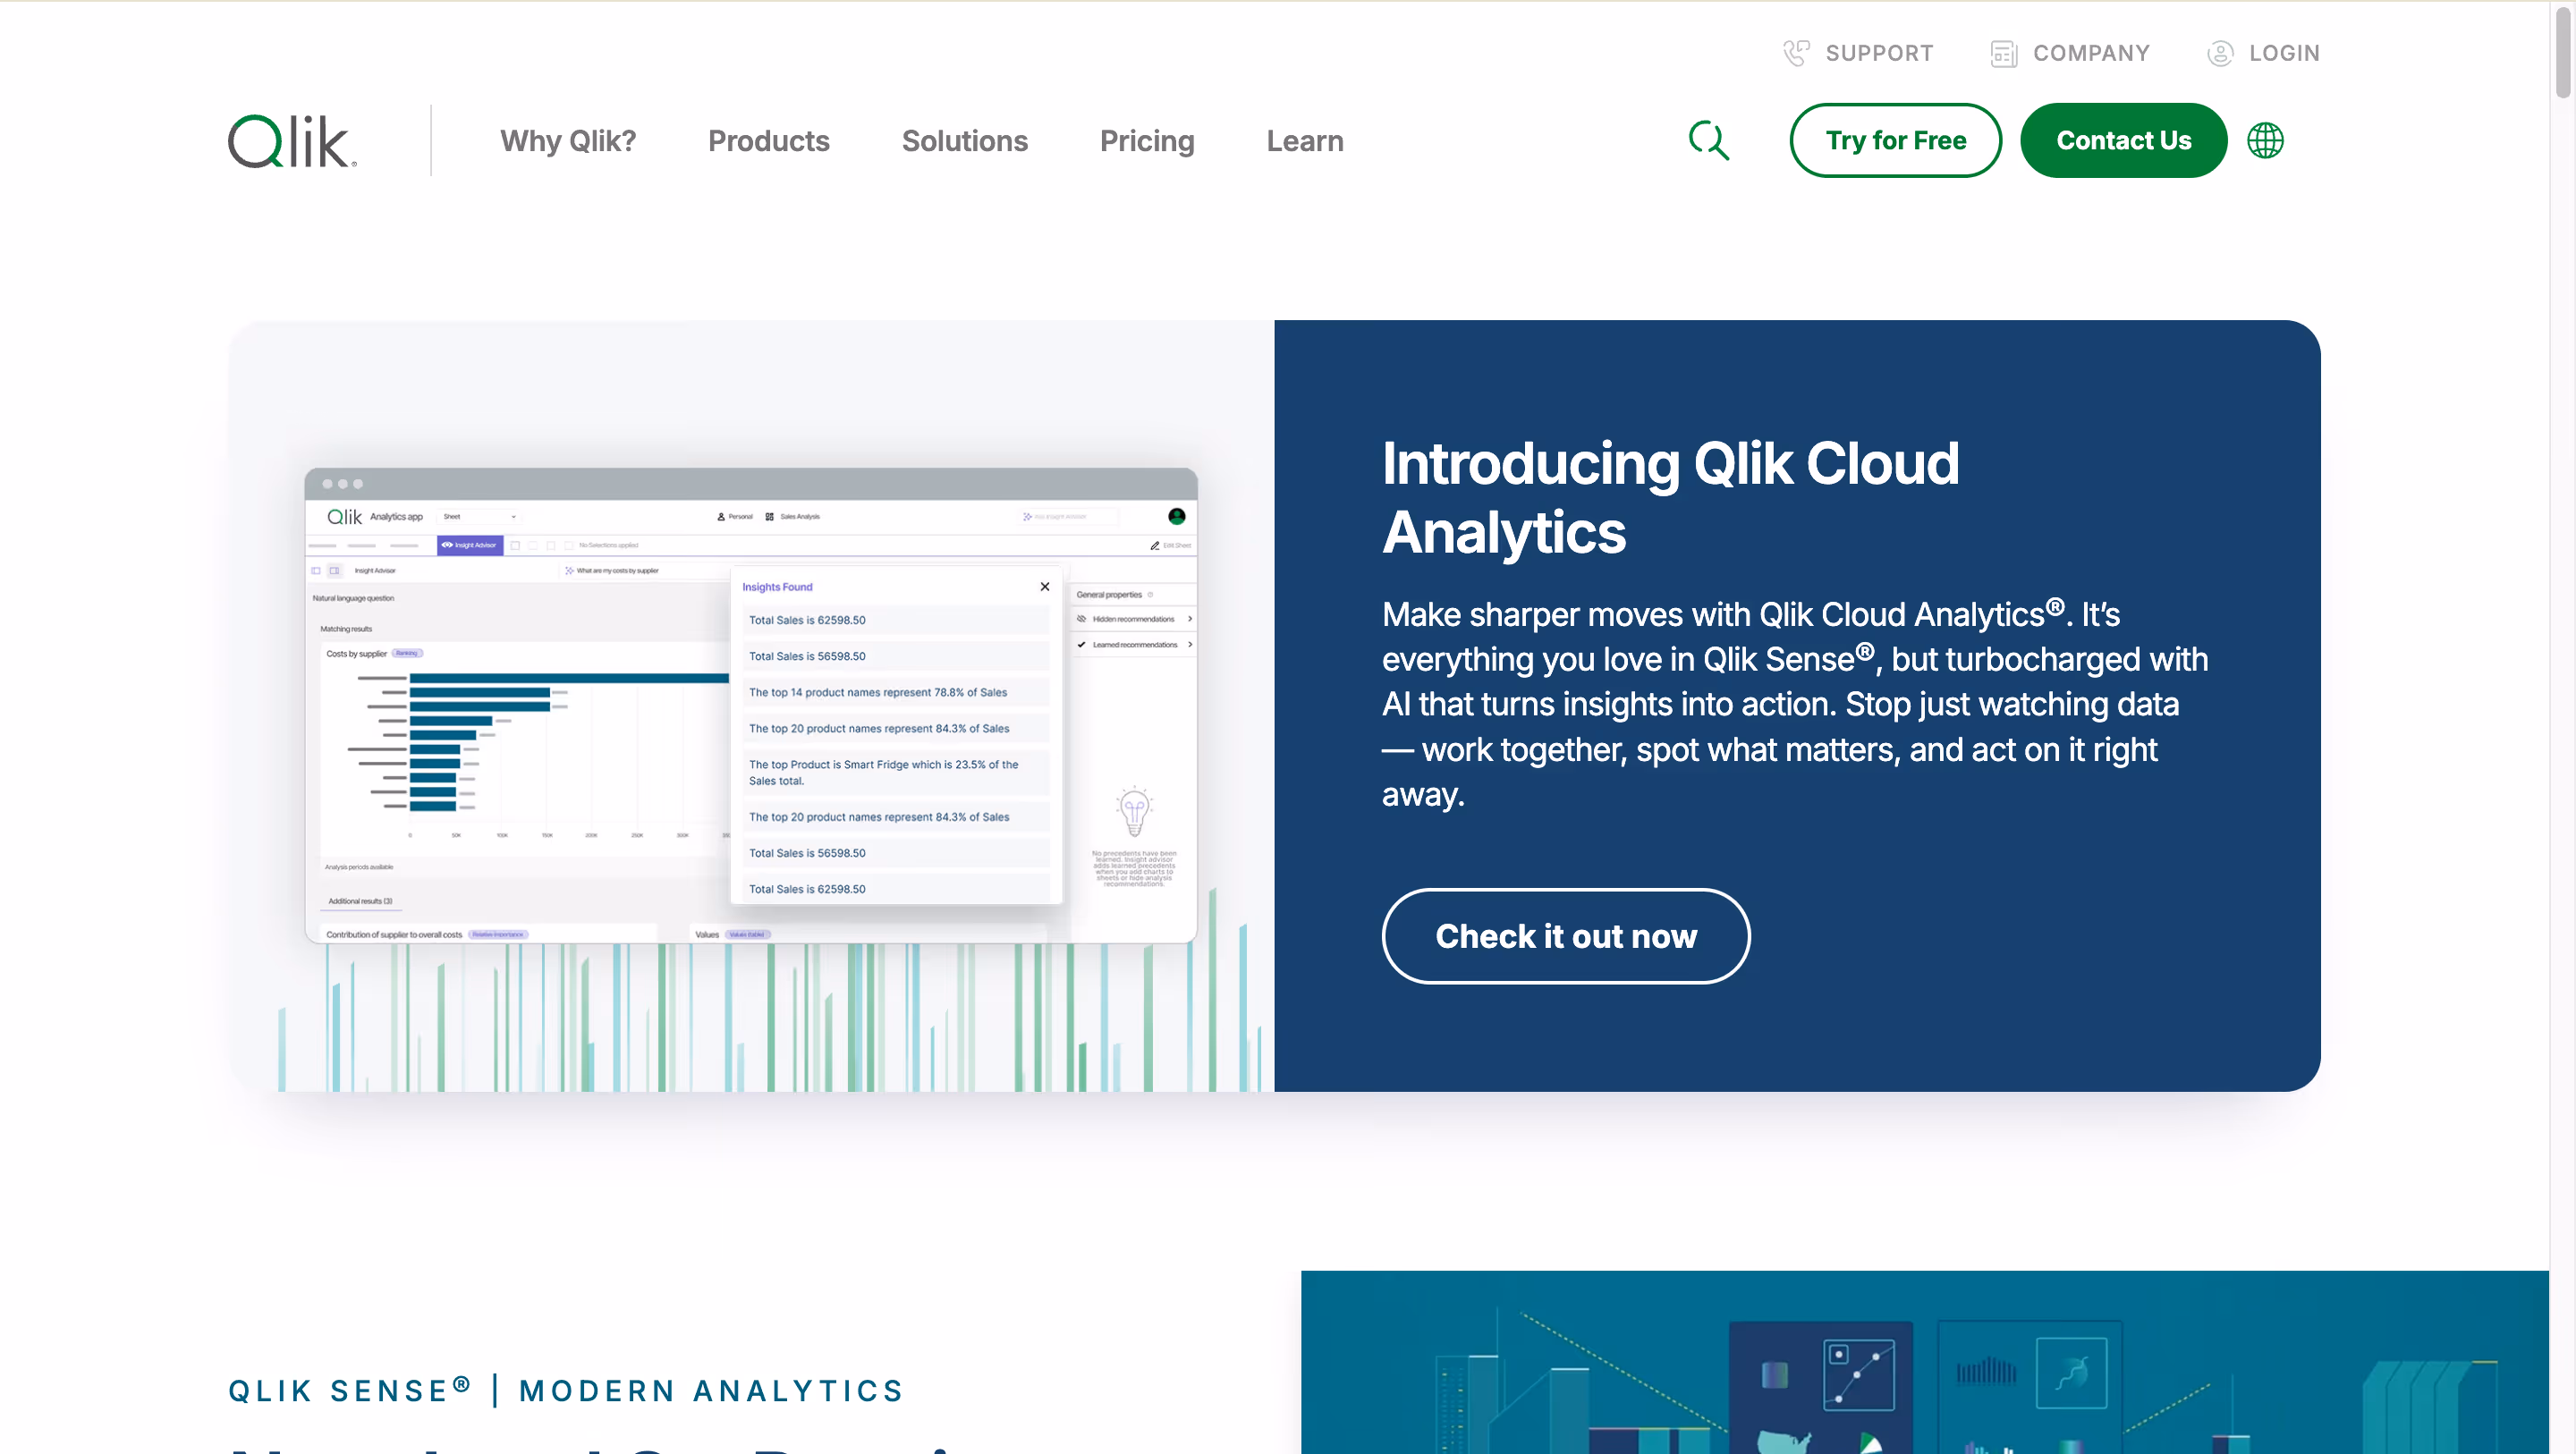
Qlik Sense is the enterprise BI platform built around a unique associative engine that indexes all data relationships at load time — letting users click any data point and instantly see what's related and, critically, what's not. That's a different exploration model than query-based tools like Power BI, which only answer the questions analysts thought to ask. Combined with deployment flexibility Power BI Report Server has never fully matched, Qlik remains the most distinctive architectural alternative on this list for large enterprise accounts.
Why Qlik Sense?
- Associative engine for free-form exploration. Qlik's associative analytics engine indexes relationships across your entire data model at load time. Click any data point and Qlik instantly shows what's related and, more importantly, what's not — revealing insights query-based tools miss because query-based tools only see what the analyst thought to ask. For complex multi-source exploration, this is a genuinely differentiated architecture for analyzing data across multiple data sources.
- Multi-cloud and on-premises deployment flexibility. Qlik Sense deploys on SaaS (Qlik Cloud), on-premises (Client-Managed Qlik Sense), or hybrid. Power BI Report Server exists but lacks full feature parity with the cloud version, creating real gaps for regulated industries needing on-premises functionality. Qlik's on-premises option maintains feature parity with the cloud edition — a material advantage for healthcare, financial services, and government buyers.
- End-to-end data pipeline capability. Qlik Sense handles data integration, data preparation, and visualization from multiple data sources in one platform. Qlik Automate adds no-code workflow automation. Qlik Answers (post-Kyndi acquisition) adds AI over unstructured data. This is a broader platform story than Power BI's visualization-first scope — closer to what Microsoft Fabric offers, but without the Microsoft-ecosystem requirement.
Qlik Sense's Edge Over Power BI
Qlik's edge over Power BI is architectural and deployment flexibility. The associative engine handles exploration patterns Power BI's query-based model can't replicate — for complex multi-source enterprise data, Qlik surfaces relationships Power BI misses because Power BI only answers questions users know to ask. For power users doing deep multi-dimensional analysis, this is a real capability difference.
The deployment flexibility story is even stronger against Power BI in 2026. As Power BI deepens Fabric absorption and pushes cloud-only workloads, Qlik remains one of the few enterprise BI platforms with true on-premises and hybrid deployment at feature parity with its SaaS edition. For regulated industries (healthcare, finance, government), organizations with strict data residency requirements, and enterprises that need sovereignty over their analytics infrastructure, Qlik stays in the conversation while Power BI Report Server structurally falls short.
The risk to Power BI is in regulated and multi-cloud enterprise accounts. Power BI's Azure assumption creates friction in environments where Azure isn't the answer. Qlik's multi-cloud posture (including AWS Marketplace availability and hybrid deployment) keeps it competitive in exactly those accounts.
What Users Are Saying
Qlik Sense users consistently highlight the associative engine's power for handling complex datasets and the depth of data transformation functions. Common tradeoffs include the initial learning curve and occasional performance issues with large workloads.
"There are several features in Qlik Sense which makes it stand out among BI tools specially while handling large dataset such as its associative model, wide variety of functions to transform data and set analysis to handle the data which is going to be displayed in UI."
Anubhav K. — Technology Analyst
"Sometimes there are loading issues, especially when business intelligence is running updates. It can be an issue, usually on Mondays, from morning into late afternoon, when all my data is pulling in at once. I feel like at times additional resources could be allocated."
Terrance M. — Human Resources Manager
"Initial steep learning curve to get up to speed. More design guidance to ensure best data modelling practices are being adhered to would be very helpful — I found it a bit live and learn based initially until I found some good guidance notes on their online community."
Paul N. — Data Analyst
Pricing
Qlik Sense Business runs $30/user/month billed annually. Qlik Sense Enterprise SaaS is $70/user/month (with Professional user at $72.50 and Analyzer at $41.25, based on third-party reseller reports). Enterprise Self-Managed (on-premises) requires custom quotes. Capacity-based licensing on Qlik Cloud starts around $2,500–$5,000/month for teams with large viewer populations [VERIFY]. Gotcha: Qlik's in-memory architecture means RAM requirements scale with data volume, so large enterprise deployments can get resource-intensive.
Qlik Sense Is Best For
Qlik Sense is best for large enterprises with complex multi-source datasets that value free-form associative exploration over pre-built dashboards, and for organizations in regulated industries needing on-premises or hybrid deployment at feature parity — a gap Power BI Report Server has never fully closed.
Watch Out For
Qlik's in-memory architecture can get resource-intensive and expensive at scale, the associative model has a steeper initial learning curve than Power BI's drag-and-drop, and customization for specialized visualizations often requires third-party extensions or custom development.
7. Metabase — Best for budget-conscious teams and developer-led organizations outside Microsoft
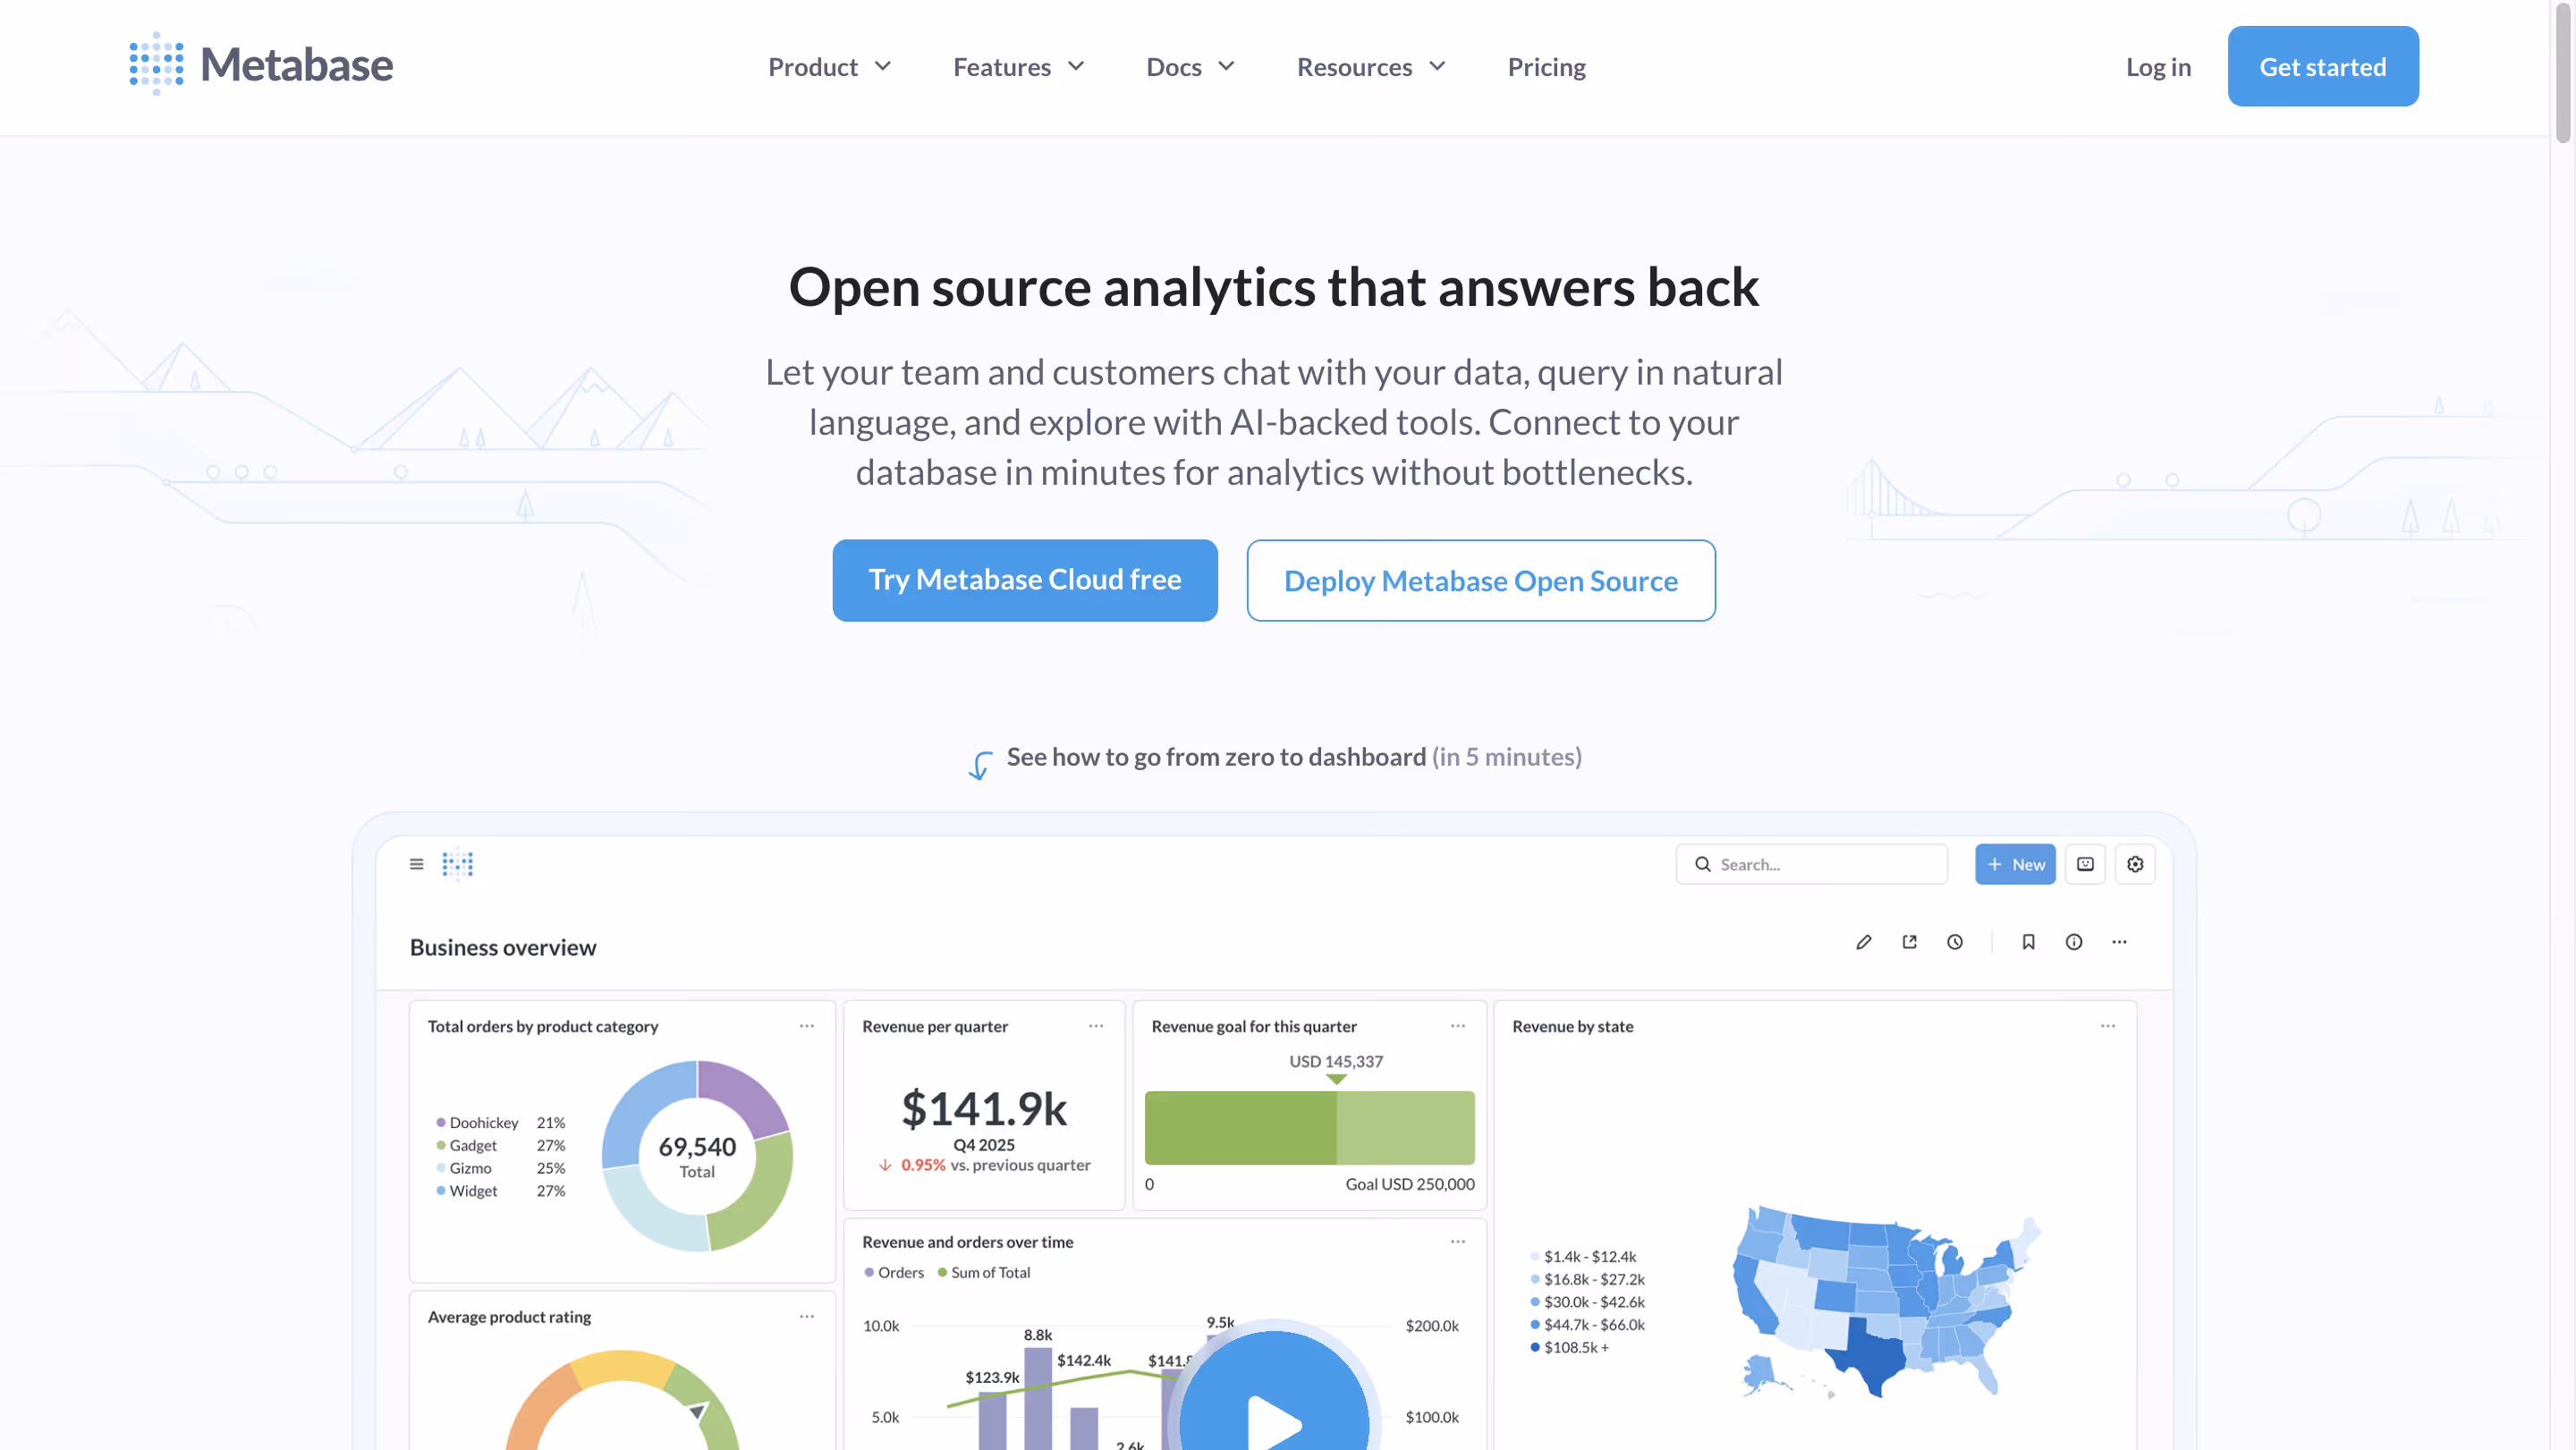
Metabase sits at the opposite end of the BI cost spectrum from everything else on this list — it's open source, self-hostable, and free for the core product. Founded in 2014, it became the default BI tool for engineering-led startups for one reason: zero licensing cost and a visual query builder non-technical users could actually pick up. For teams comparing Power BI's $14/user/month to zero dollars, the math rewrites the evaluation.
Why Metabase?
- Free open-source edition. Self-host Metabase for free under AGPL v3 with full core BI functionality — no artificial limits on dashboards, charts, or connections. For startups and engineering-led teams comparing Power BI's $14/user/month ($168/year after the April 2025 hike) to $0 in licensing, the math is immediate. The free tier includes a visual query builder, SQL editor, and 60+ database connectors — no Fabric capacity required.
- Intuitive visual query builder for non-technical users. Metabase's Question feature lets non-SQL users explore data and build dashboards through a point-and-click interface. Power users can drop into raw SQL anytime. The onboarding is genuinely fast — connect Metabase to Postgres and have your first chart running in under 10 minutes, with no DAX or Power Query M code to learn.
- No Microsoft ecosystem dependency. For teams on Mac, Linux, or running outside the Microsoft stack, Metabase removes the "Windows-only Desktop" constraint, the "Azure AD for authentication" assumption, and the "Fabric capacity for AI" requirement. For non-Microsoft organizations, this architectural independence matters more than raw feature parity.
Metabase's Edge Over Power BI
Metabase and Power BI sit at opposite ends of the BI cost spectrum, and that's precisely Metabase's angle. Power BI's "affordable $14/user" pitch assumes you're in the Microsoft 365 E5 bundle and don't need Copilot (which requires Fabric F64+). Outside that assumption, Power BI's true TCO balloons — especially for organizations with large viewer populations where per-seat licensing compounds, or embedded analytics where Power BI Embedded capacity pricing breaks SaaS unit economics.
Metabase's free self-hosted tier is the simplest possible counter to that: $0 in software licensing, bring your own infrastructure, no Fabric capacity dependency, no F64 paywall for AI. For developer-led startups, engineering teams comfortable with self-hosting, and organizations comparing Power BI's enterprise TCO to Metabase's "zero licensing plus engineering time," the decision often isn't close.
The risk to Power BI is at the top of the funnel. Every startup that begins with Metabase — which is many, given how ubiquitous Metabase has become in engineering-led orgs — now has alternatives (Astrato, Sigma, ThoughtSpot) to grow into when they outgrow Metabase. Power BI loses the developer-ecosystem evangelism battle, and developer evangelism shapes enterprise BI decisions five years downstream.
What Users Are Saying
Metabase users consistently highlight the ease of use for non-technical users and the speed of the Question feature for basic analytics. Common tradeoffs include enterprise governance limitations and the absence of native AI capabilities in the free tier.
"I love the Question feature of Metabase, which allows for the creation of no-code SQL queries that can be easily and intuitively answered even by non-technical users."
Tobias S. — Sr. BI Manager
"Working with bigger teams might be difficult due to the absence of fine-grained access constraints. If you don't optimize at the database level, performance may suffer while searching massive datasets."
Sampath K. — Security IAM Engineer II
"I find that Metabase could benefit from having an AI assistant that understands the databases and assists in building queries. This feature would significantly ease the process of creating data consultations without any SQL knowledge."
Matias d. — CRM & Lifecycle Manager
Pricing
Open Source is free to self-host under AGPL v3. Cloud Starter runs $100/month plus $6/user (5 users included). Cloud Pro is $575/month plus $12/user (10 users included; adds SSO, row-level security, and interactive embedding). Enterprise is custom, roughly $20,000+/year [VERIFY]. Metabot AI add-on: $100/month for 500 requests. Gotcha: the jump from Starter ($100) to Pro ($575) is steep — if you need SSO or row-level security, there's no intermediate tier, and Pro is the minimum for production-grade multi-user deployments.
Metabase Is Best For
Metabase is best for small teams, startups, and developer-led organizations that want simple BI without enterprise complexity or Microsoft-ecosystem dependency — particularly engineering teams comfortable with self-hosting and early-stage companies where Power BI's per-seat licensing and Fabric capacity requirements don't pencil out against a $0 open-source alternative.
Watch Out For
Metabase hits real walls for enterprise governance, sophisticated visualizations, and production-grade multi-tenant embedding — the free version requires engineering maintenance time, and the $575/month Pro tier is the minimum for even basic security features like SSO and row-level security that Power BI includes at the Pro tier.
Key Takeaways: Which Power BI Alternative Fits?
The right Power BI alternative depends on which specific friction point is pushing you to evaluate in the first place. Map your constraint to a tool:
Frequently Asked Questions
What is the best Power BI alternative in 2026?
The best Power BI alternative depends on your priority. For warehouse-native BI without Fabric capacity requirements, Astrato and Sigma lead; for visualization depth and Mac authoring, Tableau; for AI-first natural-language analytics, ThoughtSpot; for Google Cloud teams, Looker; for on-premises deployment flexibility, Qlik Sense; for open-source budget-conscious teams, Metabase. There's no universal winner — the right choice maps to your cloud stack, team skills, and whether you're inside or outside the Microsoft ecosystem.
Why did Microsoft raise Power BI prices in 2025?
In April 2025, Microsoft raised Power BI Pro from $10 to $14/user/month (a 40% increase) and Premium Per User from $20 to $24/user/month. Microsoft cited AI investment, improved visuals and performance, and deepening Fabric integration as justifications. The change applied to both new and existing customers at next renewal with no grandfathering, prompting many organizations to reevaluate their BI strategy. For teams with hundreds or thousands of Pro seats, this is a material budget line — and the primary trigger for Power BI alternatives searches in 2026.
Is Power BI worth the price in 2026?
Power BI is worth the price for organizations deeply embedded in the Microsoft 365 ecosystem — particularly those on M365 E5 where Power BI Pro is effectively bundled, and Azure-first organizations that can absorb Fabric capacity costs. For non-Microsoft organizations, SaaS companies needing embedded analytics at scale, Mac-first teams, or organizations evaluating BI primarily on AI capabilities, the total cost of ownership (including required Fabric F64 capacity for Copilot) increasingly makes alternatives competitive.
What's the best Power BI alternative for embedded analytics?
For customer-facing embedded analytics specifically, Astrato is the strongest alternative to Power BI Embedded — its usage-based pricing avoids per-seat compounding, full white-labeling is included without a premium upsell, multi-tenant security is built in, and writeback enables operational workflows Power BI can't support natively. Sigma Computing is the second-strongest option for spreadsheet-native embedded scenarios, and Looker's Embed SDK is mature for API-first implementations willing to absorb the LookML modeling overhead.
Is Power BI being replaced by Microsoft Fabric?
No — Power BI remains Microsoft's BI product, but its positioning has changed. Power BI is now explicitly "a workload within Microsoft Fabric," Microsoft's unified analytics platform. Your Power BI reports, dashboards, and semantic models remain unchanged, but new capabilities (Copilot, Direct Lake mode, OneLake integration) increasingly require Fabric capacity to access. Legacy Power BI Premium P1 capacity is being retired. For strategic planning, treat Power BI as the visualization layer inside a broader Fabric platform decision, not a standalone BI product.
Do I need Microsoft Fabric to use Power BI Copilot?
Yes — Power BI Copilot requires either Fabric F64+ capacity (~$5,258/month) or Power BI Premium P1+ for full functionality. Since April 2025, Copilot has been available at the lighter F2 tier (~$263/month) for limited use. A standard Power BI Pro license ($14/user/month) alone does not include Copilot access. This is the single biggest change to Power BI's value proposition in 2026 and the primary reason organizations evaluate AI-first alternatives like ThoughtSpot and Astrato.
Can I use Power BI on Mac?
Not fully. Power BI Desktop, the primary authoring tool for building data models and reports, is Windows-only — there is no native macOS or Linux version in 2026. Mac users can use Power BI Service (the web-based platform) for viewing and light authoring, but serious report development still requires a Windows environment, a virtual machine, or Parallels. This is a persistent limitation Microsoft hasn't addressed since Power BI's 2015 launch, and it's the main reason Mac-first organizations evaluate Tableau, Astrato, or browser-based alternatives.
How does Power BI compare to Tableau in 2026?
Power BI is significantly cheaper ($14/user/month vs. Tableau's $75/user Creator licenses), tightly integrated with Microsoft 365, and benefits from Copilot AI when paired with Fabric capacity. Tableau offers better visualization quality, cross-platform authoring (including Mac), the larger BI community (DataFam), and a more mature agentic AI story via Tableau Next and Agentforce integration — though Tableau's Salesforce pivot creates its own ecosystem-dependency concerns for non-Salesforce organizations. The choice typically comes down to existing cloud ecosystem (Microsoft vs. Salesforce) rather than feature-by-feature comparison.
Ready to See What Focused, Warehouse-Native BI Looks Like?
Picking a Power BI alternative in 2026 isn't about finding the cheapest option or the longest feature list. It's about fit — how your team actually works, where your architecture is heading, and which friction points are costing you the most right now. Each tool in this guide wins for a specific buyer, and the wrong answer for one team is the right answer for another.
Astrato's pitch is narrow by design. If your data lives in Snowflake, BigQuery, Databricks, Redshift, ClickHouse, or PostgreSQL, and you're tired of Power BI's import-mode data duplication, Fabric capacity gatekeeping, DAX specialist bottleneck, or per-seat embedded economics — Astrato was built for that exact situation. Warehouse-native by default, browser-based on any OS, native writeback, usage-based pricing, and AI that works with your LLM of choice instead of a $5,258/month capacity tier.
See what that actually looks like with your data. Book a demo with the Astrato team and see how warehouse-native BI works with your actual data.
Ready to experience next-gen analytics?
See how Astrato runs natively in your warehouse.


.avif)