How Data Mesh Finally Delivers on the Promise of Self-Service BI

This article distills the key insights and examples from that session and expands on the discussion to provide a structured, practical guide to data mesh and self-service BI.
🎥 Watch the full webinar recording
On the broken promise of Self-Service BI
For 20 years, we’ve been chasing the dream of self-service BI. The idea was simple: empower business users to access and explore data on their own, without relying on IT.
But in most companies, it turned into something else entirely – a tug of war.
“Self-service has always been well-intentioned, but what emerged was a constant tug of war between IT and the business. The business wants to move fast, while IT has to ensure data is accurate, governed, and scalable. The result? Frustration on both sides, and dashboards nobody fully trusts.”
The business wanted speed and flexibility. IT wanted control and governance. Instead of working together, they pulled in opposite directions – leaving analytics stuck in the middle.
Why Legacy BI tools fell short
The rise of tools like Qlik, Tableau, and Power BI promised to solve the problem. For the first time, business teams could drag‑and‑drop, build dashboards, and make faster decisions without IT intervention.
But the model was flawed. To gain speed, BI tools pulled data out of warehouses and into their own proprietary storage. Each extract or transformation created duplication and inconsistency that quickly undermined trust.
“BI tools did one thing really well – they took data out of slow, inaccessible warehouses and made it consumable. But every extract, DAX or custom calculation created problems, and IT was suddenly responsible for applications they hadn’t designed. Supporting that was an absolute nightmare.”
The result: self‑service BI achieved only a fraction of its potential. Too much effort went into sourcing, modelling, and preparing data – often by people without the right expertise. What was meant to empower everyone ended up used by a narrow band of power users, while most of the workforce remained excluded.
The pendulum swing: Centralisation vs. Decentralisation
When cracks appeared, organisations reacted with a familiar cycle:
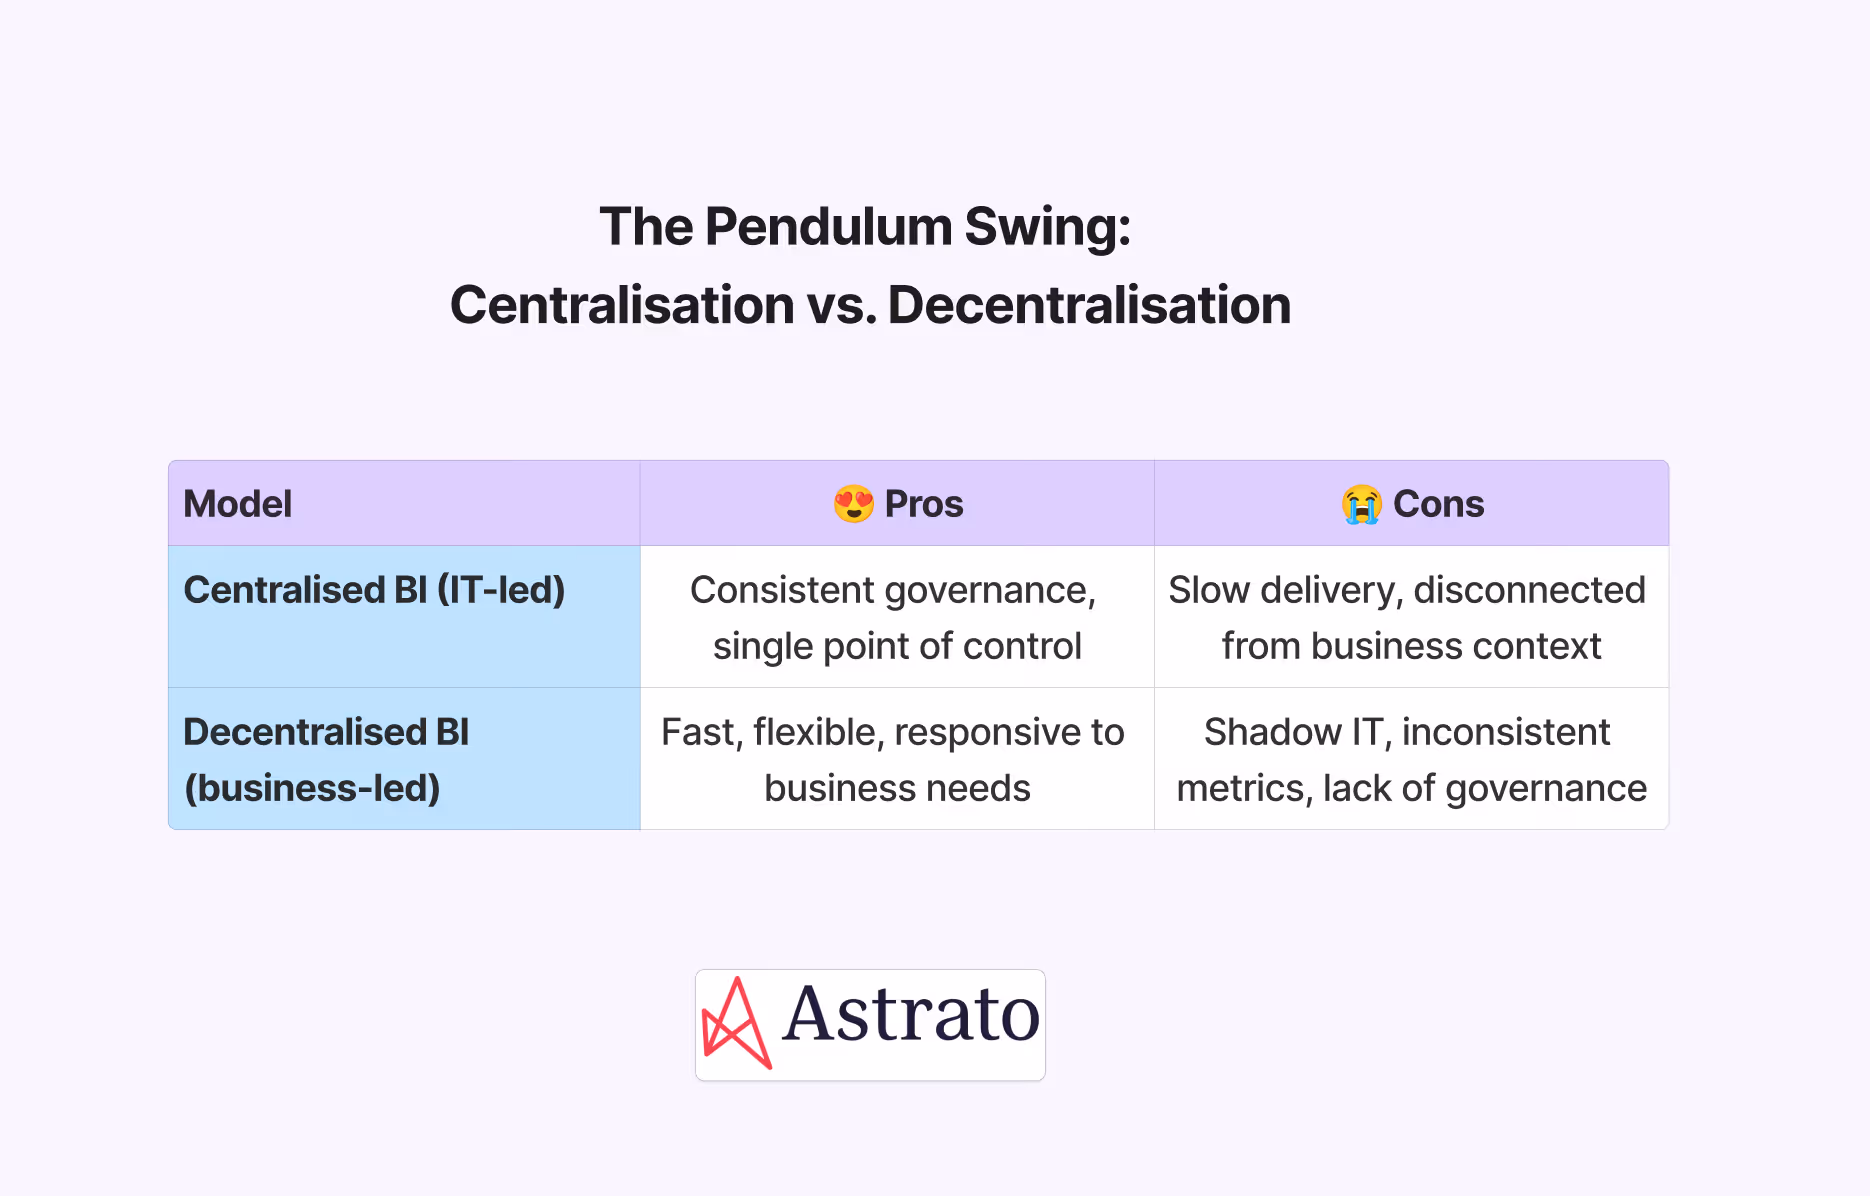
“Every four or five years, the pendulum swings – centralise everything in IT to maintain governance, and as agility takes a hit, swing back to business-owned BI to accelerate time-to-value, at the expense of evergrowing tech debt. But the underlying pain never gets solved: how do we make IT and the business work together instead of against each other?”
Neither model scaled. Centralisation stifled agility; decentralisation eroded trust.
Why the old model of Legacy BI no longer works
This tug of war might have been tolerable in the past. It isn’t anymore.
Three forces have contributed to making the old model obsolete:
- Cloud data explosion: Cloud platforms now generate terabytes of new data daily. Businesses want access to all of it, across more sources and data types than ever before, with an ever‑growing demand for speed and availability.
- Pace of business: Inflation, tariffs, regulation, and GenAI disruption force companies to adapt instantly. Real‑time decision‑making is no longer optional, and data is the foundation.
- Trust deficit: Users, unable to trust BI dashboards, export to Excel and rebuild their own analyses.
“We are living in the highest state of business urgency we’ve ever experienced. The economy moves fast, politics move fast, technology moves fast. And yet, too many organisations are stuck exporting data into Excel because they either can’t trust their BI dashboards or find BI too rigid to use.”
Enter data mesh.

What Is Data Mesh?
Data mesh is a framework and operating model that finally breaks the deadlock.
“Data mesh is not just an architecture – it’s an operating model. It treats data as a product, owned by business domains who know it best, but on a central IT platform that ensures governance, security, and scalability.”
The four principles of data mesh (as coined by Zhamak Dehghani) are:
- Domain ownership – Business teams closest to the data own and manage it.
- Data as a product – Each dataset has a lifecycle, purpose, and accountable owner.
- Self-serve infrastructure – IT provides a platform for ingestion, security, and scalability.
- Federated governance – Guardrails ensure consistency across domains.
It’s a shift from “IT owns data” to “business owns data products on IT’s infrastructure.”
Data Products: the building blocks
At the heart of data mesh are data products.
A data product is a curated, documented dataset with a clear business purpose and a named owner. It’s built for reuse, not just a one-off project.
Examples:
- Sales domain → Sales Pipeline product (CRM data enriched with opportunity stages).
- Marketing domain → Campaign Performance product (ad spend, impressions, conversions).
- Finance domain → Budget vs. Actuals product (planned vs. realised spend).
A good data product is:
- Purpose-driven: built for a defined use case.
- Reusable: can be consumed by other teams.
- Owned: someone is accountable for quality and maintenance.
This ownership shift is crucial. IT no longer “translates” data for the business – the business builds and owns its own data products.
To fully unlock this shift, you need to apply product thinking: treating each dataset like something you design, launch, and maintain over time – just like any product you’d ship to customers.
Learn more about the Semantic Data Products 👉
Applying product thinking to data
Here’s the shift most companies miss: data isn’t exhaust from your systems – it’s not a byproduct. In a data mesh world, data has to be treated like a product – designed, owned, and improved with the same discipline as any product your company ships.
As I said during the webinar:
“It starts with the business domain owning and managing the data products. It’s no longer an IT problem. The business domain is responsible for maintaining, defining, and documenting the data products and the semantic layer.”
The old way? Random dashboards stitched together, undocumented pipelines nobody understands, and endless finger-pointing when numbers don’t add up. Nobody owns the problem, so nobody fixes it.
The new way? Every data product has a purpose, an owner, and a lifecycle:
- One job: deliver value. A product is built to answer a business question and keep answering it.
- Somebody owns it. There’s accountability when data breaks, just like any other product.
- Everyone can trust it. It’s documented, consistent, and evolves – launched, improved, and retired when it stops delivering value.
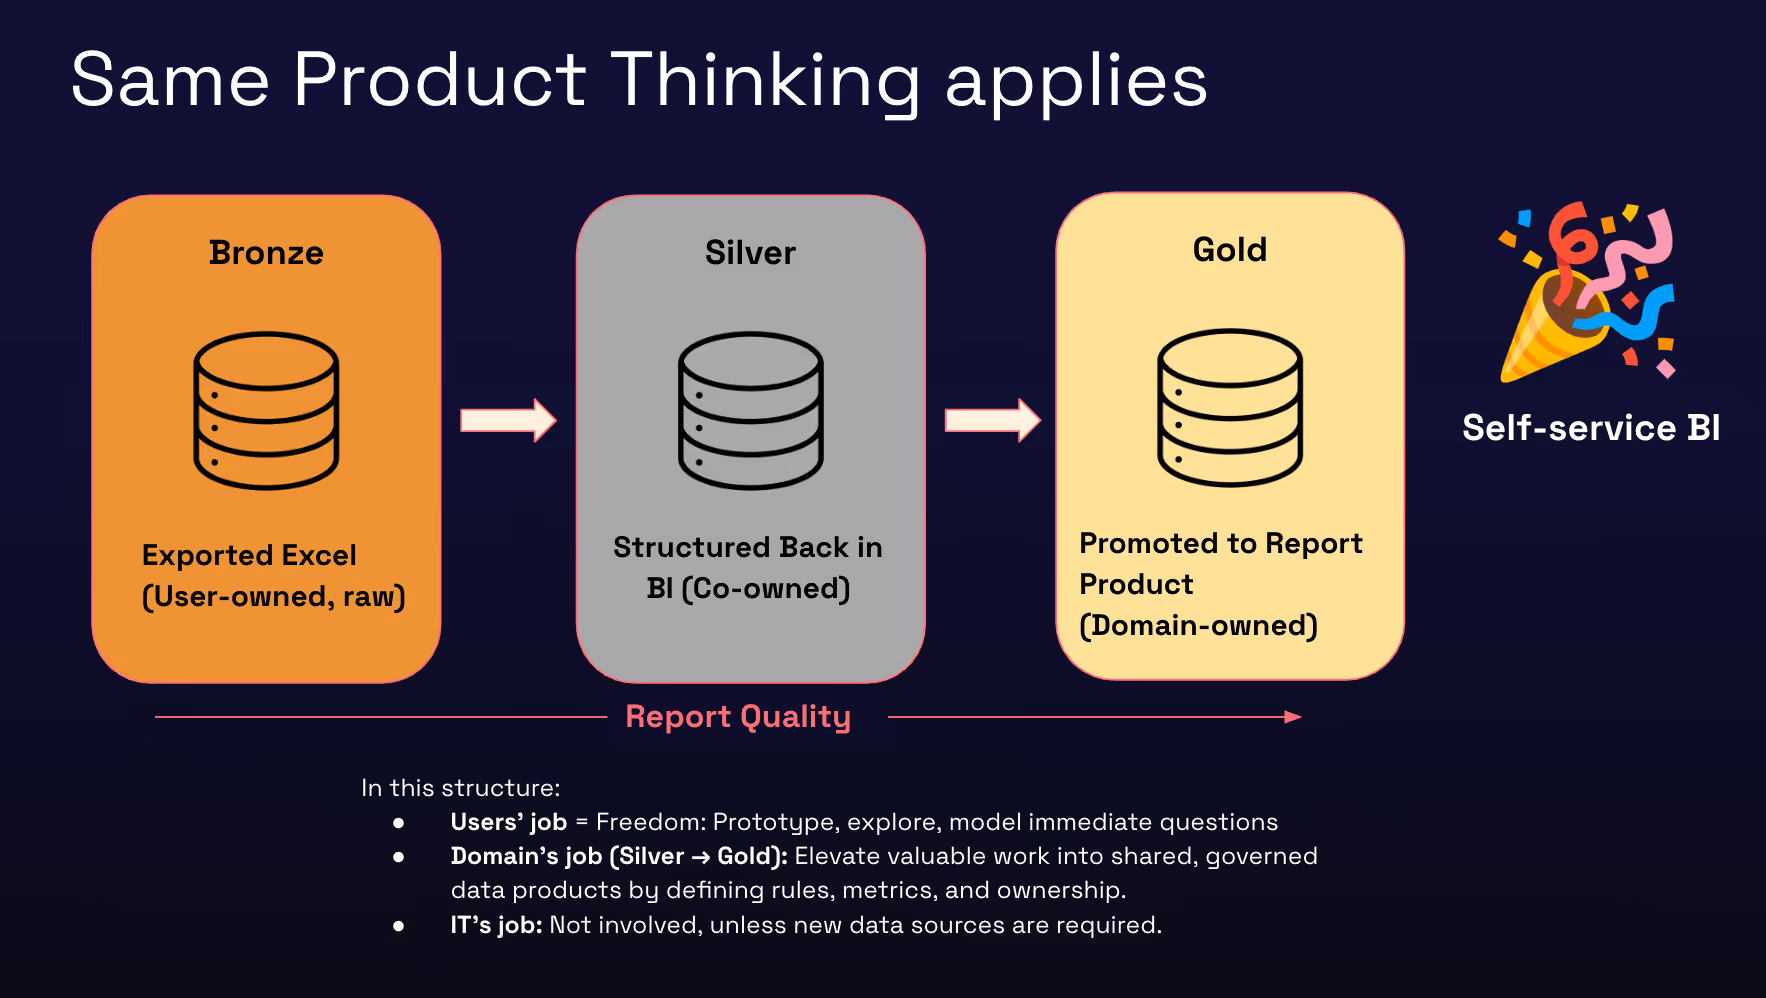
The Medallion Principle in action (Bronze → Silver → Gold)
The medallion architecture is a practical way to structure product thinking. It breaks data into three layers, each with clear ownership:
- Bronze (raw data, IT-owned): Ingested quickly from source systems. IT’s job is to get data to Bronze fast and enforce basic guardrails.
- Silver (cleaned & standardised, co-owned): Data refined and joined, with platform and domains working together to apply quality and structure.
- Gold (business-ready, domain-owned): Curated, contextualised data products owned by business domains. Gold is where self-service BI happens.

In this structure:
- IT ensures ingestion and governance.
- Domains shape Silver into Gold with context and metrics.
- Users self-serve on Gold through no-code BI.
This is what applying product thinking looks like in practice: data managed with accountability, evolving with purpose, and compounding in value over time.
And once products are in place, another challenge emerges: making sure everyone speaks the same language. That’s where the semantic layer comes in.
The Semantic Layer as a shared language
Even with data products in place, teams can still talk past each other. That’s where the semantic layer comes in. (We’ll return to this again in the tooling section, where consistency and context are critical.)
The semantic layer is the shared language that resolves these conflicts. It defines metrics and business logic once and applies them everywhere.
Even with data products, different teams often use the same words differently.
- Revenue = Bookings (Sales) vs. Recognised Revenue (Finance) vs. ARR (Strategy).
- Churn = Lost accounts (Customer Success) vs. reduced spend (Finance).
Without a semantic layer, self-service devolves into chaos. With it, every dashboard, report, and AI assistant speaks the same language.
Zero-copy architecture is the foundation of trust
The second cornerstone is zero-copy architecture.
In legacy BI, every extract or copy created drift: different dashboards showing different numbers.
“This only works if you have a zero-copy architecture. Every dashboard, every semantic layer, every data product queries the same source of truth. Update the data once, and it’s updated everywhere – with governance applied at the source.”
Benefits of zero-copy:
- Consistency: no more “which dashboard is right?” debates.
- Real-time updates: changes propagate instantly.
- Security: access rules are applied once, inherited everywhere.

This is critical not just for dashboards – but also for LLMs and AI. If AI copilots are trained on multiple inconsistent copies, they deliver hallucinations. A zero-copy, governed source is the foundation for trustworthy AI.
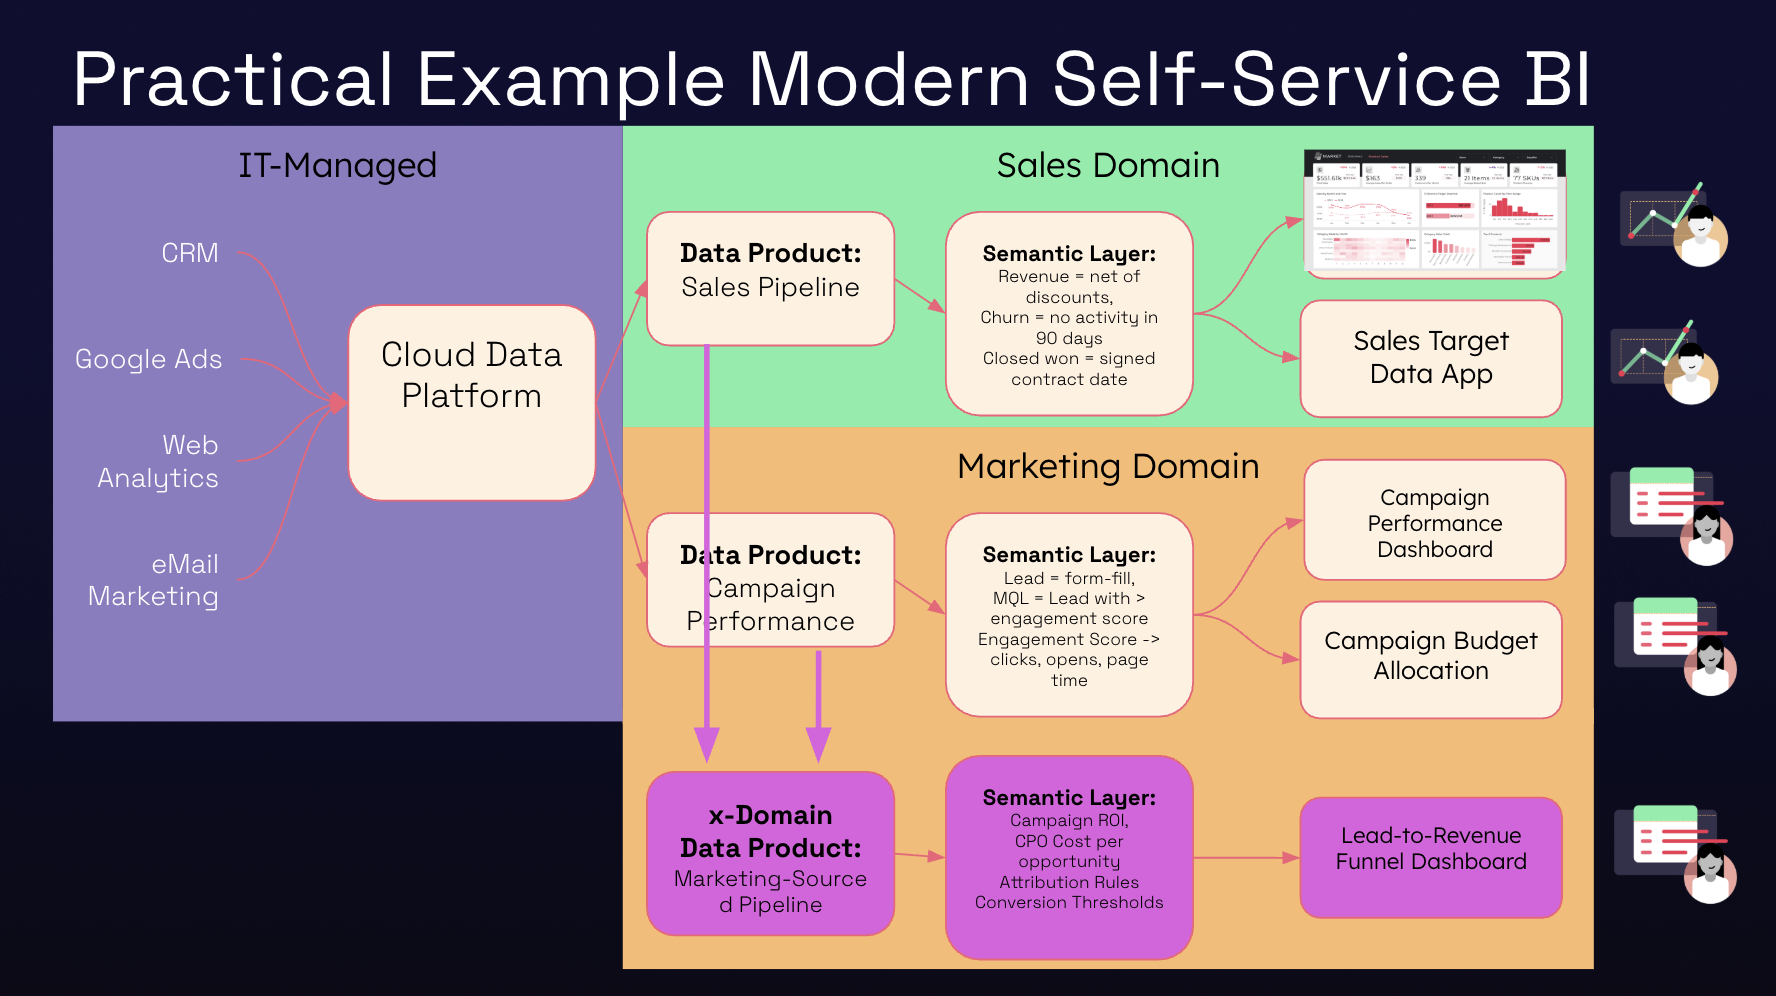
Practical Domain Examples
Sales Domain
- Ingest CRM data into the warehouse.
- Define a Sales Pipeline product.
- Semantic layer defines revenue, churn, and forecast metrics.
- Dashboards: pipeline health, win rates, forecast accuracy.
Marketing Domain
- Ingest marketing funnel data.
- Define a Campaign Performance product.
- Semantic layer defines impressions, CPC, cost per opportunity.
- Dashboards: campaign ROI, lead quality.
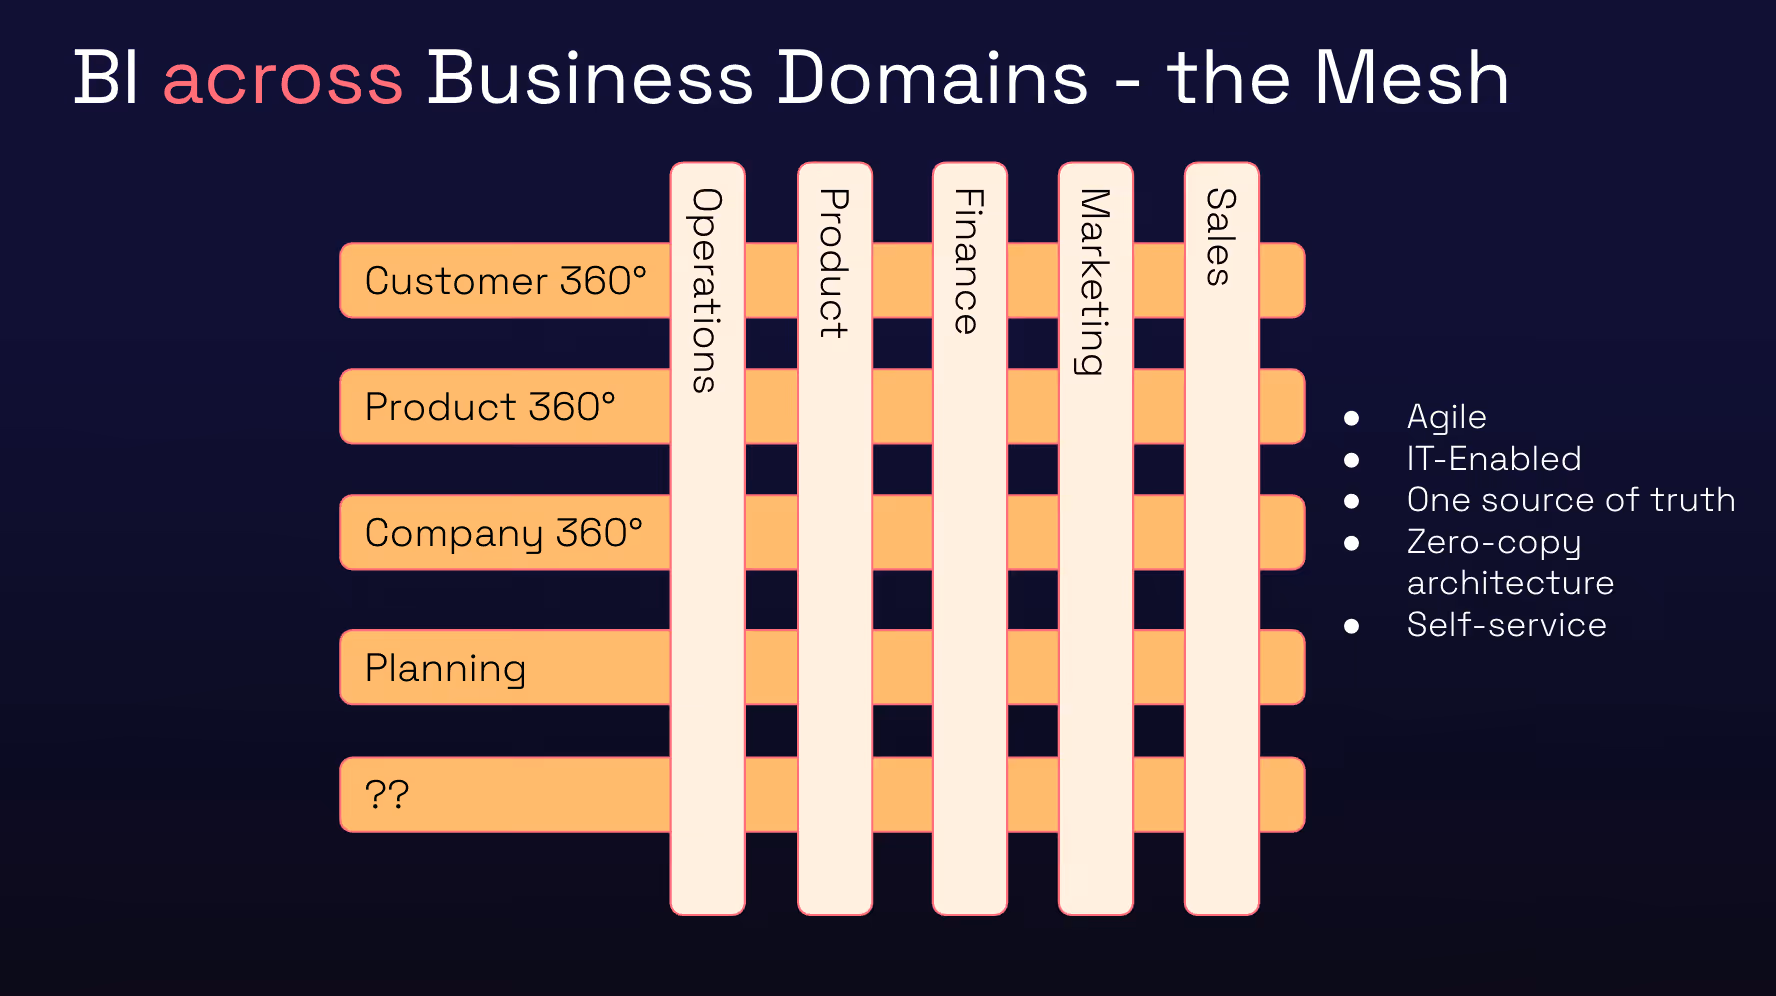
Cross-Domain Analytics
“In the old world, building a cross-domain analysis meant a new project, new datasets, and endless validation. With data mesh, marketing can take its own product, combine it with sales’ product, and build a new pipeline dashboard – all without waiting for IT.”
This enables attribution analysis: marketing’s pipeline contribution to sales – with shared definitions and full trust.
Customer 360 (Multi-Domain)
- Combine sales, marketing, product, and support data products.
- Define a Customer 360 product.
- Dashboards: churn prediction, upsell opportunities, customer health.
Pitfalls to avoid when adopting Data Mesh
Even with the right intent, many organisations stumble when they attempt a data mesh transition. Most of the missteps fall into three big traps:
1. Treating Data Mesh as “just another architecture”
Why it happens: IT often leads data initiatives, so the instinct is to treat data mesh like a new tech stack: move data into a lakehouse, spin up new pipelines, and declare victory.
Impact: Without cultural and organisational change, domains don’t take ownership. You end up with a centralised team trying to manage “distributed” data – defeating the purpose.
How to avoid it: Frame data mesh as an operating model, not just an architectural choice. Appoint domain data owners, set up accountability frameworks, and invest in training business teams to treat data as a product.
2. Product sprawl
Why it happens: Teams get enthusiastic and spin up dozens of products – every dataset becomes a “product.” Others skip the semantic layer, assuming the data will speak for itself.
Impact: Sprawl and inconsistency. Products go stale, definitions drift, dashboards show different numbers, and trust erodes.
How to avoid it: Apply product thinking. Start with a small number of high-value products (like Sales Pipeline or Campaign Performance). Ensure each has a lifecycle, documentation, and an owner. And don’t launch without clear definitions in a semantic layer.
3. Copying Data and Old Habits
Why it happens: Legacy BI practices linger – users extract data into their tools of choice, build local silos, and bypass governance. Leaders may also underestimate the cultural shift, treating the rollout as a tech upgrade rather than a transformation.
Impact: Shadow IT re-emerges, governance breaks down, and adoption stalls. The organisation slips back into the very problems data mesh was designed to fix.
How to avoid it: Commit to zero-copy architecture. All consumption – dashboards, reports, AI models – must query the central cloud source through semantic and product layers. Provide the right tools to make this easy. And treat the rollout like an organisational transformation: communicate the “why,” celebrate quick wins, and support teams as responsibilities shift.
🐘 The elephant in the room: Excel
Even with strong governance, many users still default back to Excel. It’s familiar, flexible, and often feels faster. But unmanaged, these imports create the same silos and inconsistencies data mesh was designed to prevent.
One practical approach is to apply the medallion principle even to Excel data:
- Bronze: import raw Excel files quickly but with guardrails.
- Silver: clean, standardise, and document what’s inside.
- Gold: only promote Excel-sourced data once it’s curated into a domain-owned product.
By treating Excel like any other source, you stop it from becoming a back door to shadow IT – while still giving business users the flexibility they expect.
Transitioning to Data Mesh: A Practical Checklist
Adopting data mesh isn’t just about new technology – it’s a shift in how your organisation treats data. To make it easier, here’s a step-by-step checklist you can use to assess where you are today and what comes next.
✅ Step 1: Centralise Your Data
- Have you consolidated data into a modern cloud platform (Snowflake, BigQuery, Databricks)?
- Is all core business data accessible from a single source rather than scattered systems?
If not → start here. Without a single home for your data, everything else falls apart.
✅ Step 2: Stop Copying Data
- Are your BI tools querying live data directly, without extracts?
- Have you eliminated duplicate copies in spreadsheets, local servers, or BI silos?
If not → enforce a zero-copy architecture. Every copy is a risk to trust.
✅ Step 3: Create Domain Data Products
- Do business domains (e.g., Sales, Marketing, Finance) own curated data sets?
- Does each product have a clear purpose, documentation, and an accountable owner?
If not → start with one or two high-value products (like Sales Pipeline or Campaign Performance) before scaling.
✅ Step 4: Build a Semantic Layer
- Are business terms like “revenue” or “churn” defined consistently across domains?
- Is there a shared semantic layer that feeds every dashboard and report?
If not → invest in definitions before expanding further. Otherwise, self-service becomes chaos.
✅ Step 5: Implement Federated Governance
- Does IT provide guardrails for security, compliance, and scalability?
- Can domains innovate while still inheriting central governance?
If not → design a federated governance model where IT sets standards, but domains own execution.
Choosing the right tooling for Self-Service BI in a Data Mesh world
Operating models and frameworks are critical – but without the right tooling, they collapse under their own weight.
In the webinar, I outlined four pillars that any self-service BI technology must deliver if you want to move beyond dashboard déjà vu.
1. Architecture & Integration
First things first: architecture. If your BI tool isn’t querying live data, it isn’t self-service. Full stop.
Too many platforms still copy data into extracts or proprietary storage. That’s like building a house on sand – it looks stable at first, but cracks appear fast.
The right BI layer must:
- Query your warehouse directly, always.
- Integrate natively with your data sources (Snowflake, BigQuery, Databricks, Redshift).
Get this wrong, and you recreate the same silos you worked so hard to eliminate.
2. Usability
Here’s the uncomfortable truth: if BI is hard to use, it won’t be used. Adoption dies the moment a tool requires SQL fluency or a two-week training course.
Self-service means anyone in the business – from frontline staff to executives – can explore data confidently. That requires:
- A truly no-code experience.
- An intuitive interface that encourages exploration, not intimidation.
- World-class visuals that make insights obvious, not hidden in clutter.
Think about it: if your only “self-service” users are analysts, it isn’t self-service. It’s just another bottleneck.
3. Consistency & Context
Here’s where most self-service projects fall apart. Without consistency, you don’t have analytics – you have arguments.
What counts as revenue? ARR? Recognised revenue? Bookings? Without a shared definition, every dashboard tells a different story. And that’s way before you introduce AI co-pilots (fyi, things get much worse later).
That’s why the right tooling must include:
- A semantic layer: the Rosetta Stone of your business data, ensuring metrics mean the same thing across every team.
- Governance by design: security, lineage, and quality checks built in from the start, not bolted on later.
Without this, trust crumbles – and teams go back to Excel hell.
4. Flexibility
Finally: flexibility. Because the one certainty in business is change.
Your BI platform shouldn’t just serve static dashboards. It should flex with new questions, new workflows, and even new business models. Look for:
- Writeback to source – because BI should be more than read-only. Think scenario planning, forecasting, even data capture.
- Customisability – the freedom to tailor dashboards, workflows, and reporting for any need, whether it’s internal teams or customer-facing analytics.
Flexibility is what future-proofs your investment. Without it, today’s “solution” becomes tomorrow’s bottleneck.
Pulling It All Together
Choosing the right tooling isn’t about feature checklists – it’s about enforcing the principles of modern BI: zero-copy architecture, semantic consistency, usability for all, and flexibility to grow.
Get it wrong, and you’re back in the old cycle of mistrust and shadow IT. Get it right, and you’ve finally cracked the code of self-service BI.
Why this matters for the future of BI
The promise of self-service BI was always about empowerment. But legacy approaches created friction, duplication, and mistrust.
With data mesh, we finally have a model that empowers domains, preserves governance, and unlocks agility.
“The future of self-service isn’t just dashboards – it’s AI copilots powered by a semantic layer and zero-copy architecture. That’s how organisations will scale decision-making with trust.”
The tug of war is over. IT and business can finally move in the same direction – delivering on the original promise of self-service BI.
Start small with one domain and one product – and watch how quickly trust, adoption, and value compound across the business.
Want to see modern BI in action? Request a demo with the Astrato team!
Ready to experience next-gen analytics?
See how Astrato runs natively in your warehouse.