The Automated Reporting Playbook (2026): How Smart Companies Ship Insights on Autopilot


It’s 2026. Data flows in real time, dashboards respond instantly, semantic layers keep metrics consistent, and cloud warehouses scale without anyone touching a server. And yet – inside thousands of otherwise modern organisations – reporting still happens the way it did a decade ago: frantic CSV exports, screenshot-pasted slides, and Monday-morning email rituals that everyone quietly resents.
It’s a strange contradiction. We’ve rebuilt the whole data stack – except the part where insight actually reaches people.
The rise of real-time analytics didn’t make scheduled reporting obsolete. If anything, it made automated reporting indispensable: the dependable distribution layer that ensures the right numbers land in the right inboxes, on the right cadence, exactly when teams need alignment.
Ask any BI leader and they'll admit the same thing: dashboards are for exploration, but automated reports are how organisations stay coordinated.
This guide explains what automated reporting is, why it matters more than ever in 2026, how teams use it internally and as part of SaaS products, and what a modern, cloud-native approach looks like when implemented well.
Why Automated Reporting Matters in 2026
The operational drag no one accounts for
Walk into any BI or analytics standup and you’ll hear a version of the same quiet frustration: reporting work is consuming far too much time, far too quietly.
The cost isn’t loud or dramatic – it’s ambient. It lives inside late-night slide edits, scattered CSV exports, Slack threads begging for “the updated numbers”, and that single source-of-truth dashboard nobody remembers to refresh.
Every team has their version of the confession:
- “We spend more time collecting data than analysing it.”
- “Our leadership meeting prep is 80% manual.”
- “We fix the same dashboard export every month.”
Finance, RevOps, Product Ops – entire functions lose 10–20 hours a week to recurring reporting chores that should have vanished years ago. Yet BI leaders rarely track this effort, so the drag persists. Everyone feels it. Nobody budgets for it.
Automated reporting removes this drag by replacing repeated, error-prone manual steps with governed, reusable, observable workflows. Instead of hoping every analyst formats the report the same way each week, the logic lives in one place – the warehouse – and modern BI tools like Astrato generate the same trusted output every time.
The result is not efficiency for efficiency’s sake. It’s the restoration of BI teams’ actual job: analysis, not assembly.
Reports are not dashboards – they’re an operational communication layer
Here’s the part most data teams underestimate: executives, regional managers, and frontline staff do not live inside dashboards. They live in calendars, inboxes, Slack, Teams, and tightly choreographed routines.
Dashboards are powerful, but they require intentional exploration. They ask the user to stop what they’re doing, open a BI tool, choose the right dashboard, filter it correctly, and mentally reconcile what’s changed since last week.
Automated reports require nothing of the user. They arrive. They inform. They align.
This is why they survive every technological wave. The rhythm of the business hasn’t changed: Monday pipeline reviews, Tuesday forecasting, Wednesday ops standups, Friday executive summaries. Automated reporting is the faithful courier that delivers the right numbers into these moments without requiring anyone to navigate the analytics layer.
In warehouse-native tools like Astrato, this becomes even more powerful. Because scheduled reports pull directly from the same live-query sources as dashboards, organizations finally avoid the perennial problem of “the PDF shows different numbers than the dashboard.” Governance becomes automatic, not another checklist item.
For BI leaders, the lesson is clear: dashboards are destinations. Automated reports are delivery. And in 2026, organizations need both.
Why Scheduled Reporting Still Matters in the Age of Real-Time Analytics
Real-time dashboards have transformed analytics. They expose what’s happening right now: the spike in signups, the dip in utilisation, the sudden jump in warehouse orders. They provide situational awareness in a way static BI tools never could.
But organizations don’t operate purely in real time. They operate on cadence.
There’s the Monday morning pipeline review.
The Tuesday customer-success standup.
The monthly financial close.
The quarterly board pack that simply must be in inboxes by 9:00 AM.
These aren’t accidents of corporate culture – they are the operating system of the business. And each of these moments demands a structured, timestamped, auditable snapshot that everyone can reference without debate.
So while dashboards give teams awareness, scheduled reports give them alignment.
In a recent conversation, a SaaS CFO put it more bluntly than any analyst could:
“We love real-time dashboards, but our investors want a PDF at 9:00 AM every Monday. That’s how decisions get made.”
Turns out, real-time analytics didn’t eliminate scheduled reporting. It raised the bar for it.
If dashboards tell you what’s happening, automated reports tell you what everyone should take away from it.
This is why BI teams, adopting warehouse-native tools like Astrato, see scheduled reporting become a natural extension of their dashboards, not a separate workflow.
In warehouse-native platforms, scheduled reports draw from the same workbooks and live query layers that power dashboards – meaning your PDFs, CSVs, PPTs or image exports reflect the same logic, and you avoid the dreaded ‘dashboard vs PDF number mismatch’.
So… What Exactly Are Automated Reports?
A simple definition for BI & data teams
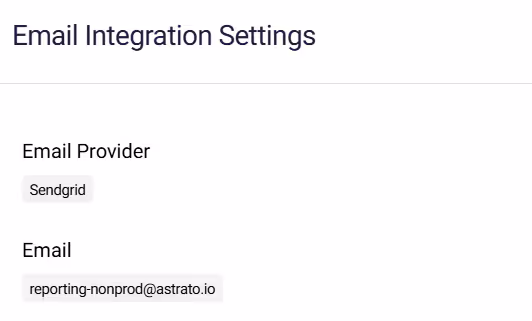
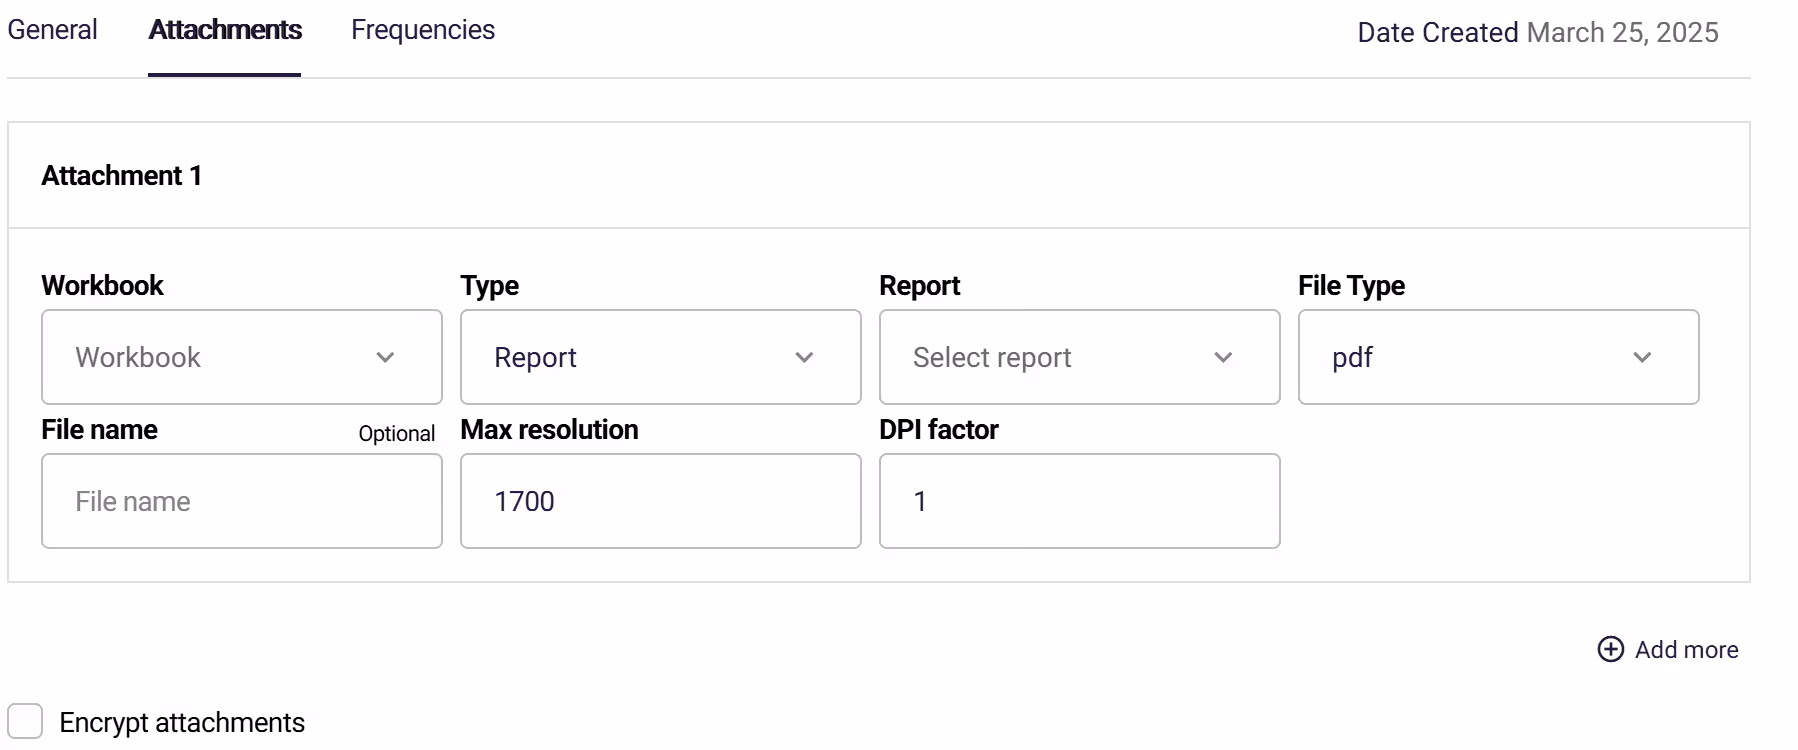
Automated reports are scheduled, governed, personalised outputs – usually PDFs, PowerPoints, images, or Excel/CSV bundles – generated directly from a live semantic layer or warehouse table and delivered automatically on a recurring schedule.
They are not “exports”, but insight-delivery pipelines. Like a data pipeline, they are automated, parameterised and observable.
Good dashboards require people to come to the data. Good automated reports bring the data to the people.
And in distributed organizations or customer-facing products, that difference is massive.
Manual vs automated reporting: the unspoken burden
Every analyst knows this workflow by heart:
export → reformat → fix a mislabeled axis → screenshot → paste → attach → pray → send → repeat next week.
It’s universal. It’s painful. And it’s almost always invisible.

Automated reporting replaces that cycle with a governed, repeatable process:
define logic → connect warehouse → design the template once → schedule → deliver → monitor.
The benefit isn’t just efficiency. It’s consistency, observability, and scale, especially when generating hundreds or thousands of personalized versions.
This is where Astrato’s warehouse-native architecture becomes a multiplier. Because dashboards and scheduled reports pull from the same live definitions, there’s no extract layer to get out of sync, and no “report version drift” to cause awkward discrepancies in leadership calls.
The three components of modern automated reporting
Modern automated reporting always includes three tightly linked layers:
- Trusted, governed data
Warehouse-native logic, semantic layers, and metrics defined once – not reinvented in every report. - Reusable templates
Dashboard pages or workbook sheets that act as the visual blueprint. In Astrato, these templates are live pages powered by data warehouses like ClickHouse, Databricks or Snowflake, meaning whatever updates in the dashboard, updates in the exported report. - A distribution engine
Email, Slack, Teams, shared drives, S3 buckets, or embedded analytics surfaces. Astrato’s scheduler adds CRON support, encryption, verified sending domains, and cycle-through-values for high-scale personalization.
When these three layers connect cleanly, automated reporting stops being a recurring chore and becomes infrastructure – the dependable backbone of insight delivery.
The Anatomy of Modern Automated Reports
Built on live, governed, consistent data
If you ask data leaders what they fear most, the answer is disarmingly simple: “Two reports showing two different numbers.” It doesn’t matter how sophisticated your BI stack is – once trust breaks, everything else collapses.
The foundation of any automated reporting system is consistency. That means row-level security, column-level controls, governed metrics, reliable joins, and business logic defined once – ideally in the warehouse or semantic layer, not scattered across half a dozen dashboards.
This is where warehouse-native BI platforms like Astrato change the economics. Because Astrato queries data warehouses live, the logic behind a dashboard, an export, or a scheduled report always originates from the same governed, centralized definitions. There’s no extract layer quietly drifting out of sync. The PDF your CFO receives is powered by the same logic the analyst sees.
Consistency stops being a discipline and becomes a property of the system.
Personalization at scale – without cloning dashboards
In older BI tools, personalization often meant duplication. One dashboard per region. One per sales rep. One per customer. One per whatever dimension leadership decided to care about that quarter.
It worked – until it didn’t. Every filter added technical debt. Every request for “one more version” added drift. And suddenly a BI team was maintaining 70 dashboards that were identical in purpose but subtly inconsistent in definition.
Modern automated reporting solves this with identity-aware logic:
- Row-level security
- Identity filters
- “Current user” context
- Parameterised fields
- Automated filter looping (“cycle through values”)
Astrato’s cycle-through-values feature is especially powerful. It takes a single governed template and automatically generates personalized variants for every rep, region, or customer, without the BI team lifting a finger after setup.
One analytics lead summed it up perfectly:
“We replaced 120 cloned dashboards with one schedule. Maintenance dropped by 90%.”
That’s not convenience, it’s architectural sanity.
Delivering insights where people actually work
If you sit in a BI team, it’s easy to believe people live inside dashboards. But open any laptop on any team outside data and you’ll see the real operating system: inboxes, calendars, Slack, Teams, mobile notifications.
Automated reporting works because it respects this truth. It doesn’t ask people to “go see what changed” – it delivers what changed directly to where they already are.
Email remains the main channel because of its universality. But high-performing teams increasingly distribute reports through:
- Slack and Teams summaries
- File drops (S3, SharePoint, OneDrive)
- Internal portals
- Customer-facing analytics surfaces
- Embedded reports inside SaaS products
One CRM vendor shared a telling datapoint after adopting automated reports:
“Customers ignored dashboards, but our weekly summary email had a 93% open rate.”
Adoption follows distribution, not interactivity.
Branding + auditability = credibility
A scheduled report is not just information. It’s a signal of competence. Internally, branding improves readability and comprehension. Externally – for SaaS teams – it becomes part of the product experience.
If a customer receives a poorly formatted, off-brand PDF, they assume the product is equally unpolished. If the report looks like your product, uses your colours, and follows your typography, it feels like something they can trust.
But branding is only half of credibility.The other half is auditability.
BI teams increasingly need visibility into what was sent, when, to whom, with which filters, and generated from which source. Compliance teams want delivery logs. Finance teams need timestamp consistency. Customer teams need to prove “this is what we sent you.”
Modern automated reporting systems (including Astrato) now support:
- Encrypted attachments
- Verified external sending domains
- Version-consistent exports
- Timestamped run histories
- Last run / next run / status observability
This is how automated reporting transitions from a convenience feature to dependable operational infrastructure.
When reporting becomes predictable, governed, and observable, it stops being a chore and becomes a strategic asset.
Types of Automated Reports (and when they matter most)
Operational pulse reports
Operational teams don’t need dashboards; they need heartbeat signals. Short, high-frequency reports – hourly warehouse fulfilment updates, daily support SLA snapshots, real-time throughput summaries – keep distributed teams rowing in the same direction.
These aren’t decorative dashboards masquerading as status updates. They are tight, concise snapshots designed to answer one question: are we on track or not?
Astrato’s ability to loop through values and generate separate reports per region, store, or shift makes pulse reporting especially powerful in operations-heavy environments. Instead of asking teams to filter dashboards, the insights find them.
Executive summaries
Executives don’t want feeds. They want synthesis.
Weekly or monthly performance packs – ARR, NRR, retention signals, hiring velocity, anomaly callouts – give leaders the narrative spine of what’s happening in the business. They condense tens of thousands of data points into a story the organisation can act on.
This kind of synthesis is exactly where automated reporting shines, especially when paired with AI-generated summaries. Platforms like Astrato can analyze a dashboard’s underlying metrics and produce an executive-ready narrative: what changed, why it changed, and which areas require attention. Instead of forcing leaders to interpret charts, the system gives them context – the “so what?” that traditionally fell on analysts to produce manually.
For leadership audiences, this is transformative. The report goes beyond communicating numbers to conveying meaning.
And because executive reporting is the most scrutinised part of BI’s output, the consistency of a warehouse-native model matters more here than anywhere. When a CFO steps into a meeting, they cannot afford two versions of revenue. With Astrato, the summaries, charts, and scheduled PDFs all pull from the same governed, live-query definitions, eliminating the risk of quiet extract drift or conflicting logic.
Executive summaries work because they deliver clarity. AI-enhanced executive summaries work because they deliver clarity without friction.
Customer-facing reports (embedded analytics)
For SaaS products, automated reporting often becomes the first analytics feature customers consistently use. It’s simple physics: customers don’t always log in, but they always check their inbox.
A weekly customer health summary, an invoice-level breakdown, a usage recap, a point-in-time performance snapshot – these become high-value touchpoints. When executed well, they quietly improve retention, reduce support queries, and deliver the sense of transparency customers expect from modern software.
Exception-based alerts
Not everything needs a schedule. Some updates should happen only when something changes – a churn risk spike, an unexpected dip in conversion rate, a fraud signal crossing a threshold.
Exception-based reports work because they reduce noise. Instead of delivering information every day, they deliver only when action is required. As anomaly detection and semantic-layer thresholds become more mature, this category will accelerate.
When Automated Reports become a Data Product
For SaaS teams building embedded analytics, automated reporting is no longer a convenience – it’s a product surface. It replaces self-serve exploration for users who prefer curated updates, satisfies contractual or SLA obligations automatically, and creates a predictable rhythm of engagement that can’t be replicated by dashboards alone.
SaaS buyers increasingly expect proactive insight delivery alongside data visualisations. Automated reports provide that, and often serve as the “aha moment” that helps customers unlock the value of the underlying product.
This shift is why more SaaS companies are packaging scheduled reports into enterprise tiers, premium add-ons, or compliance bundles. It’s why customer success teams push for them. And it’s why BI leaders are partnering with product managers to design report templates with the same care as product screens.
In this context, Astrato’s branding control, live-governed metrics, and secure external delivery (encrypted attachments, verified SendGrid domains) become more than BI features – they become product requirements.
Why fully branded reporting matters
Branding isn’t aesthetic decoration; it’s a trust mechanism. A report that matches the visual language of the product or the business feels authoritative. A report that looks misaligned feels like a side project.
Internally, consistent branding reduces confusion and improves readability. Across departments, it eliminates the “what am I looking at?” cognitive tax. Externally, it signals professionalism and product maturity – particularly when reports are customer-facing.
A global HR platform described the difference in stark terms:
“The moment our scheduled reports matched our app’s visual language, usage doubled. Customers forwarded them to CFOs and CHROs.”
Branding earns attention.
Attention earns adoption.
Adoption earns better decisions.
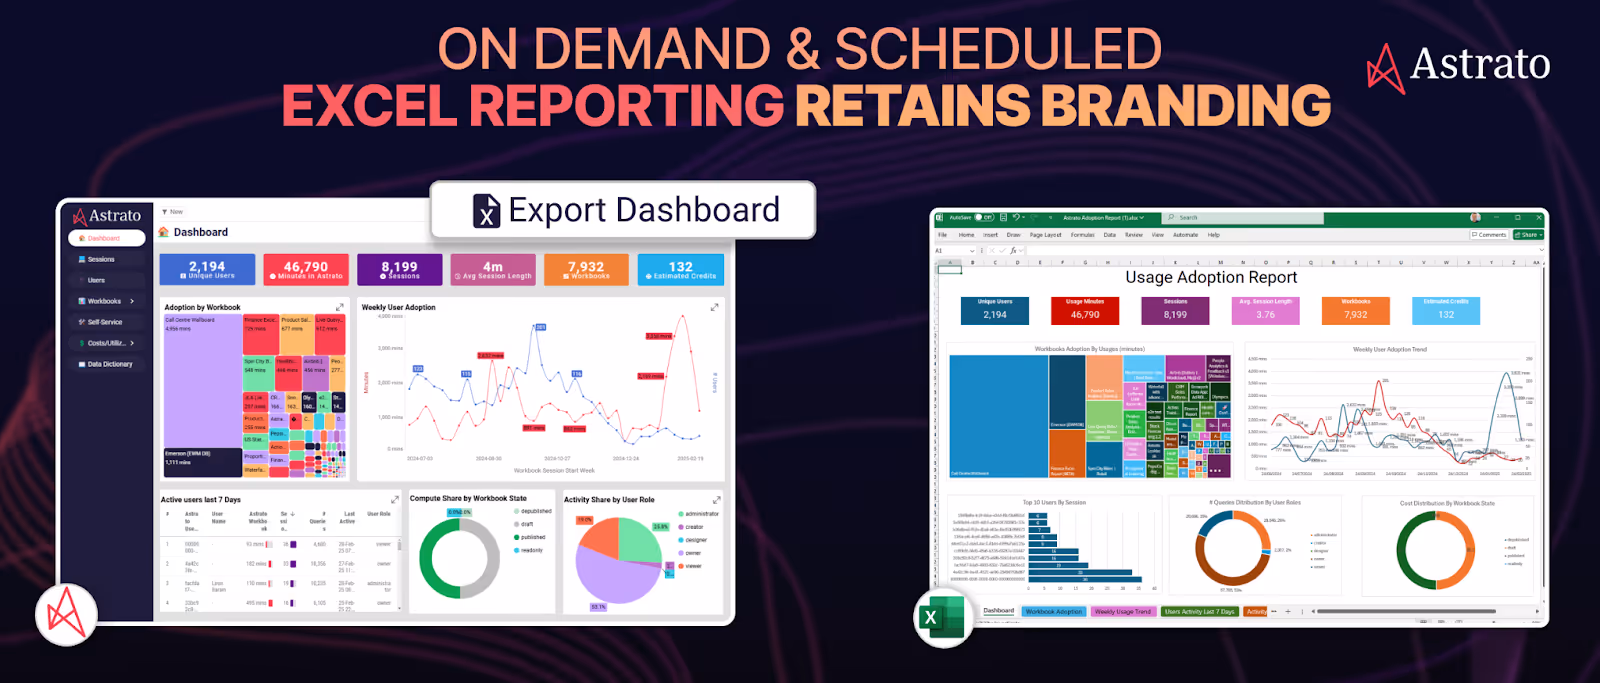
Astrato’s export engine – supporting branded PDF, Excel, image, and PowerPoint outputs – makes this easy, especially when combined with templated layouts and governed definitions. The result is reporting that looks intentional, not improvised.
Implementation: How Automated Reporting Actually Works
Connect governed data
Start with the warehouse and semantic layer. Make sure definitions are stable and accessible from both dashboards and scheduled reports.
Configure scheduling logic
Use cadences that reflect operational rhythms:
- Hourly (logistics, support, IoT monitoring)
- Daily (sales, CS, operations)
- Weekly (leadership, product)
Monthly (finance, board reporting)
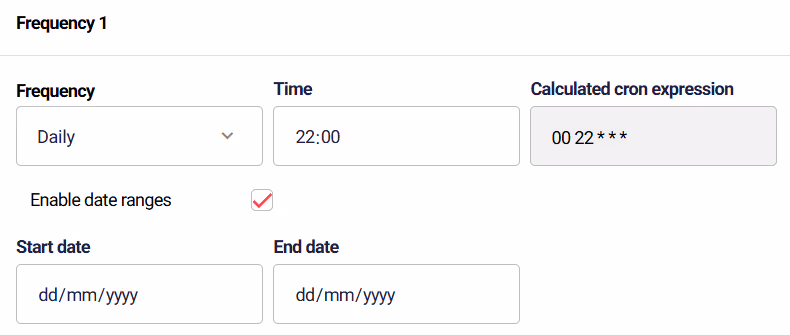
Astrato’s CRON scheduling help data teams automate complex operational patterns.
Enable personalization
Use RLS, identity filters, and field loops so each recipient receives a relevant slice – without duplicated dashboards.
Design for clarity
Focus on legible layouts, descriptive labels, anomalies, and consistent formatting. Avoid over-designing; clarity wins.
Deliver & monitor
Monitor run history, failures, delivery success, and attachment security. Automated reporting should be as observable as any other data pipeline.
Governance, Security & RLS
Modern automated reporting intersects with compliance, security, and identity management more directly than dashboards do. Data leaders consistently prioritise three areas:
Identity-aware access as the first line of defence
Every report must deliver only the data a recipient is authorised to see – internally or externally. Row-level and column-level security (RLS/CLS) ensure that two users receiving the same report template get different, context-appropriate data slices.
For BI teams supporting multi-region or multi-tenant architectures, identity filtering is the cornerstone of safe report automation.
Secure external distribution & data protection controls
External distribution (customers, partners, suppliers) introduces greater risk. Modern automated reporting systems support:
- Encrypted attachments
- Verified sending domains
- Controlled attachment formats
- Logged delivery attempts
- Recipient-level access restrictions
These controls ensure reports do not become accidental data leaks. Astrato’s encrypted attachments and external email sending via verified SendGrid domains meet these needs directly.
Auditability & compliance
In many sectors, scheduled reports serve as compliance artefacts. BI leaders must be able to answer:
- What was sent?
- When was it sent?
- To whom?
- With which logic and metrics?
- Based on which dataset and timestamp?
Astrato’s run history (Last Run / Next Run / Status) provides the necessary observability to satisfy internal audit, SOC2, SOX, ISO, and regulatory workflows.
Metric governance as the backbone
Governance is not only about security – it’s about consistency. Automated reports must reflect the same definitions used in dashboards and self-serve analytics. BI teams increasingly rely on:
- semantic layers
- version-controlled SQL logic
- warehouse-driven metrics
- consistent naming
- centrally managed transformations
Without metric governance, automated reporting becomes a fast, automated way to deliver inconsistent numbers.
The Future of Automated Reporting: 4 Trends BI Leaders Should Prepare For
Automated reporting is shifting from “scheduled PDFs” to a broader insight delivery layer.
Instead of predicting every possible trend, BI teams should anchor on the four transformations that are reshaping how organisations consume information – and what they must build into their data stack.
1. Reporting will shift from time-based to event-driven
Most automated reports today run on fixed cadences. But over the next few years, BI teams will increasingly trigger reports based on data conditions, not dates:
- A churn risk score jumps
- Conversion rate drops unexpectedly
- SLA performance slips below target
- Fraud signals exceed baseline
Why it matters:
Event-driven reporting reduces noise and raises the signal. Instead of overwhelming teams with daily exports, it ensures insights arrive only when something requires action.
How BI leaders can prepare:
- Invest in anomaly detection or threshold-based alert logic
- Store key business thresholds centrally (semantic layer or config tables)
- Ensure scheduled report systems can run on-demand as well as on schedule
2. “Narrative-first” reports will become standard
Reports will increasingly include machine-generated summaries, change explanations, and contextual commentary – especially for exec audiences.
This doesn’t replace dashboards; it reduces interpretive workload.
Why it matters:
Executives skim. Managers need clarity. Analysts want fewer “What changed?” emails.
How BI leaders can prepare:
- Ensure governance of metric definitions (AI narratives rely heavily on them)
- Capture historical trends to enable meaningful comparisons
- Build templates where narrative blocks sit alongside charts, not beneath them
3. Delivery will become multi-channel and embedded
BI leaders must plan for automated insights to appear not just in inboxes, but in:
- Slack and Teams
- In-product notifications
- Mobile apps
- Customer dashboards
- API endpoints
- Partner portals
Reports are expanding from files into interactions.
Why it matters:
This is where adoption happens. Users engage where they work, not where BI platforms hope they’ll go.
How BI leaders can prepare:
- Standardise output formats (PDF, CSV, PPT, image)
- Integrate identity context into every channel
- Establish a unified notifications strategy with product and engineering
4. Automated reporting will evolve into a revenue-aligned data product
SaaS companies are already packaging recurring insights as:
- part of enterprise tiers
- customer-facing analytics add-ons
- SLA deliverables
- compliance artefacts
- retention-driving “insight bundles”
This trend will expand as customers expect more guidance, not more charts.
Why it matters:
Automated reporting becomes not just a BI function, but a product capability that differentiates platforms.
How BI leaders can prepare:
- Build reusable report templates with brand and variable support
- Ensure external distribution is secure (RLS, encryption, domain verification)
- Work with product teams on tiering and packaging
Where this is all heading: Operational Intelligence Systems
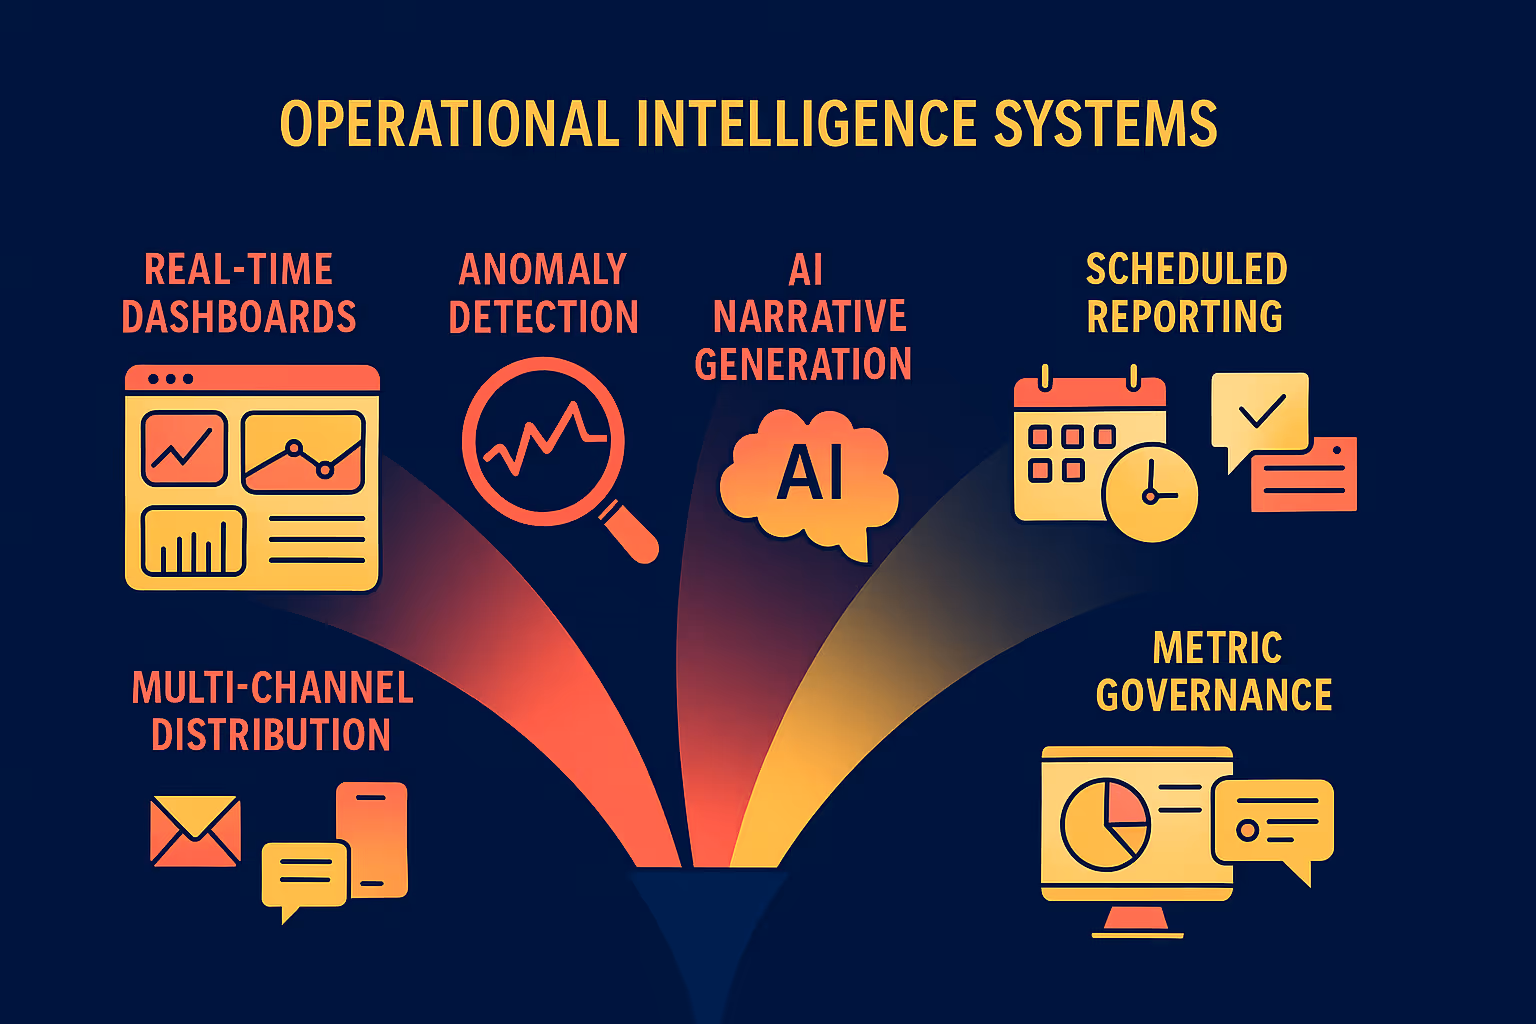
The convergence of:
- real-time dashboards
- anomaly detection
- AI narrative generation
- scheduled reporting
- multi-channel distribution
- metric governance
…is creating a new operational layer for organisations.
These systems won’t “send reports” – they’ll coordinate insight delivery across channels, providing always-on context about what’s changing inside the business.
For BI leaders, the takeaway is clear:
Build reporting systems that are flexible, governed, identity-aware, and channel-agnostic. What you automate today becomes the foundation for your future insight platform.
Final thoughts on automated reporting in BI
Automated reporting is no longer just a convenience feature. It is a critical operational capability that supports governance, efficiency, data consistency, and stakeholder alignment.
Data leaders don’t need to automate everything at once. Start with your most painful recurring report. Build it on governed metrics. Automate its distribution. Monitor the results. Expand from there.
When done right, automated reporting stops being a workaround and becomes a core part of your organisation’s intelligence layer.
Want to learn more about scheduled reporting in Astrato? Request a demo with our team or Start a Free Trial.
Ready to experience next-gen analytics?
See how Astrato runs natively in your warehouse.


.avif)